library(tidyverse)library(targets)library(here)library(sf)library(ggrepel)library(scales)# Point to the _targets folder location since this qmd is in a subfoldertar_config_set(store = here::here('_targets'),script = here::here('_targets.R'))# Load targetstar_load(ongo)mapdata <-tar_read(ongo_mapdata)invisible(list2env(tar_read(graphic_functions), .GlobalEnv))set_annotation_fonts()
Timeline of ONGO registrations
Code
ggplot(ongo, aes(x = registration_date)) +geom_histogram(binwidth =365.25/4, boundary =ymd("2017-01-01"), fill = clrs[6], color ="white") +scale_x_date(date_breaks ="years", date_labels ="%Y") +labs(x =NULL, y ="Count of new ONGO registrations") +theme_ongo()
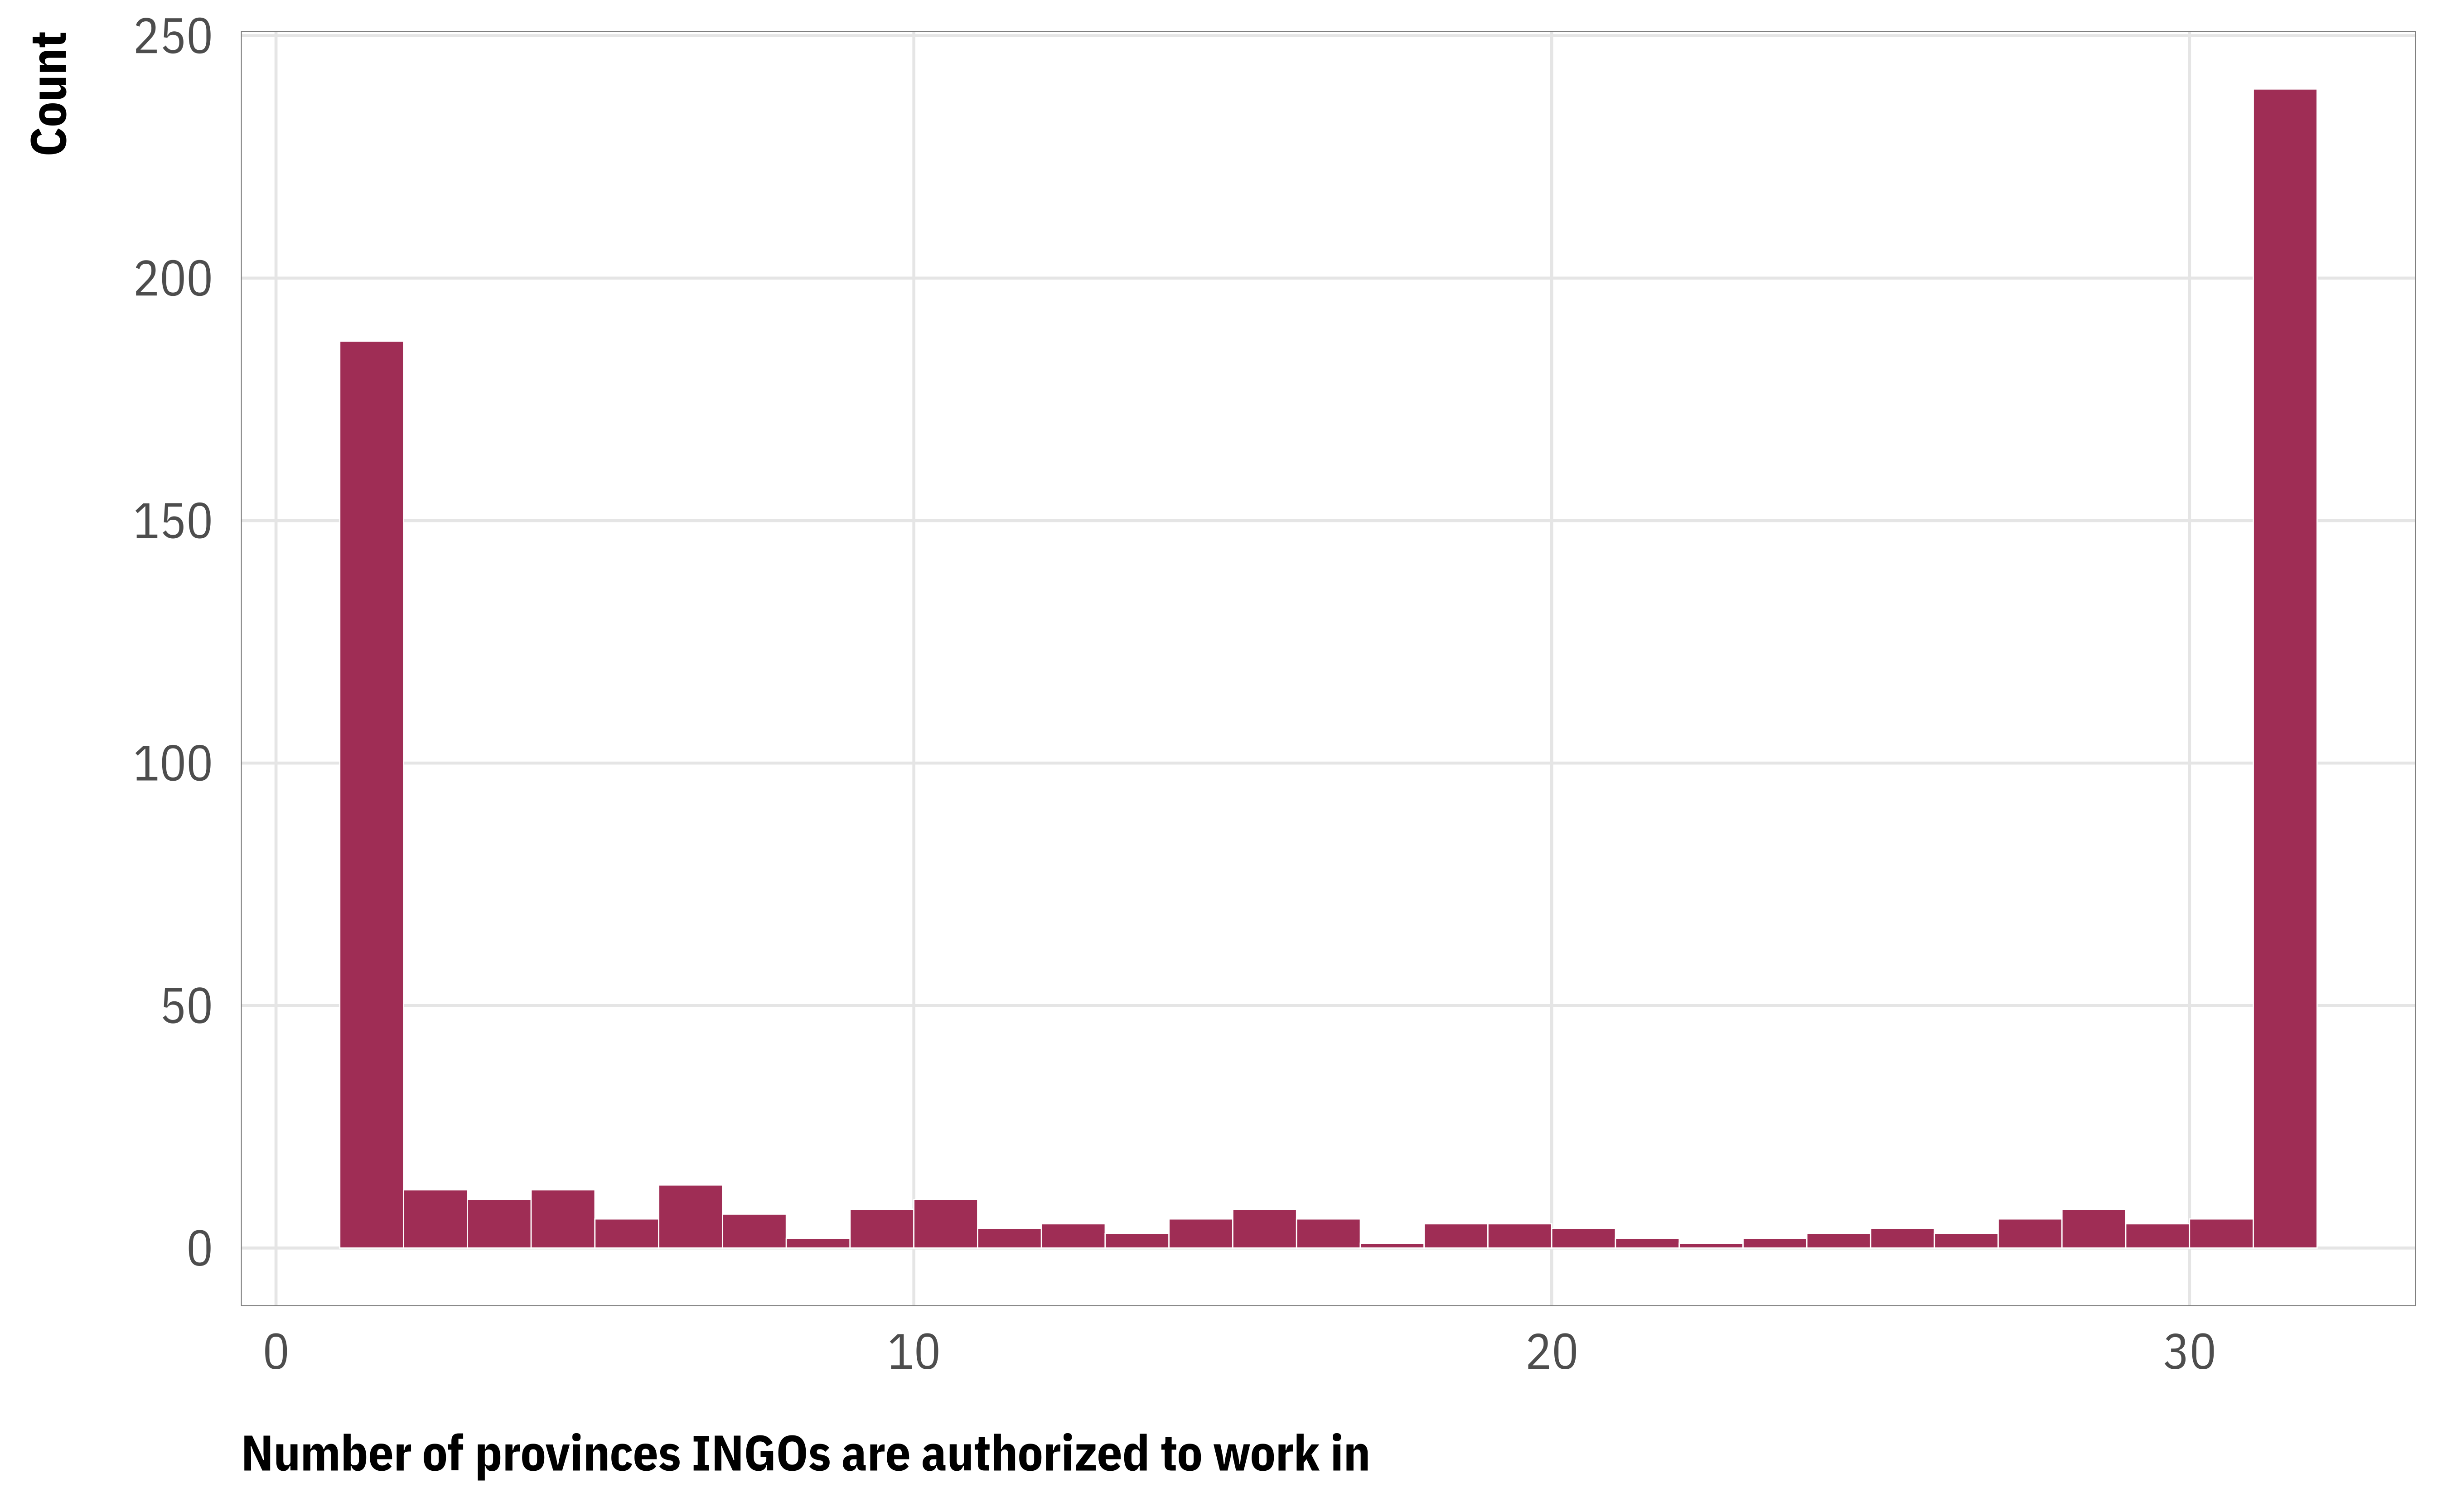
Distribution of outcome
Code
ggplot(ongo, aes(x = province_count)) +geom_histogram(binwidth =1, size =0.1, boundary =0,fill = clrs[6], color ="white") +labs(x ="Number of provinces INGOs are authorized to work in", y ="Count") +theme_ongo()
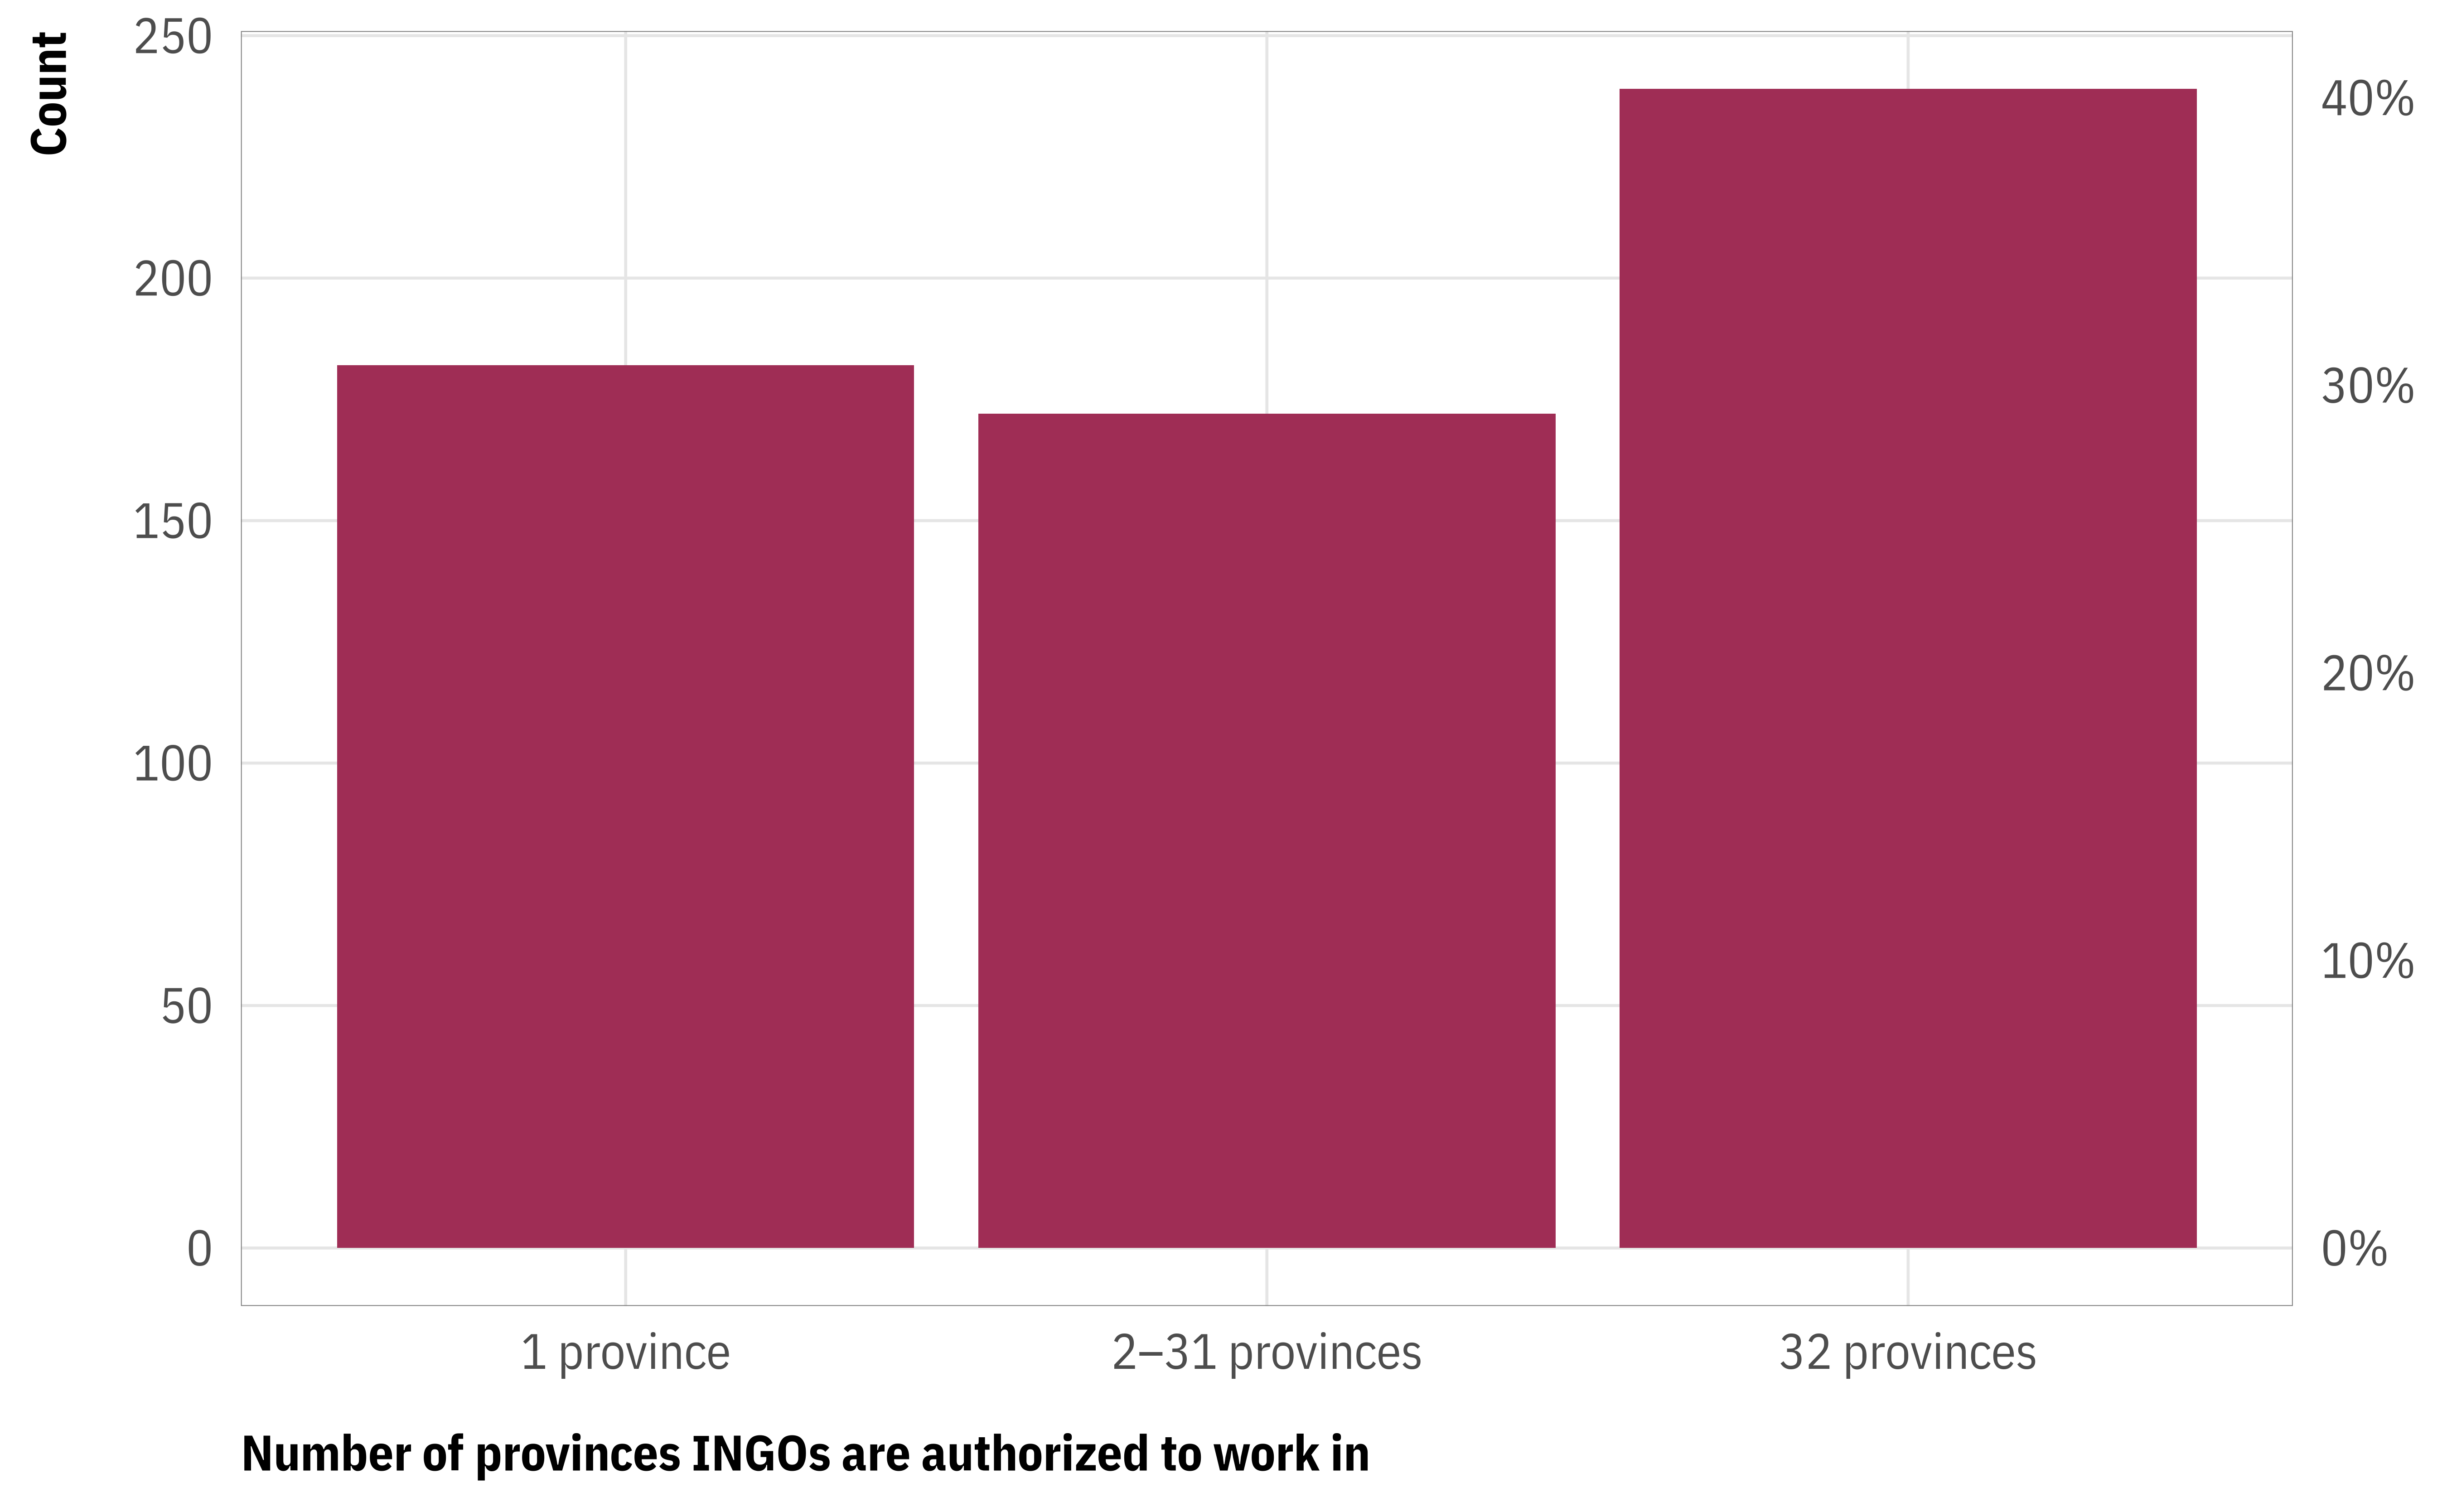
Code
provinces_collapsed <- ongo |>drop_na(province_count) |>mutate(province_count =case_when( province_count ==1~"1 province", province_count >1& province_count <32~"2–31 provinces", province_count ==32~"32 provinces" )) ggplot(provinces_collapsed, aes(x = province_count)) +geom_bar(fill = clrs[6]) +scale_y_continuous(sec.axis =sec_axis(trans =~ . /nrow(provinces_collapsed),labels =label_percent())) +labs(x ="Number of provinces INGOs are authorized to work in", y ="Count") +theme_ongo()
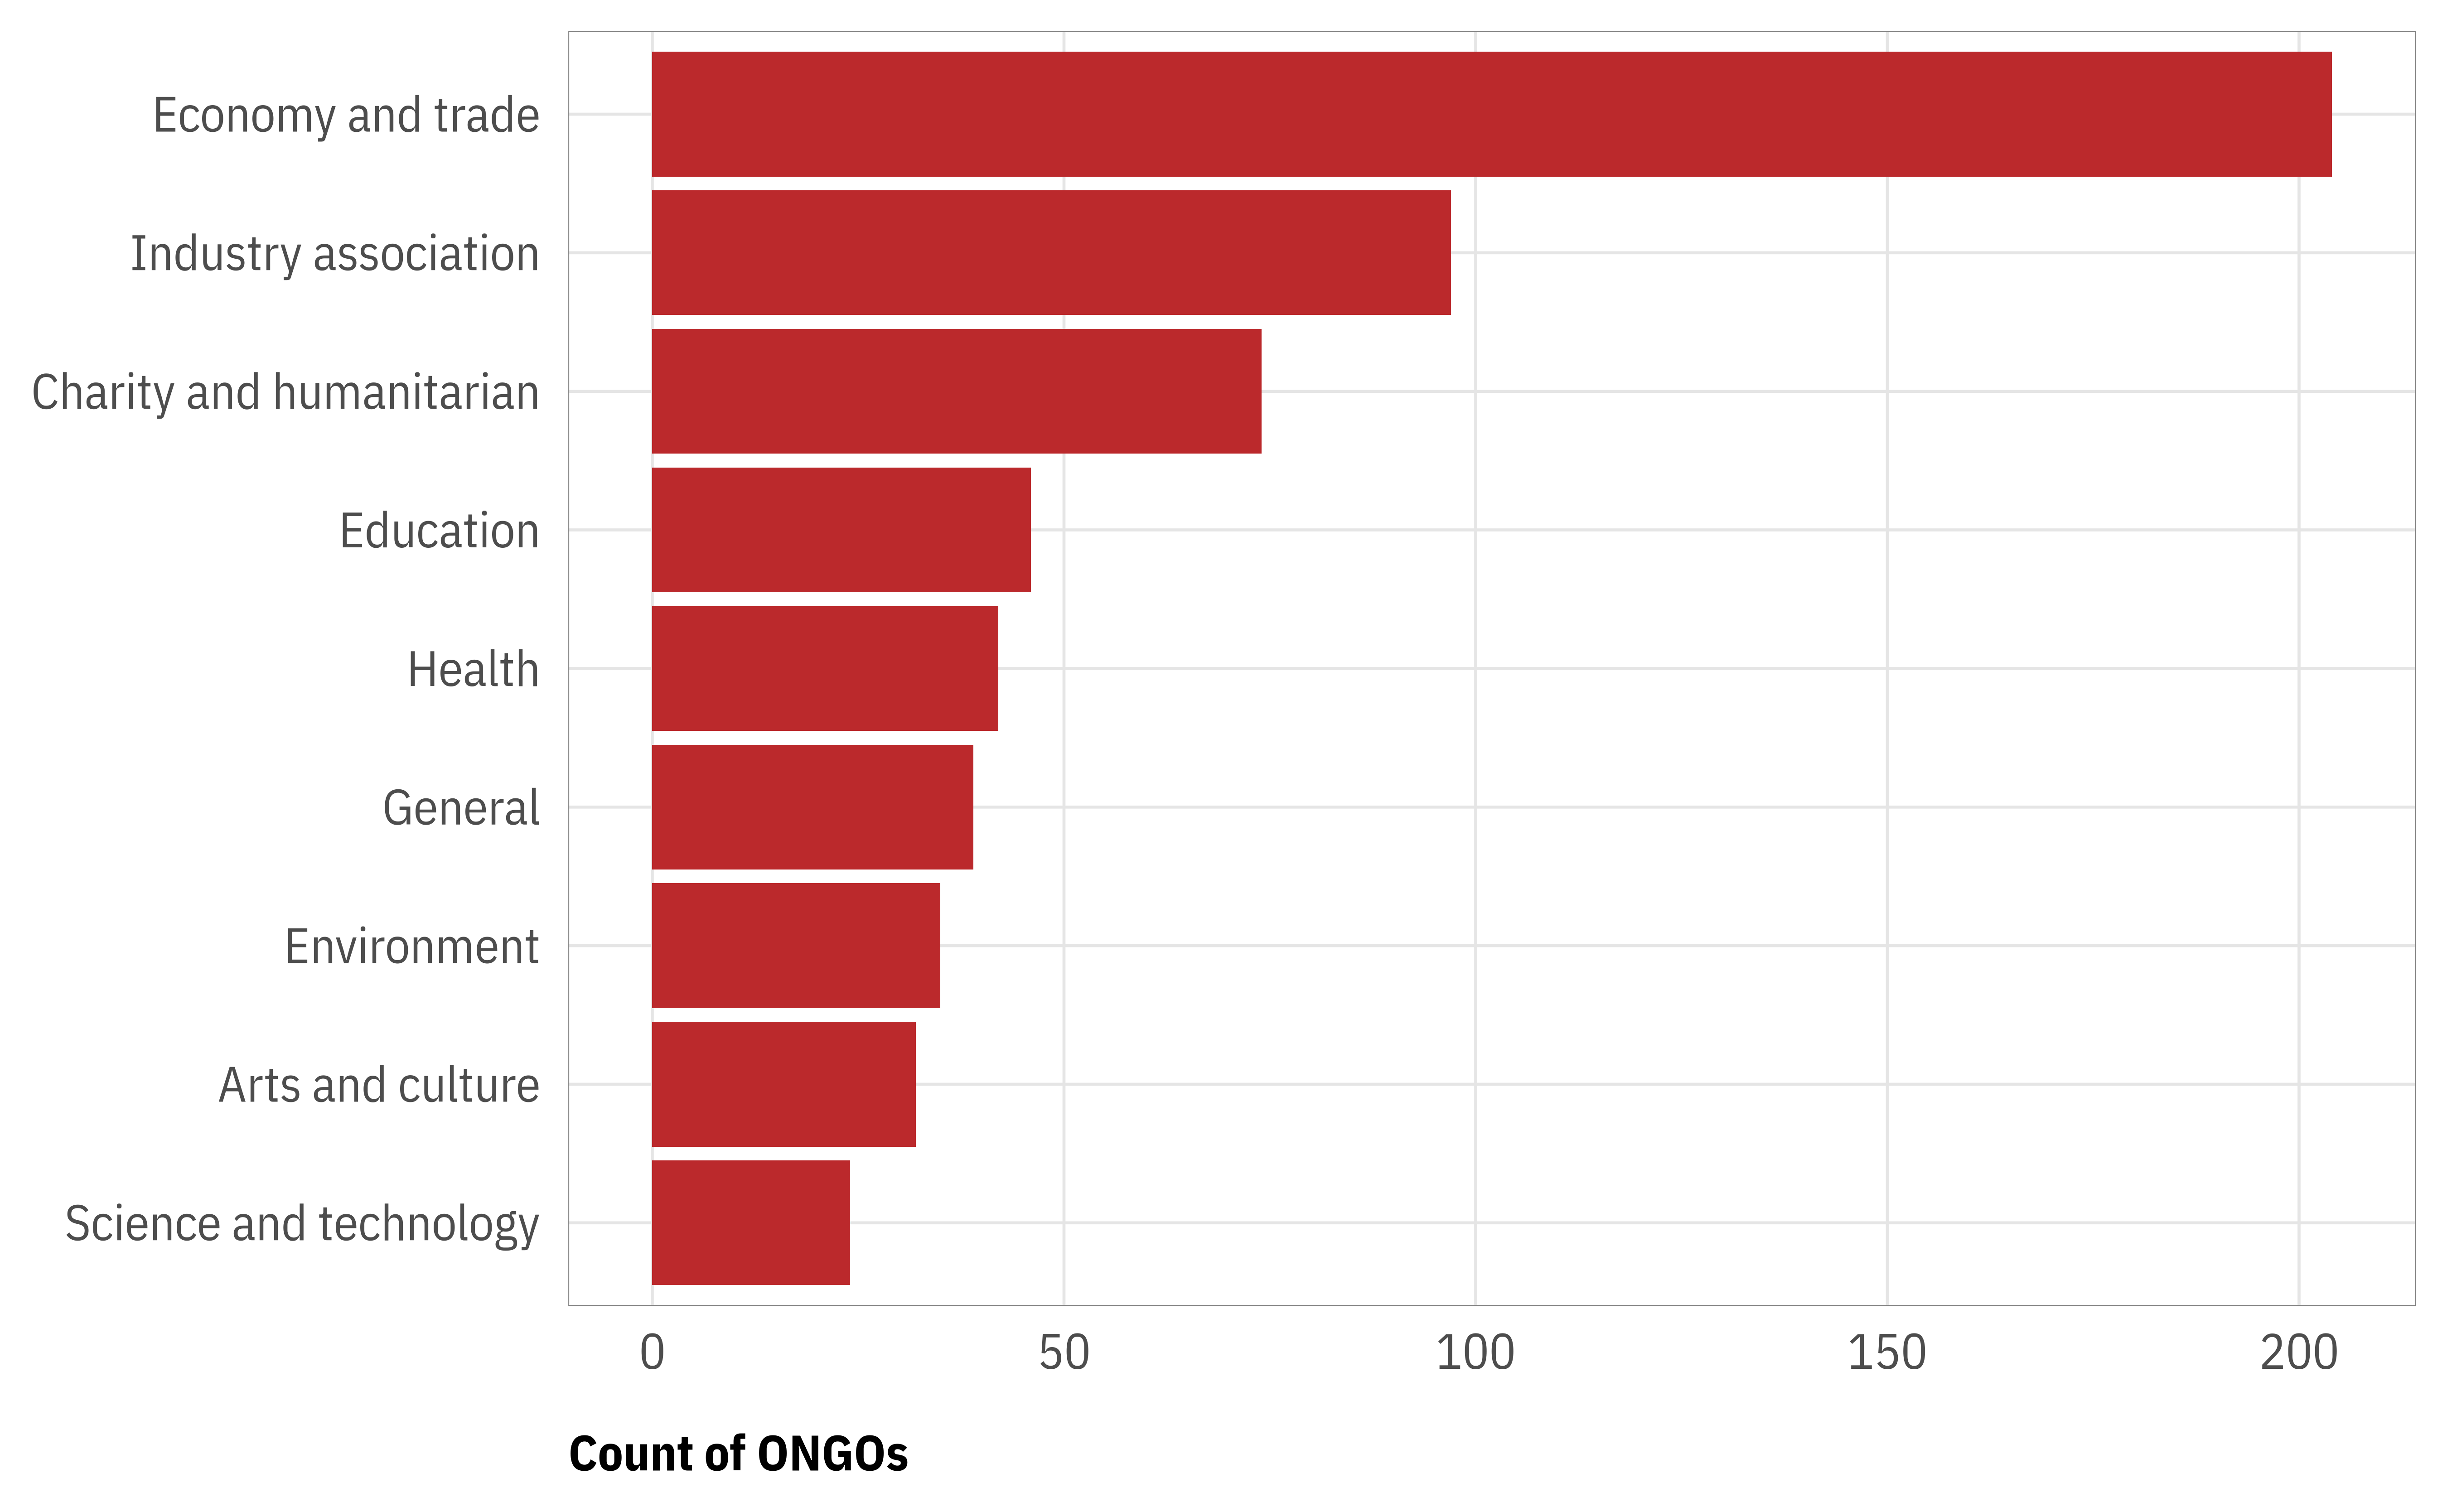
Issue areas
Code
issue_count <- ongo |>drop_na(work_field_code1) |>group_by(work_field_code1) |>summarize(n =n()) |>mutate(work_field_code1 =fct_reorder(work_field_code1, n))ggplot(issue_count, aes(y = work_field_code1, x = n)) +geom_col(fill = clrs[5]) +labs(x ="Count of ONGOs", y =NULL) +theme_ongo()
Map of provinces and counts
Code
# Use aes(geometry) and stat = "sf_coordinates" to make geom_label_repel() work# with geom_sf(): https://github.com/slowkow/ggrepel/issues/111#issuecomment-416853013ggplot() +geom_sf(data = mapdata, aes(fill = ro_count), linewidth =0.3, color ="white") +scale_fill_distiller(palette ="Reds", direction =1, guide ="none") +geom_label_repel(data =filter(mapdata, ro_count >0), aes(label = ro_count, geometry = geometry),stat ="sf_coordinates", seed =1234, label.size =0.1, size =3,segment.color ="black", segment.size =0.5, min.segment.length =0) +coord_sf(crs =st_crs("EPSG:4480")) +# China Geodetic Coordinate System 2000theme_void()
Source Code
---title: Exploratory and descriptive analysis---```{r setup, include=FALSE}knitr::opts_chunk$set(fig.align = "center", fig.retina = 3, fig.width = 6, fig.height = (6 * 0.618), out.width = "80%", collapse = TRUE, dev = "png", dev.args = list(type = "cairo-png"))options(digits = 3, width = 120, dplyr.summarise.inform = FALSE, knitr.kable.NA = "")``````{r load-packages-data, message=FALSE, warning=FALSE}library(tidyverse)library(targets)library(here)library(sf)library(ggrepel)library(scales)# Point to the _targets folder location since this qmd is in a subfoldertar_config_set(store = here::here('_targets'), script = here::here('_targets.R'))# Load targetstar_load(ongo)mapdata <- tar_read(ongo_mapdata)invisible(list2env(tar_read(graphic_functions), .GlobalEnv))set_annotation_fonts()```# Timeline of ONGO registrations```{r plot-registration-timeline}ggplot(ongo, aes(x = registration_date)) + geom_histogram(binwidth = 365.25/4, boundary = ymd("2017-01-01"), fill = clrs[6], color = "white") + scale_x_date(date_breaks = "years", date_labels = "%Y") + labs(x = NULL, y = "Count of new ONGO registrations") + theme_ongo()```# Distribution of outcome```{r province-count-distribution, warning=FALSE}ggplot(ongo, aes(x = province_count)) + geom_histogram(binwidth = 1, size = 0.1, boundary = 0, fill = clrs[6], color = "white") + labs(x = "Number of provinces INGOs are authorized to work in", y = "Count") + theme_ongo()``````{r province-count-collapsed}provinces_collapsed <- ongo |> drop_na(province_count) |> mutate(province_count = case_when( province_count == 1 ~ "1 province", province_count > 1 & province_count < 32 ~ "2–31 provinces", province_count == 32 ~ "32 provinces" )) ggplot(provinces_collapsed, aes(x = province_count)) + geom_bar(fill = clrs[6]) + scale_y_continuous(sec.axis = sec_axis(trans = ~ . / nrow(provinces_collapsed), labels = label_percent())) + labs(x = "Number of provinces INGOs are authorized to work in", y = "Count") + theme_ongo()```# Issue areas```{r plot-ongo-issues}issue_count <- ongo |> drop_na(work_field_code1) |> group_by(work_field_code1) |> summarize(n = n()) |> mutate(work_field_code1 = fct_reorder(work_field_code1, n))ggplot(issue_count, aes(y = work_field_code1, x = n)) + geom_col(fill = clrs[5]) + labs(x = "Count of ONGOs", y = NULL) + theme_ongo()```# Map of provinces and counts```{r ongo-map, fig.height=5, fig.width=7, message=FALSE, warning=FALSE}# Use aes(geometry) and stat = "sf_coordinates" to make geom_label_repel() work# with geom_sf(): https://github.com/slowkow/ggrepel/issues/111#issuecomment-416853013ggplot() + geom_sf(data = mapdata, aes(fill = ro_count), linewidth = 0.3, color = "white") + scale_fill_distiller(palette = "Reds", direction = 1, guide = "none") + geom_label_repel(data = filter(mapdata, ro_count > 0), aes(label = ro_count, geometry = geometry), stat = "sf_coordinates", seed = 1234, label.size = 0.1, size = 3, segment.color = "black", segment.size = 0.5, min.segment.length = 0) + coord_sf(crs = st_crs("EPSG:4480")) + # China Geodetic Coordinate System 2000 theme_void()```