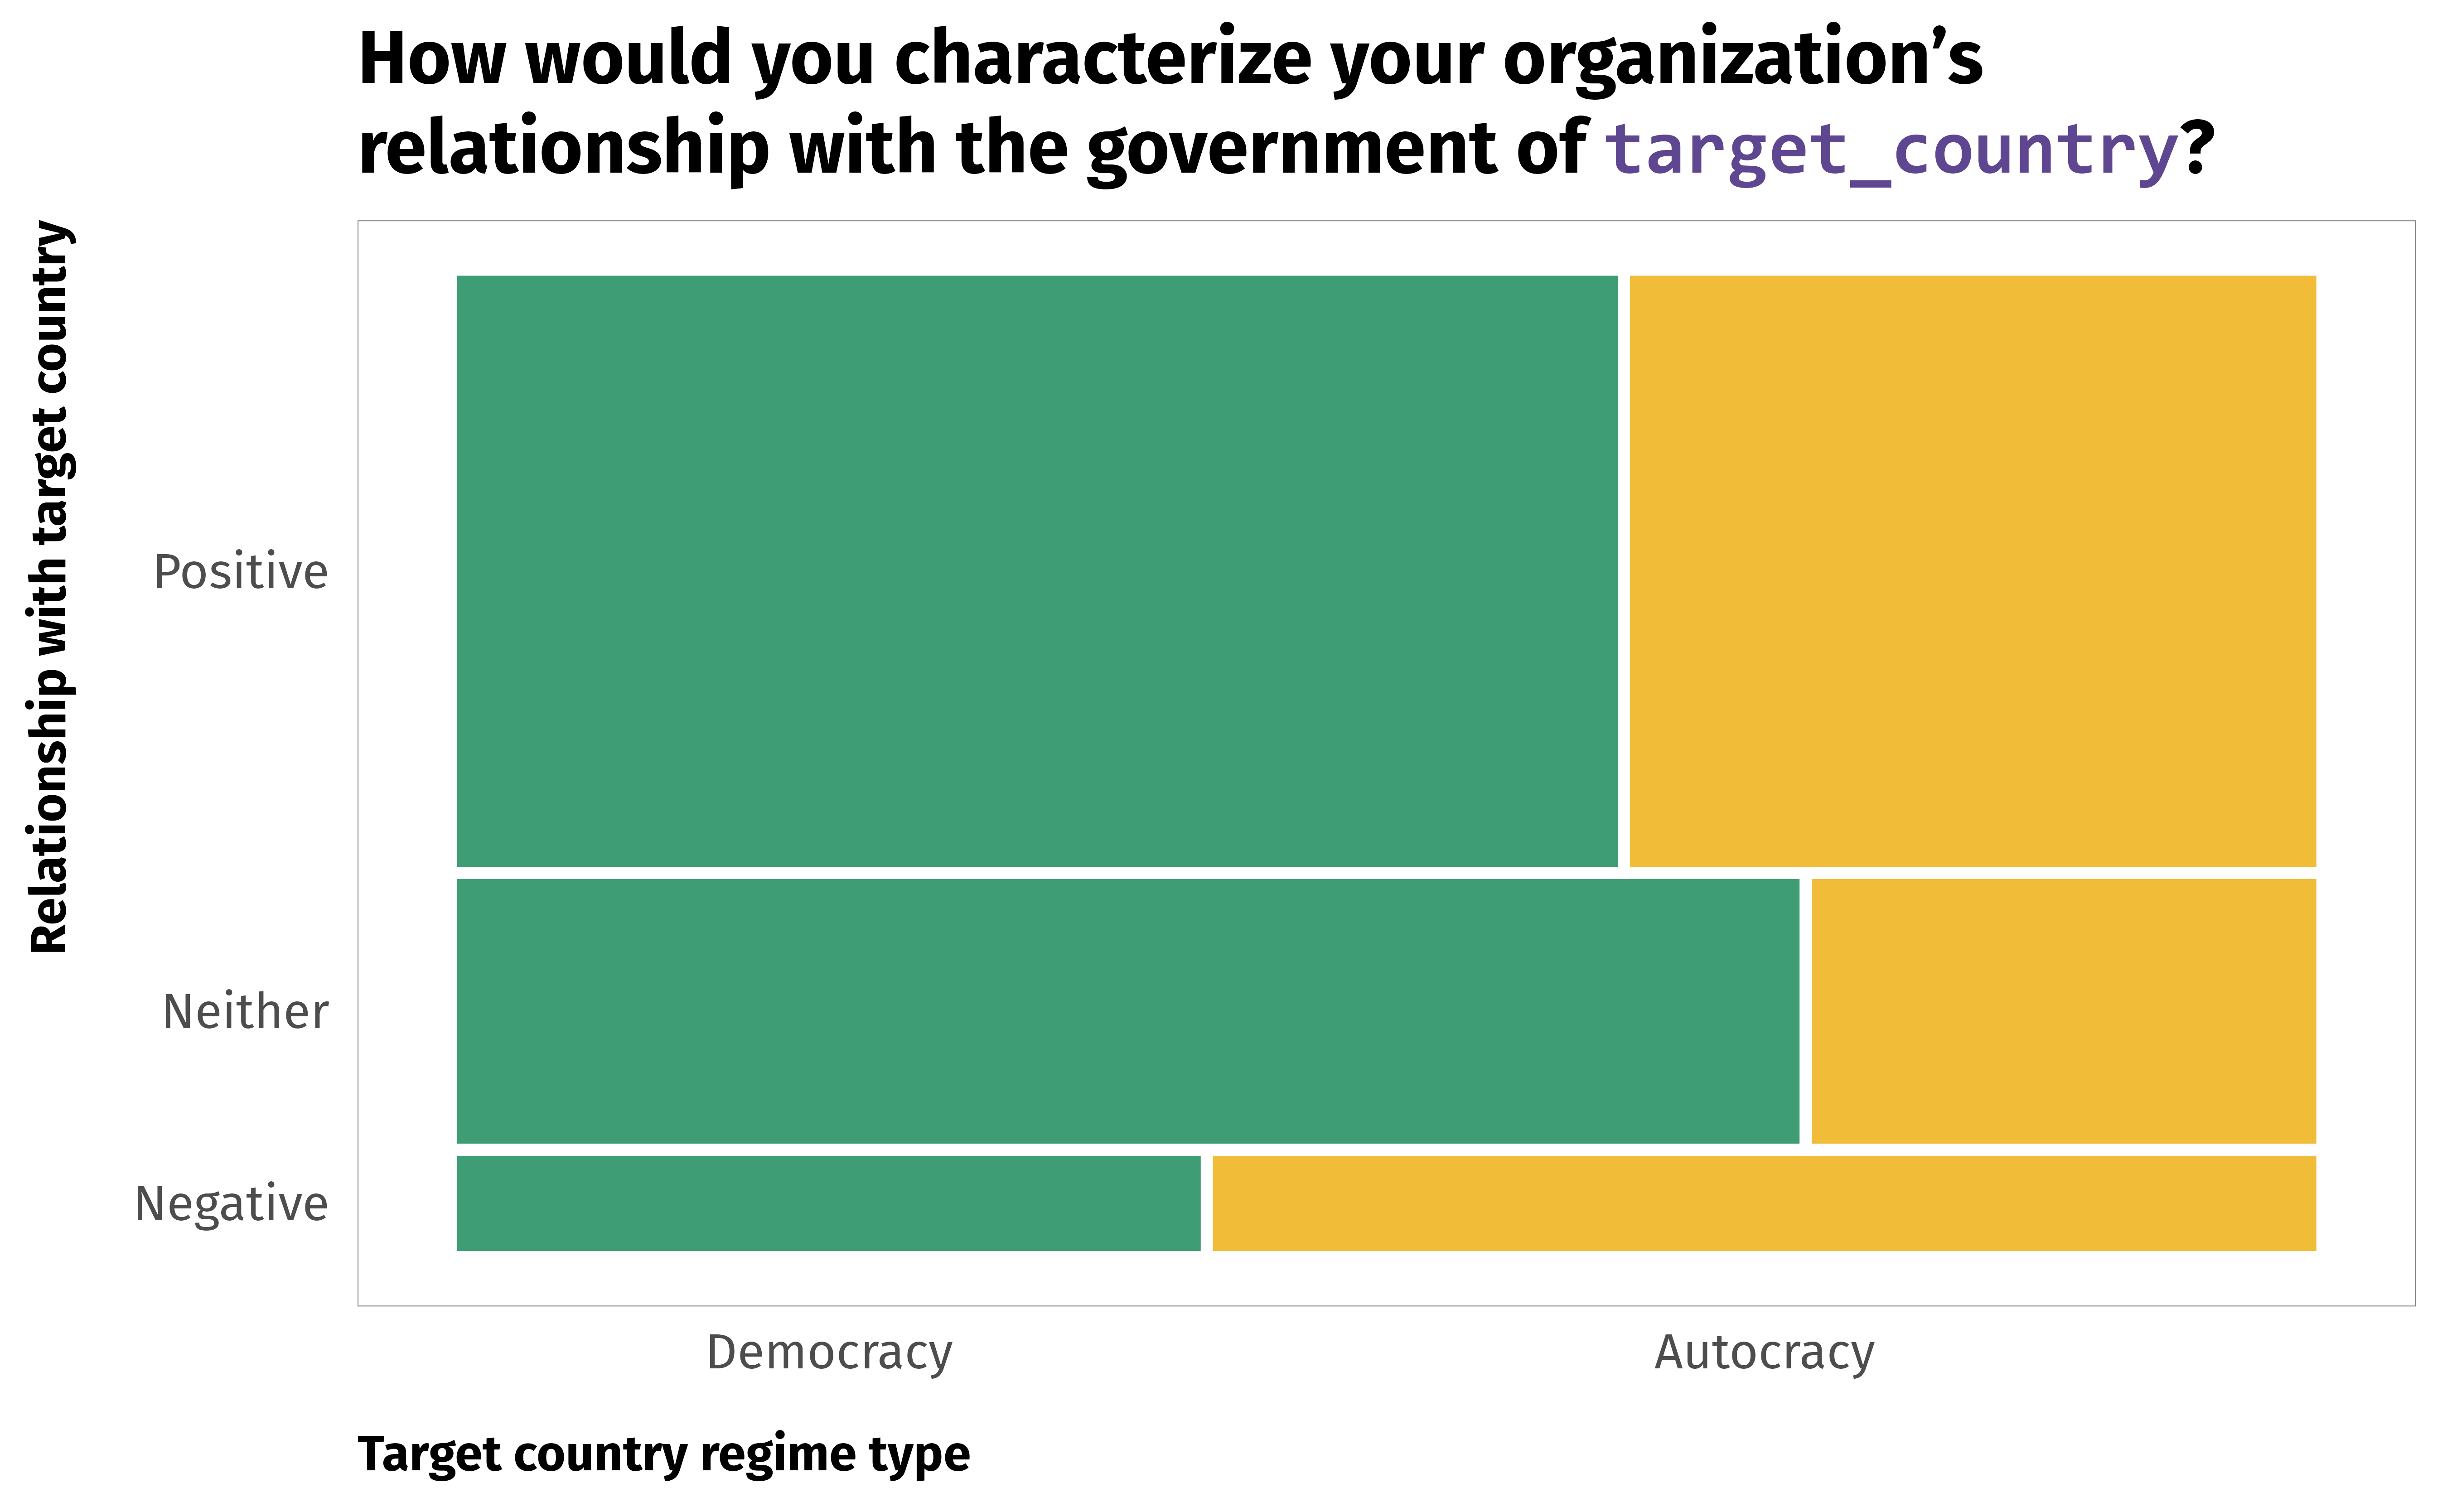
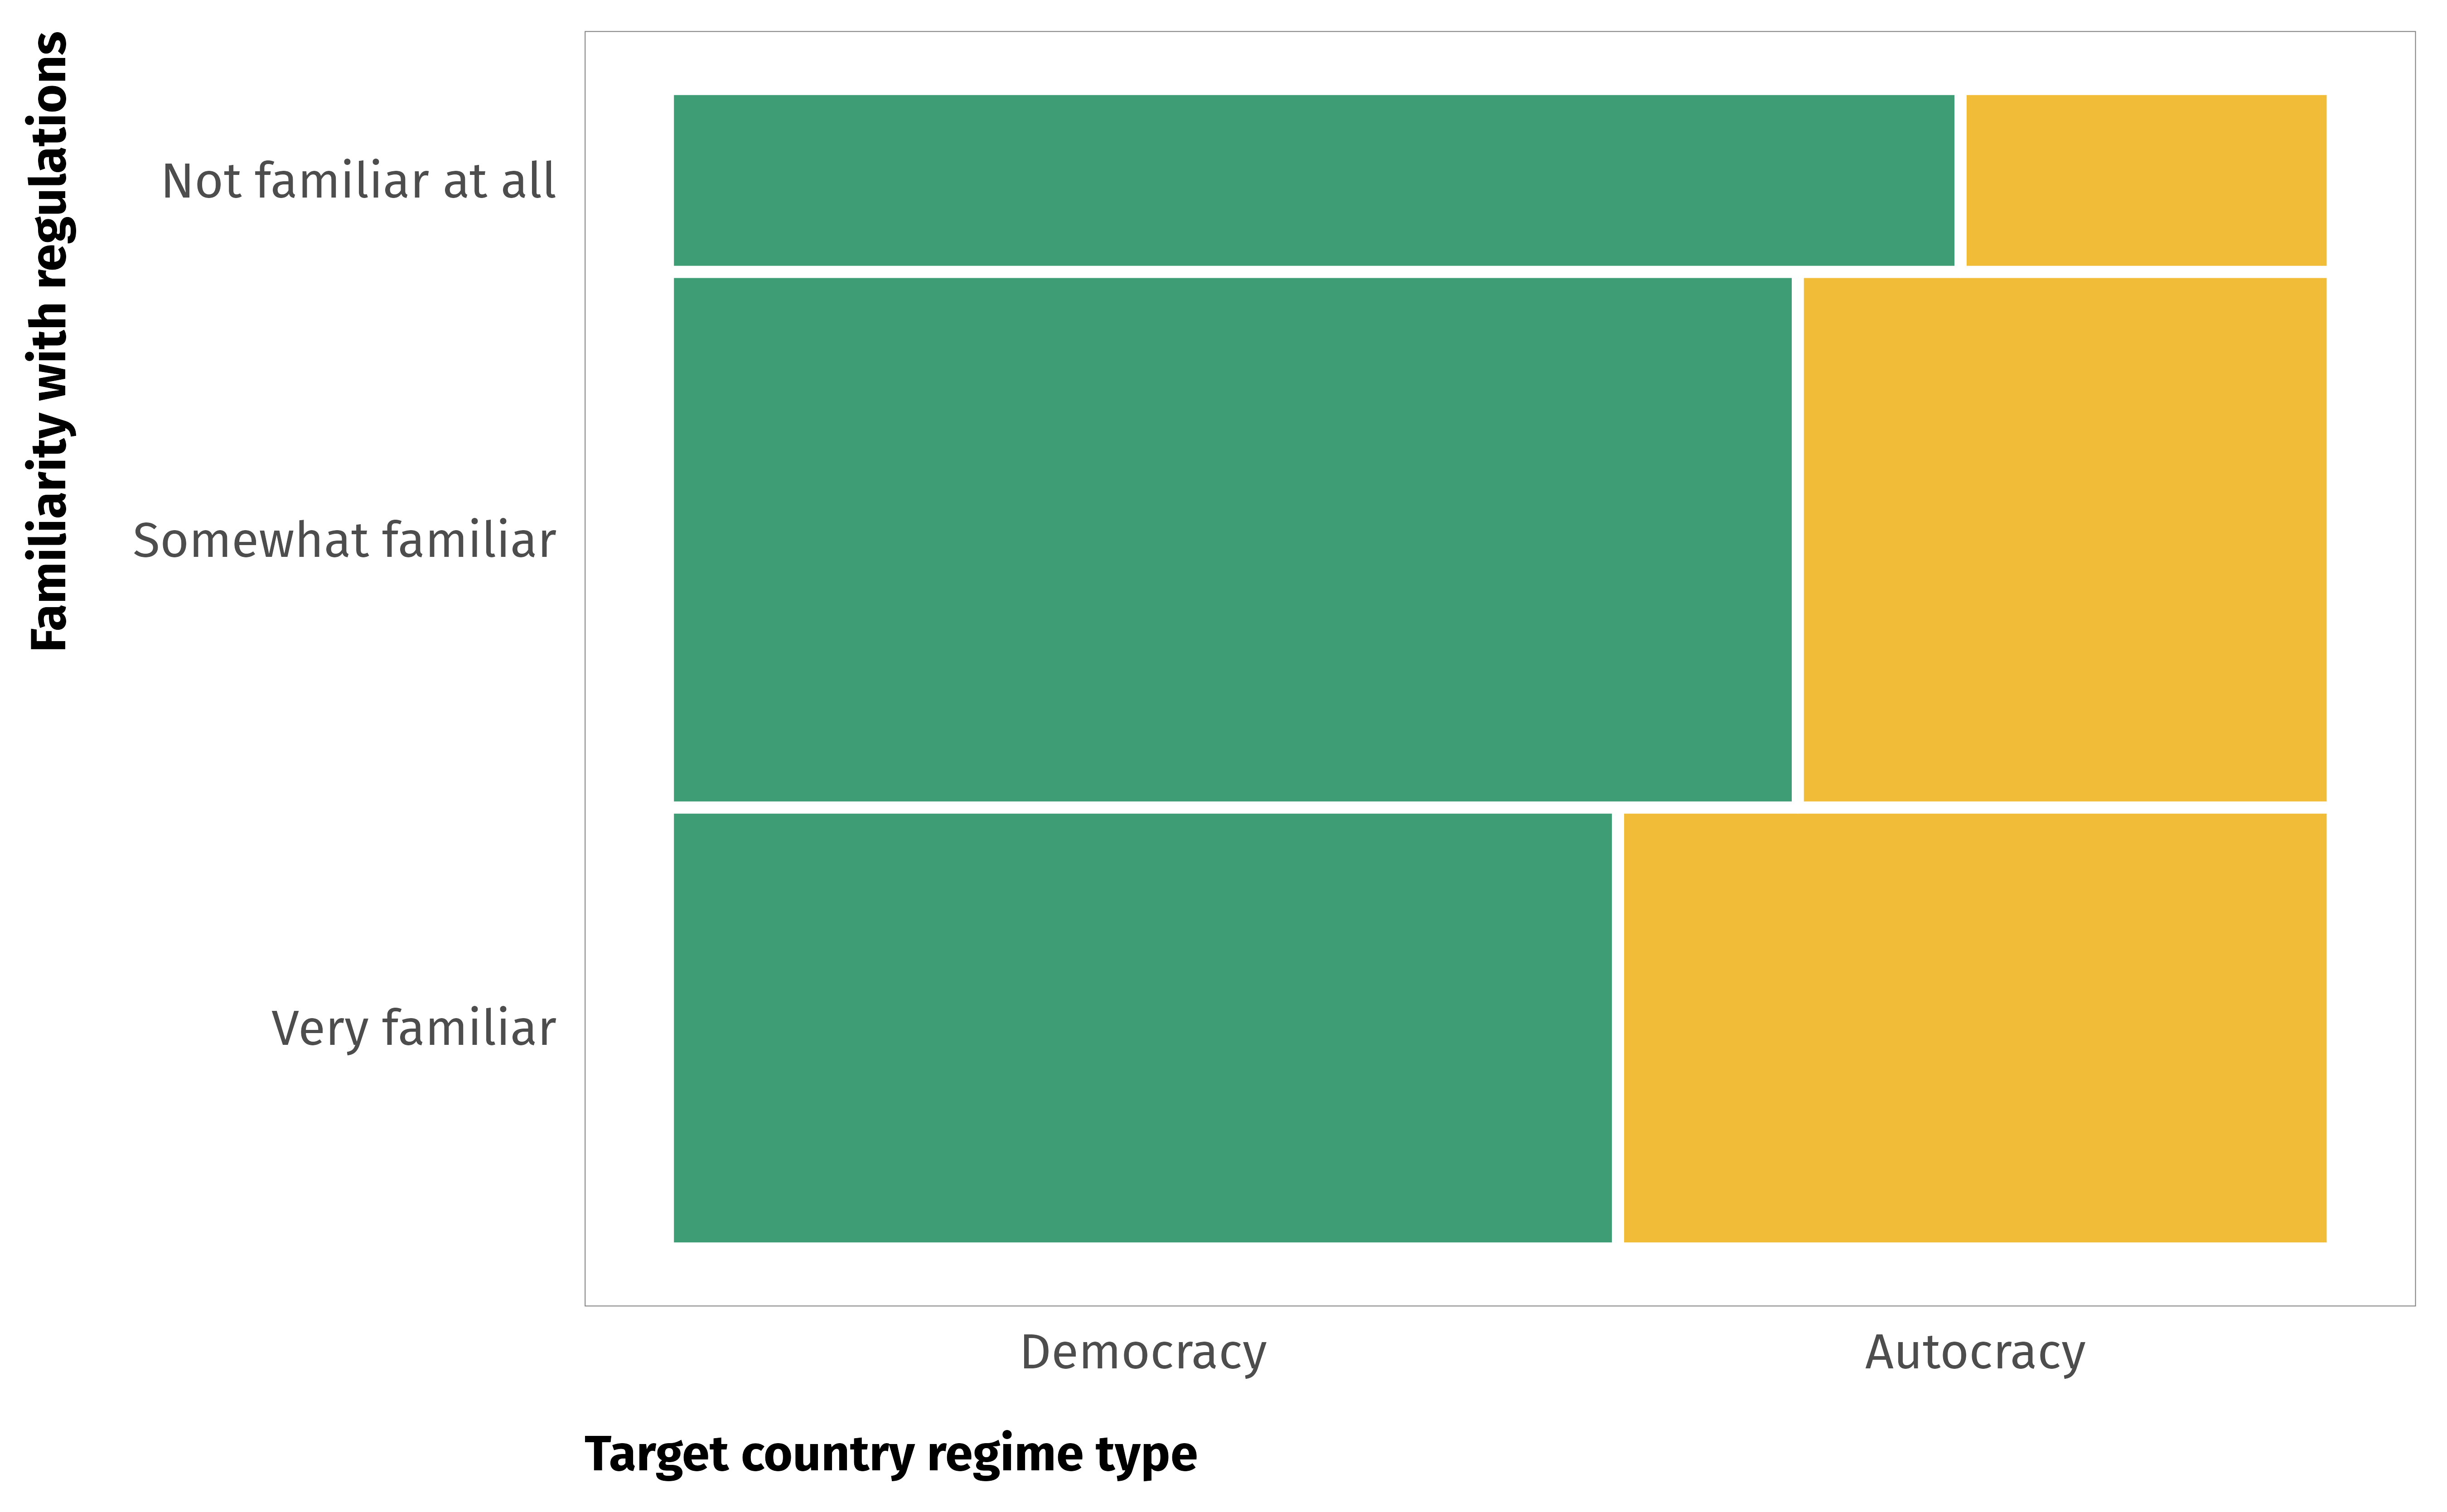
ggplot(data = df_govt_positivity_regime) +geom_mosaic(aes(x =product(target.regime.type, Q4.11_collapsed), fill = target.regime.type),divider =mosaic("v"), offset =0, color ="white", linewidth =1) +scale_fill_manual(values =c(clrs$Prism[4], clrs$Prism[6]),guide ="none") +labs(x ="Target country regime type",y ="Relationship with target country",title =glue("How would you characterize your organization’s<br>","relationship with the government of {country}?",country =build_span("target_country",c("font-family"="Consolas", "color"= clrs$Prism[1])))) +theme_ingo() +theme(panel.grid.major.x =element_blank(),panel.grid.major.y =element_blank(),plot.title =element_markdown(lineheight =1.2))
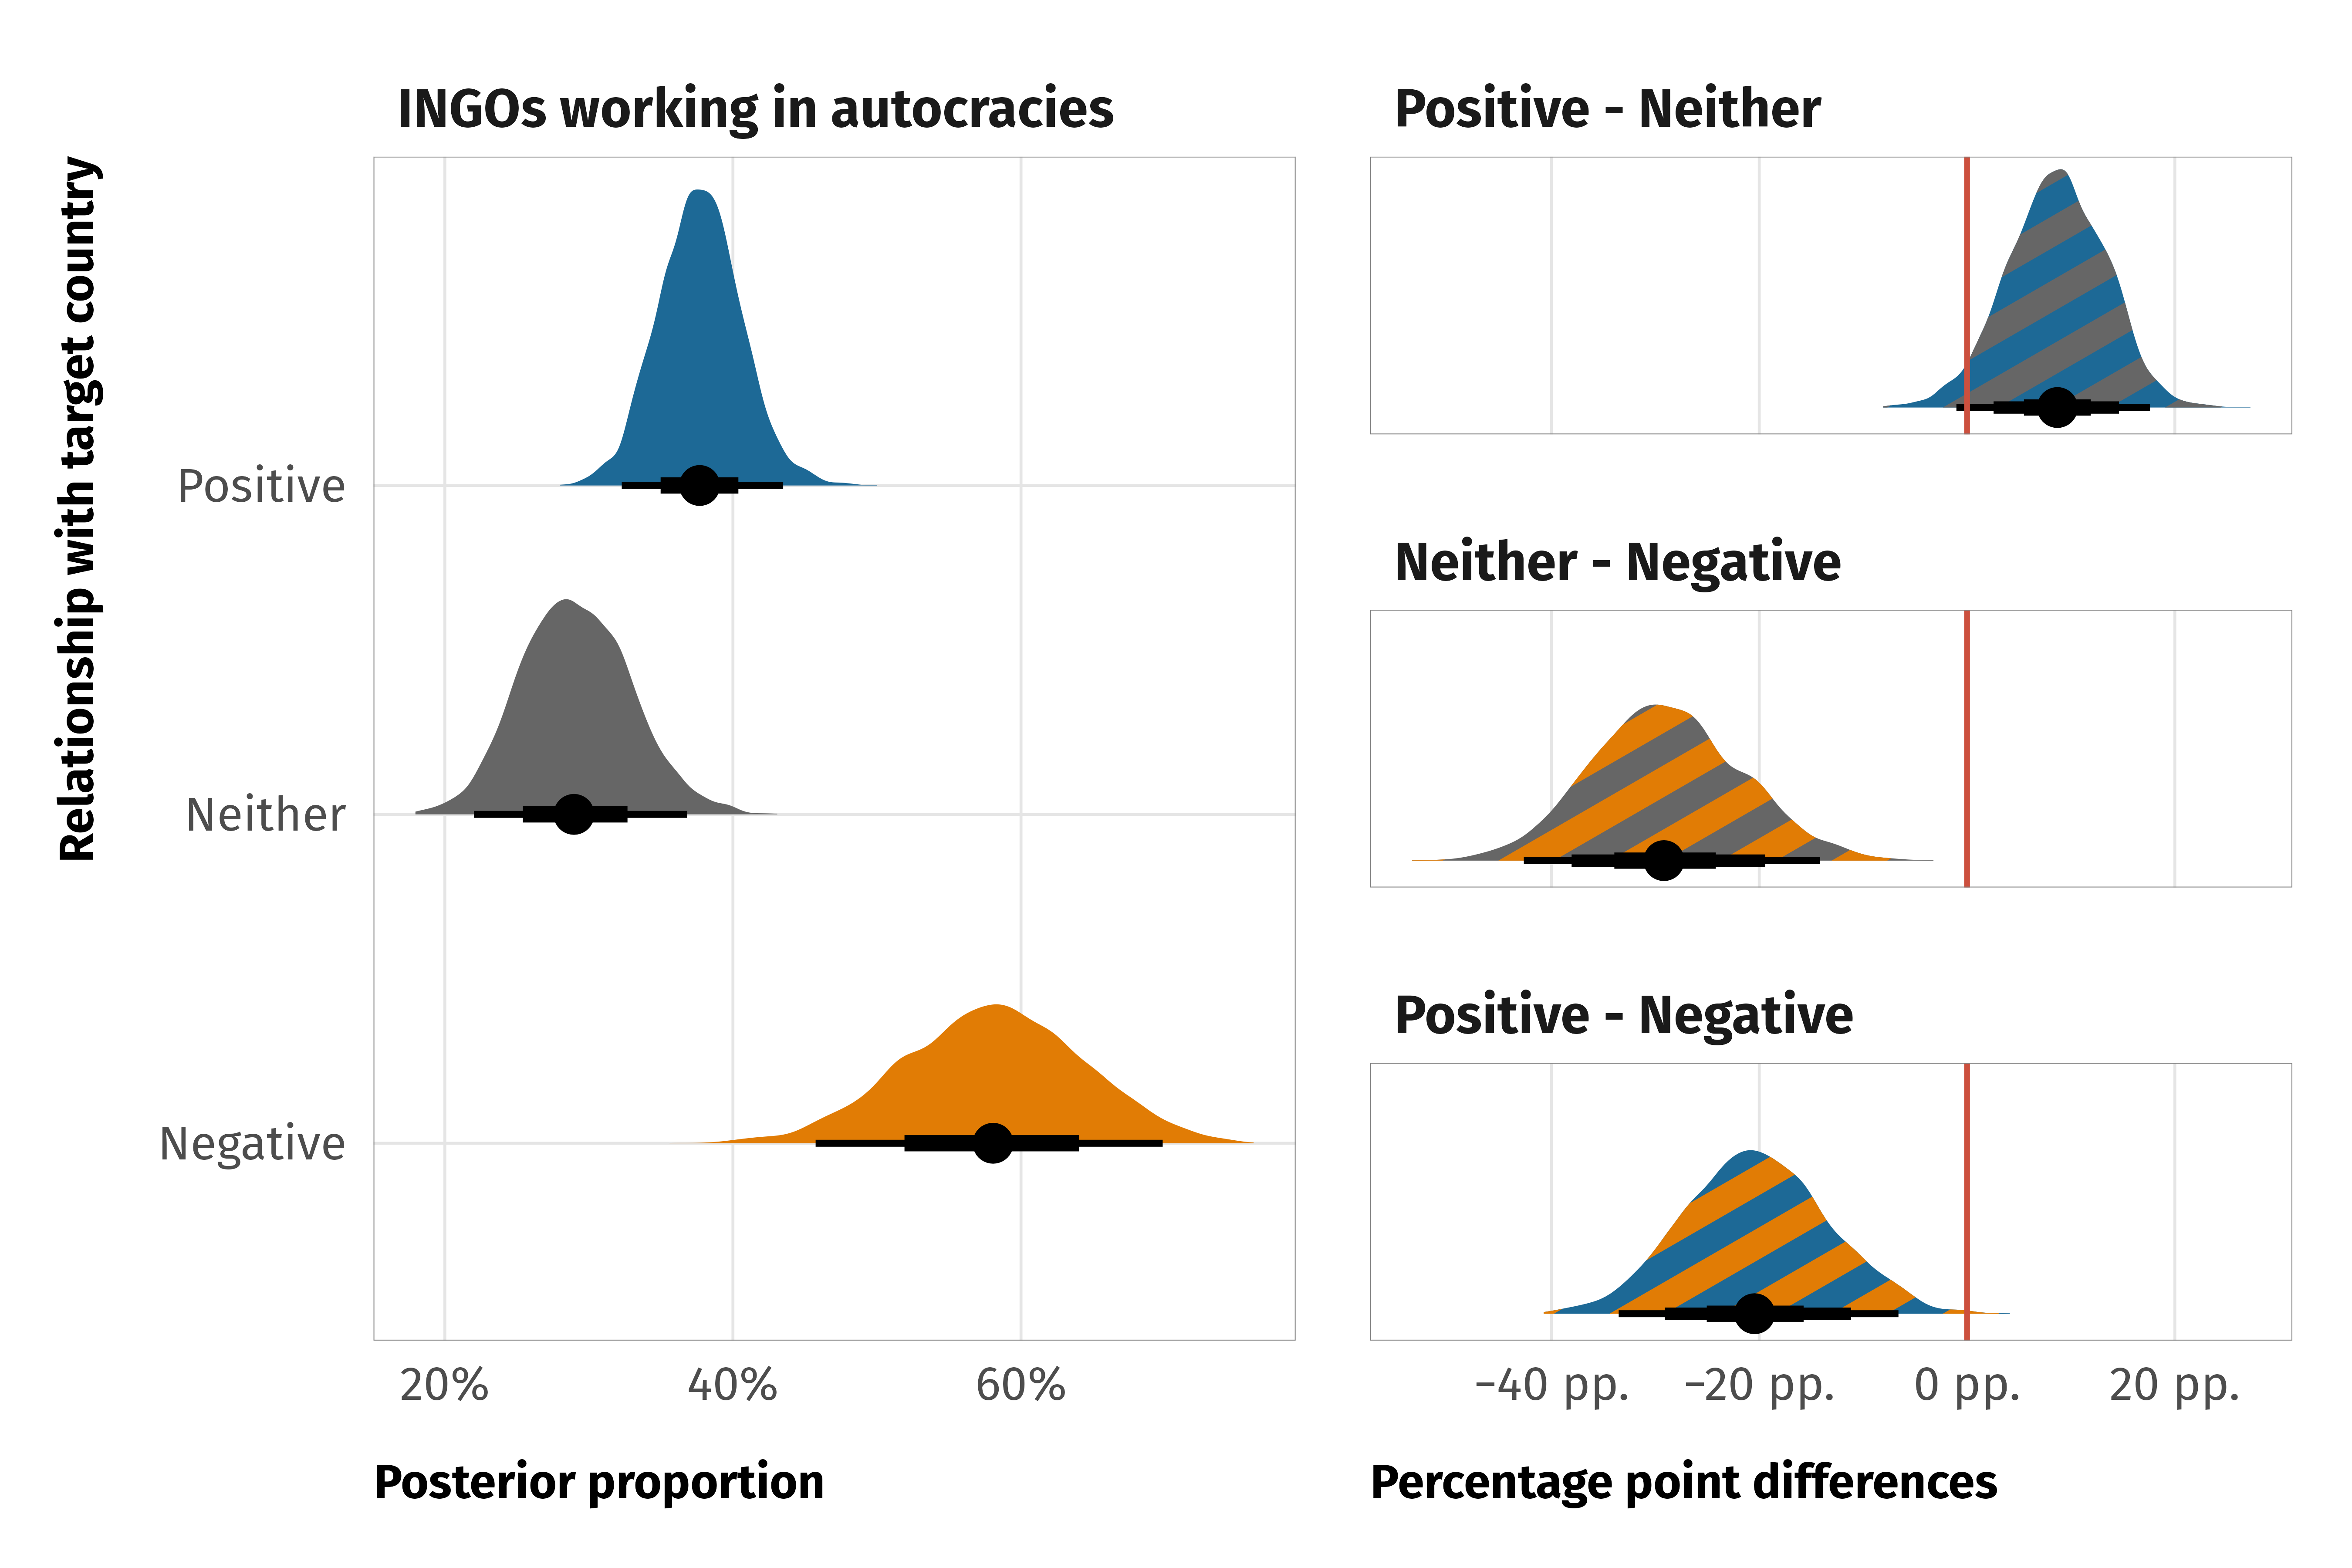
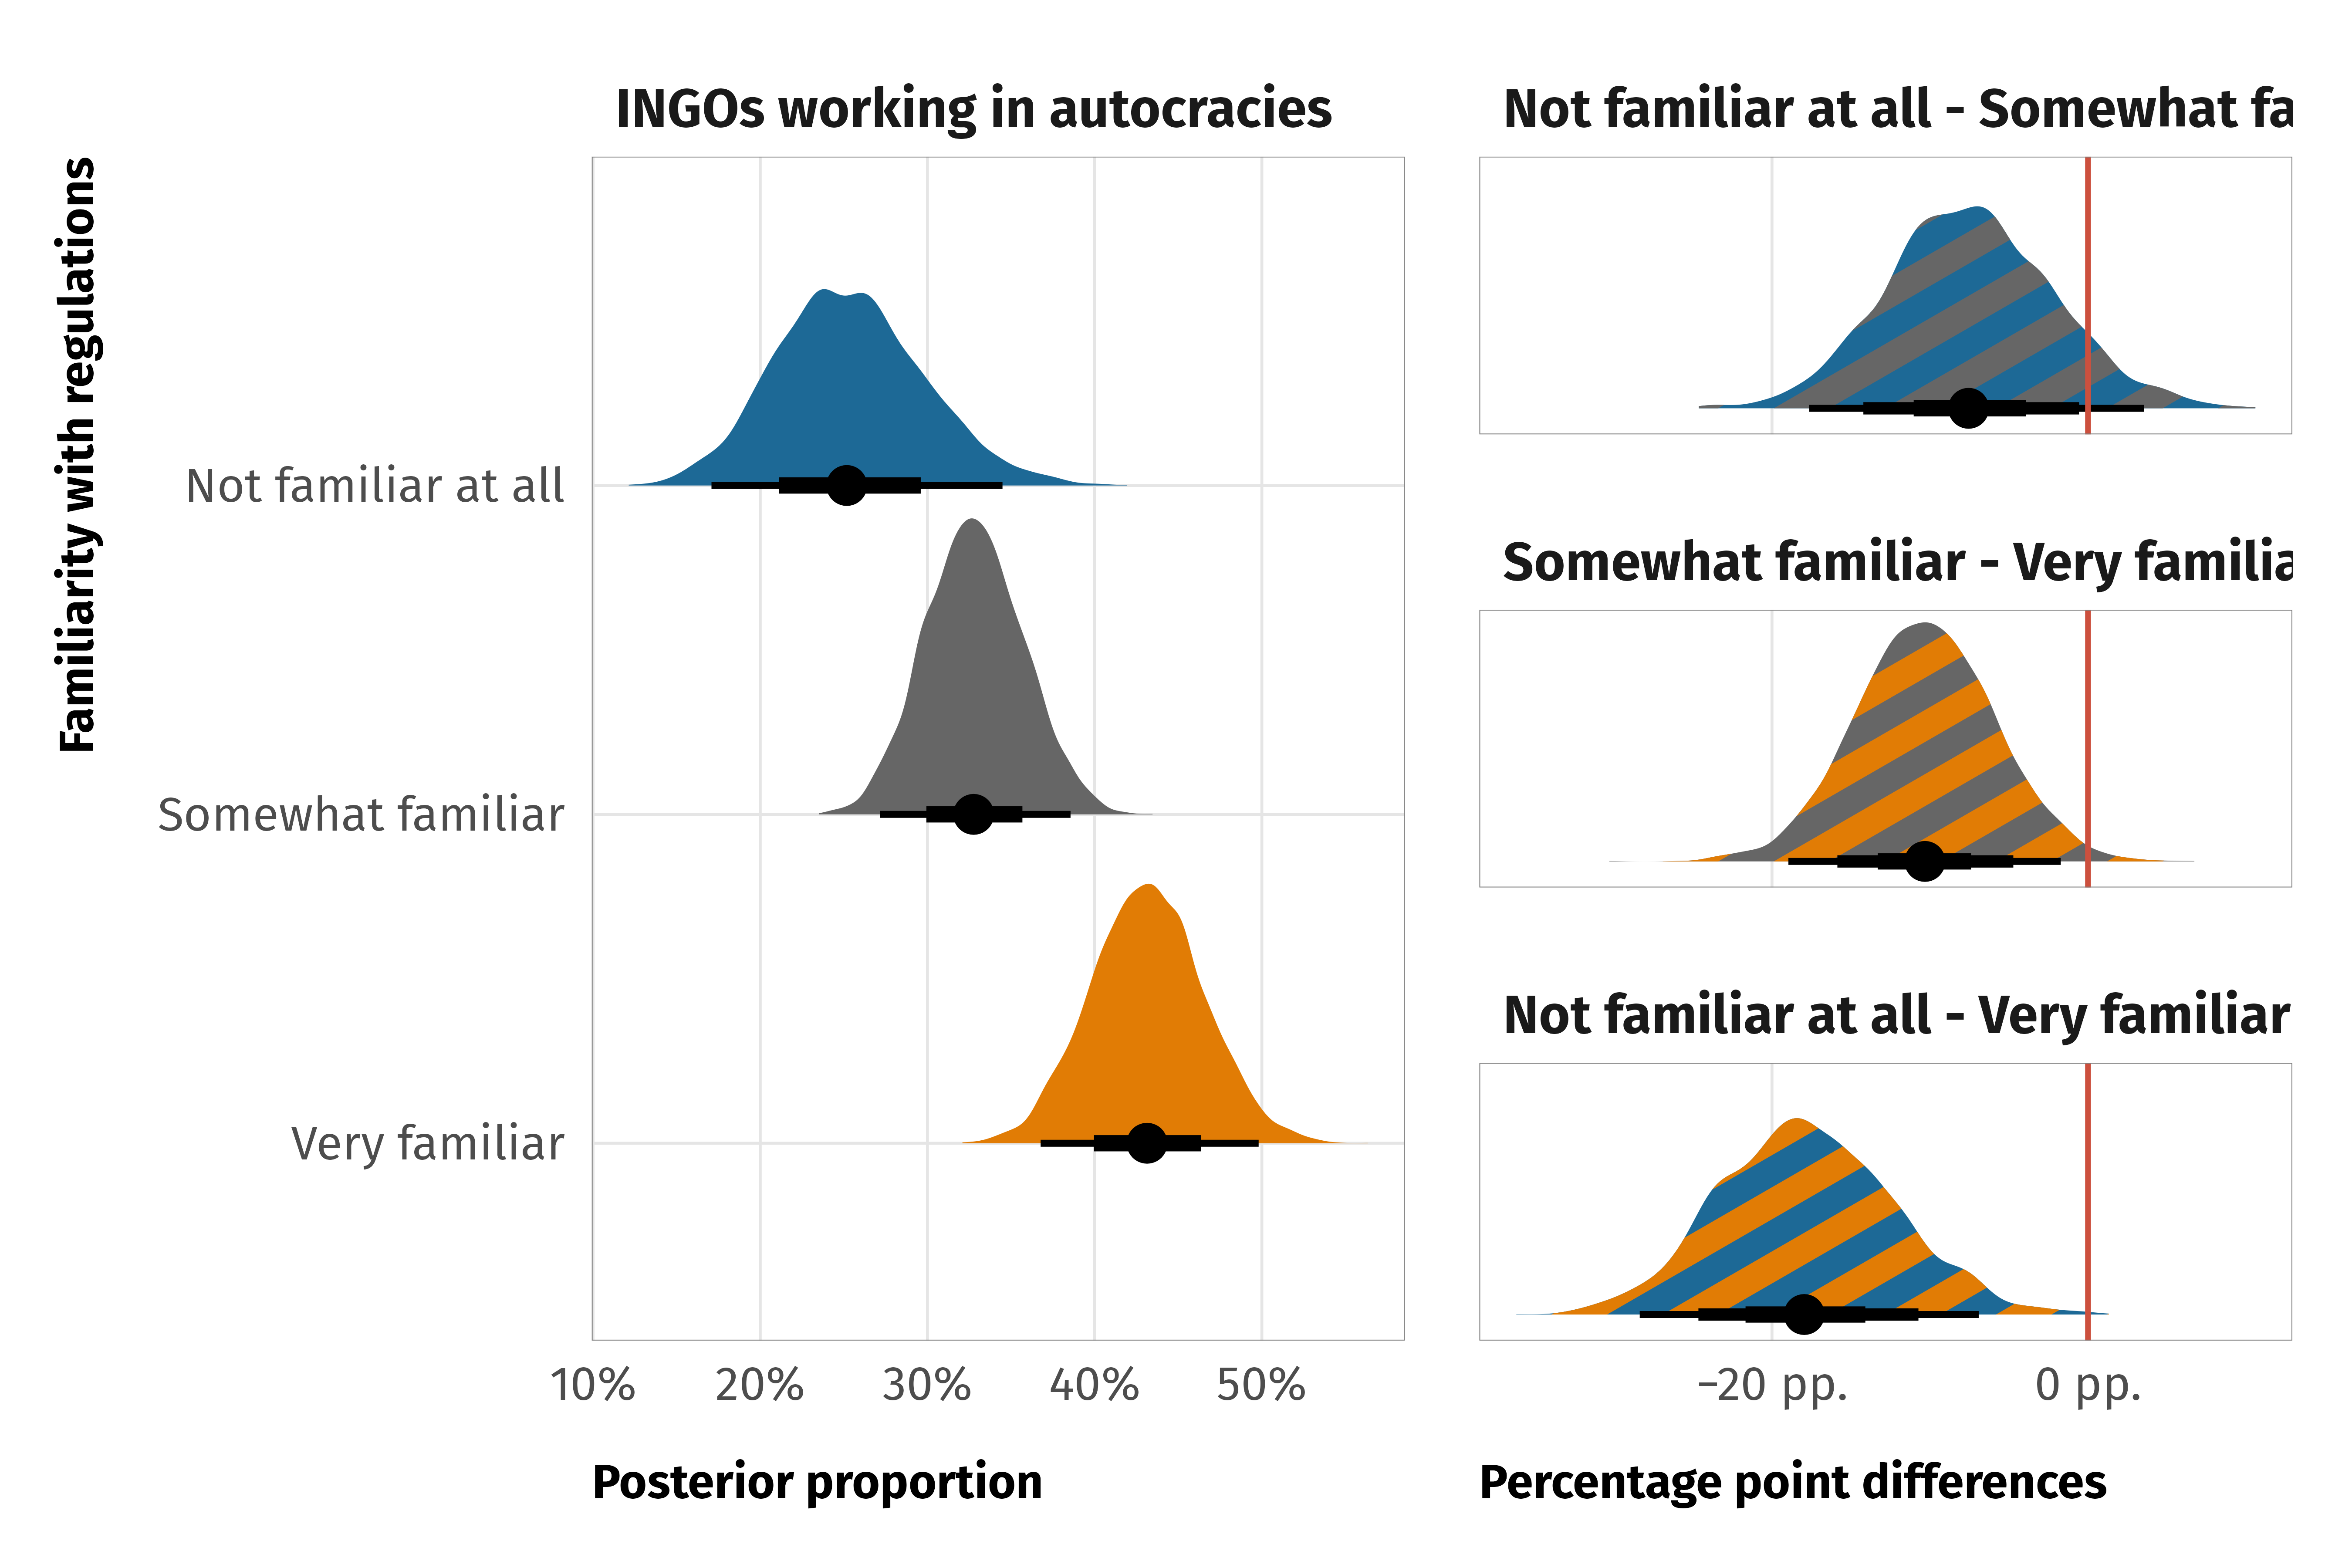
Median proportions for INGOs working in autocracies
Negative
0.58 (0.46 – 0.70)
—
Neither
0.29 (0.22 – 0.37)
—
Positive
0.38 (0.32 – 0.43)
—
Differences
Neither − Negative
-0.29 (-0.43 – -0.14)
0.00
Positive − Negative
-0.20 (-0.34 – -0.07)
0.00
Positive − Neither
0.09 (-0.01 – 0.18)
0.96
95% credible intervals shown in parentheses
Issue contentiousness
Code
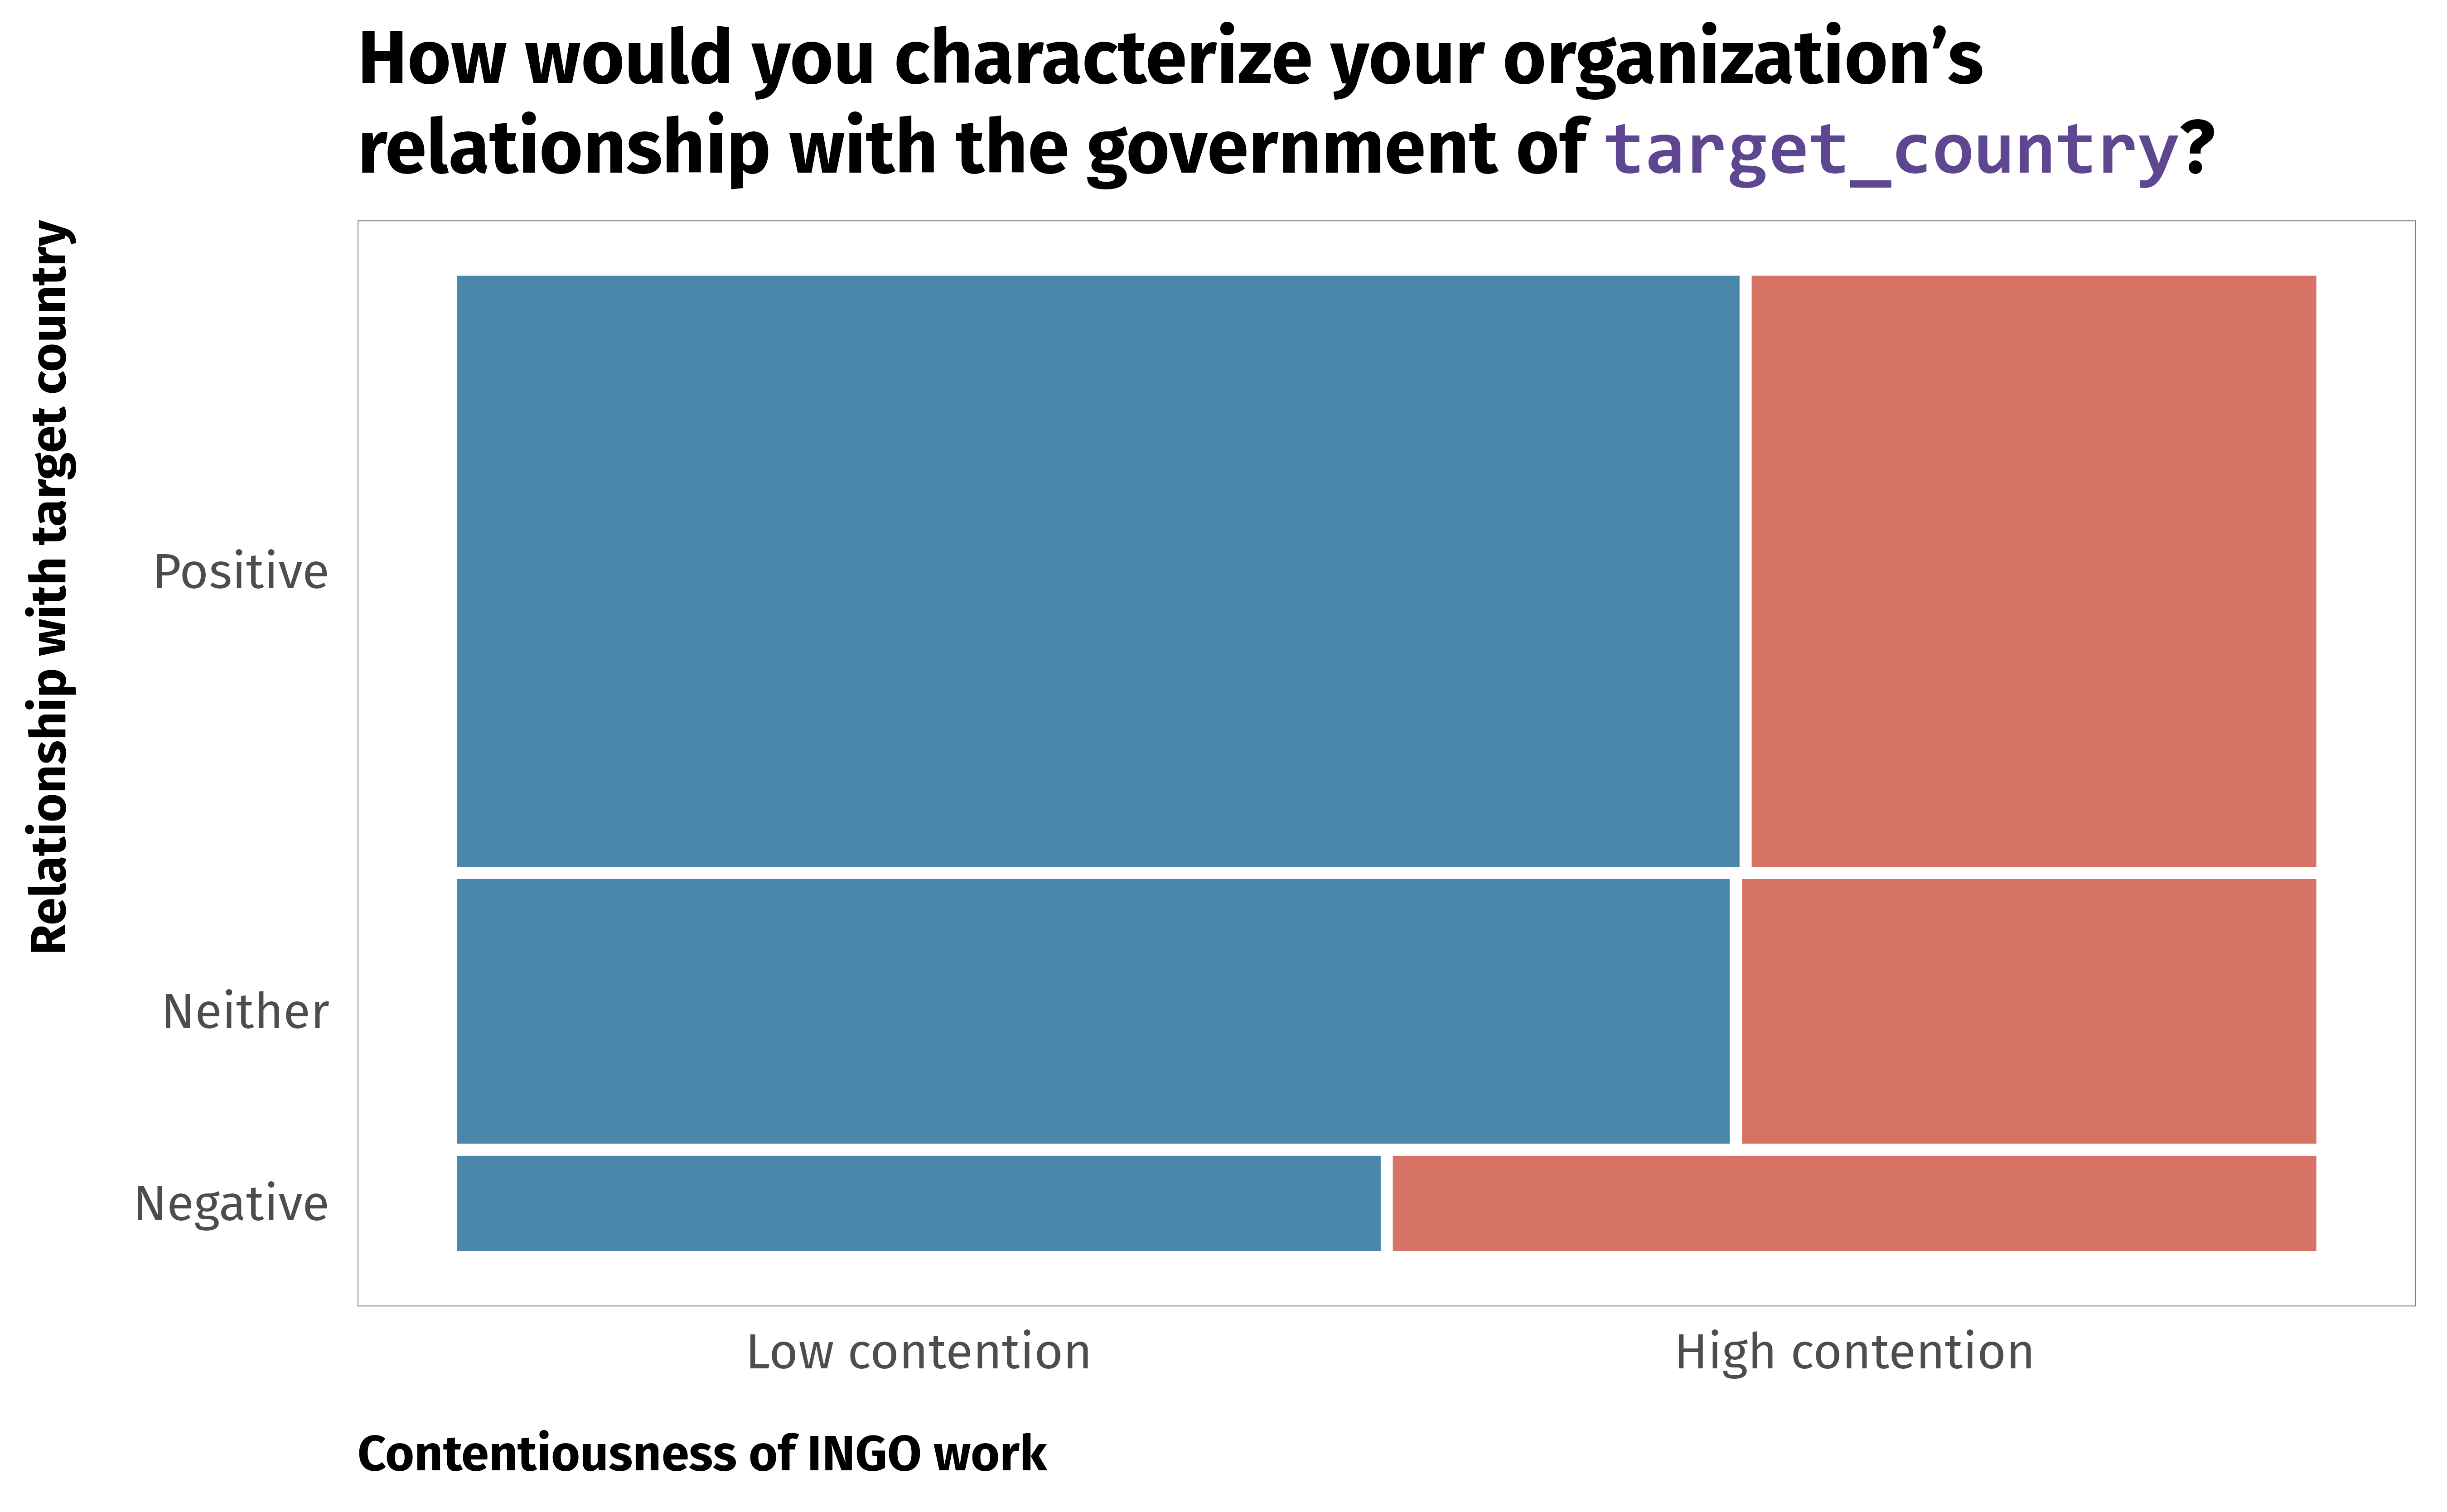
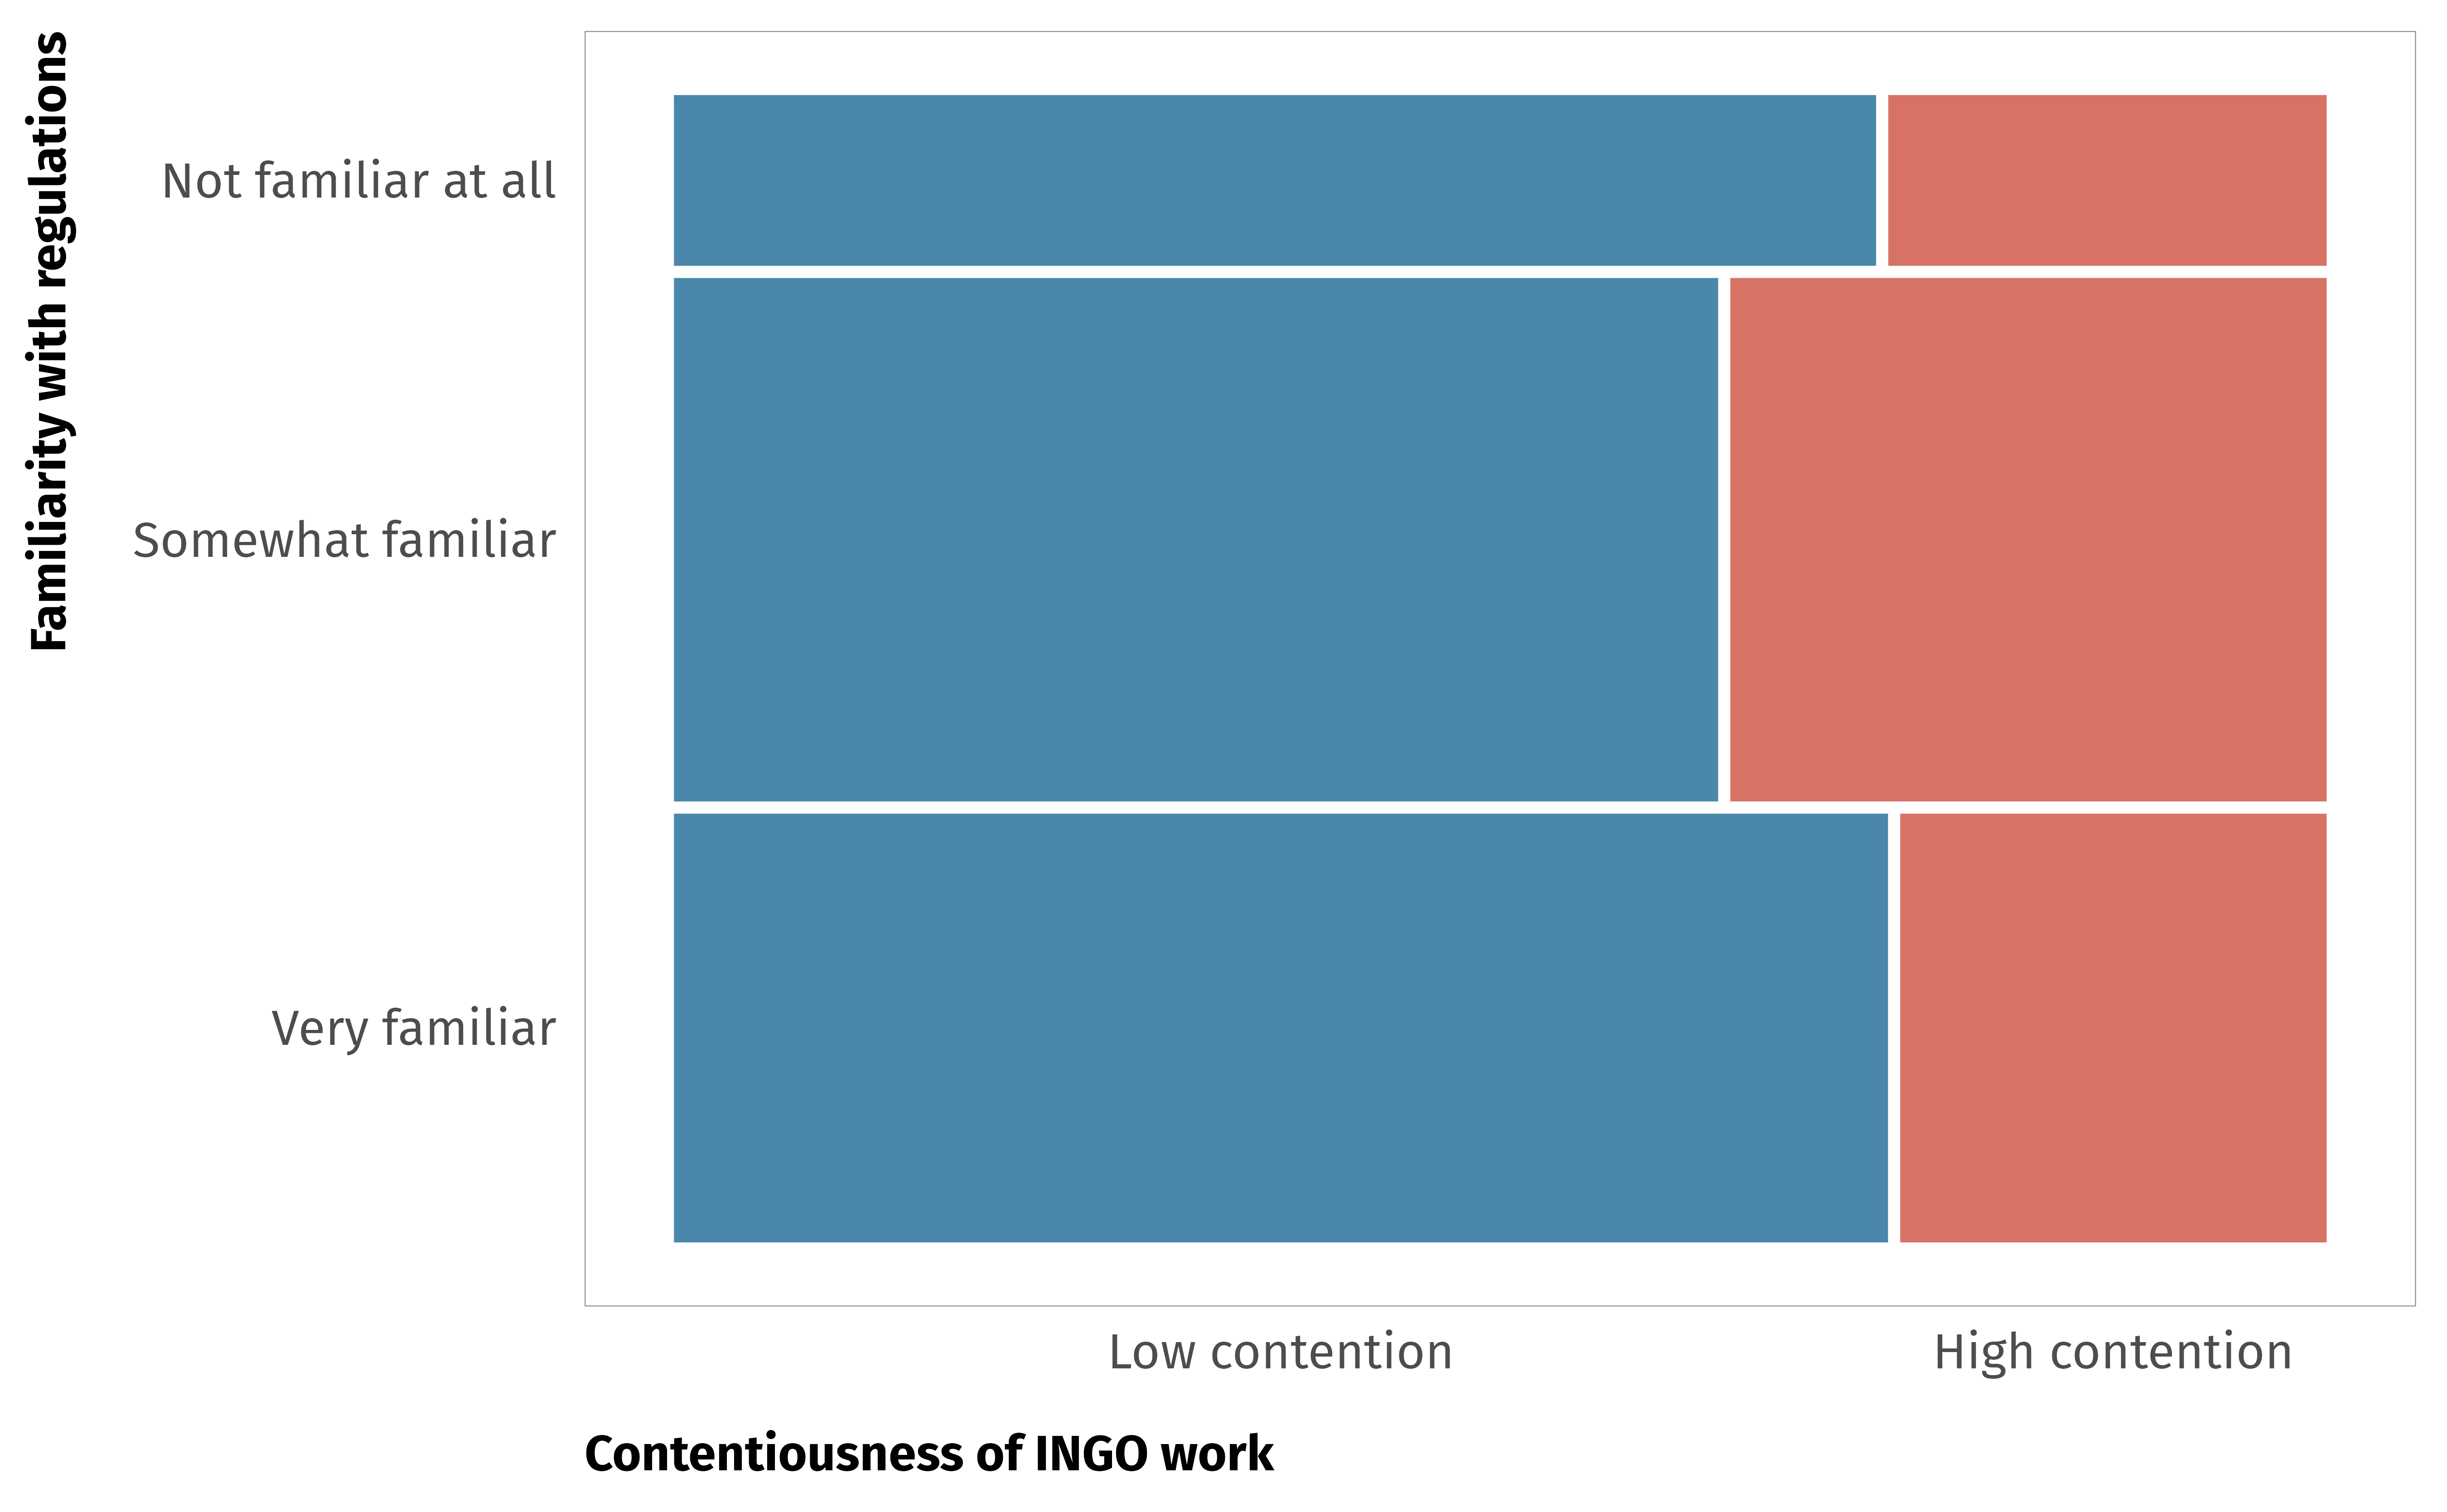
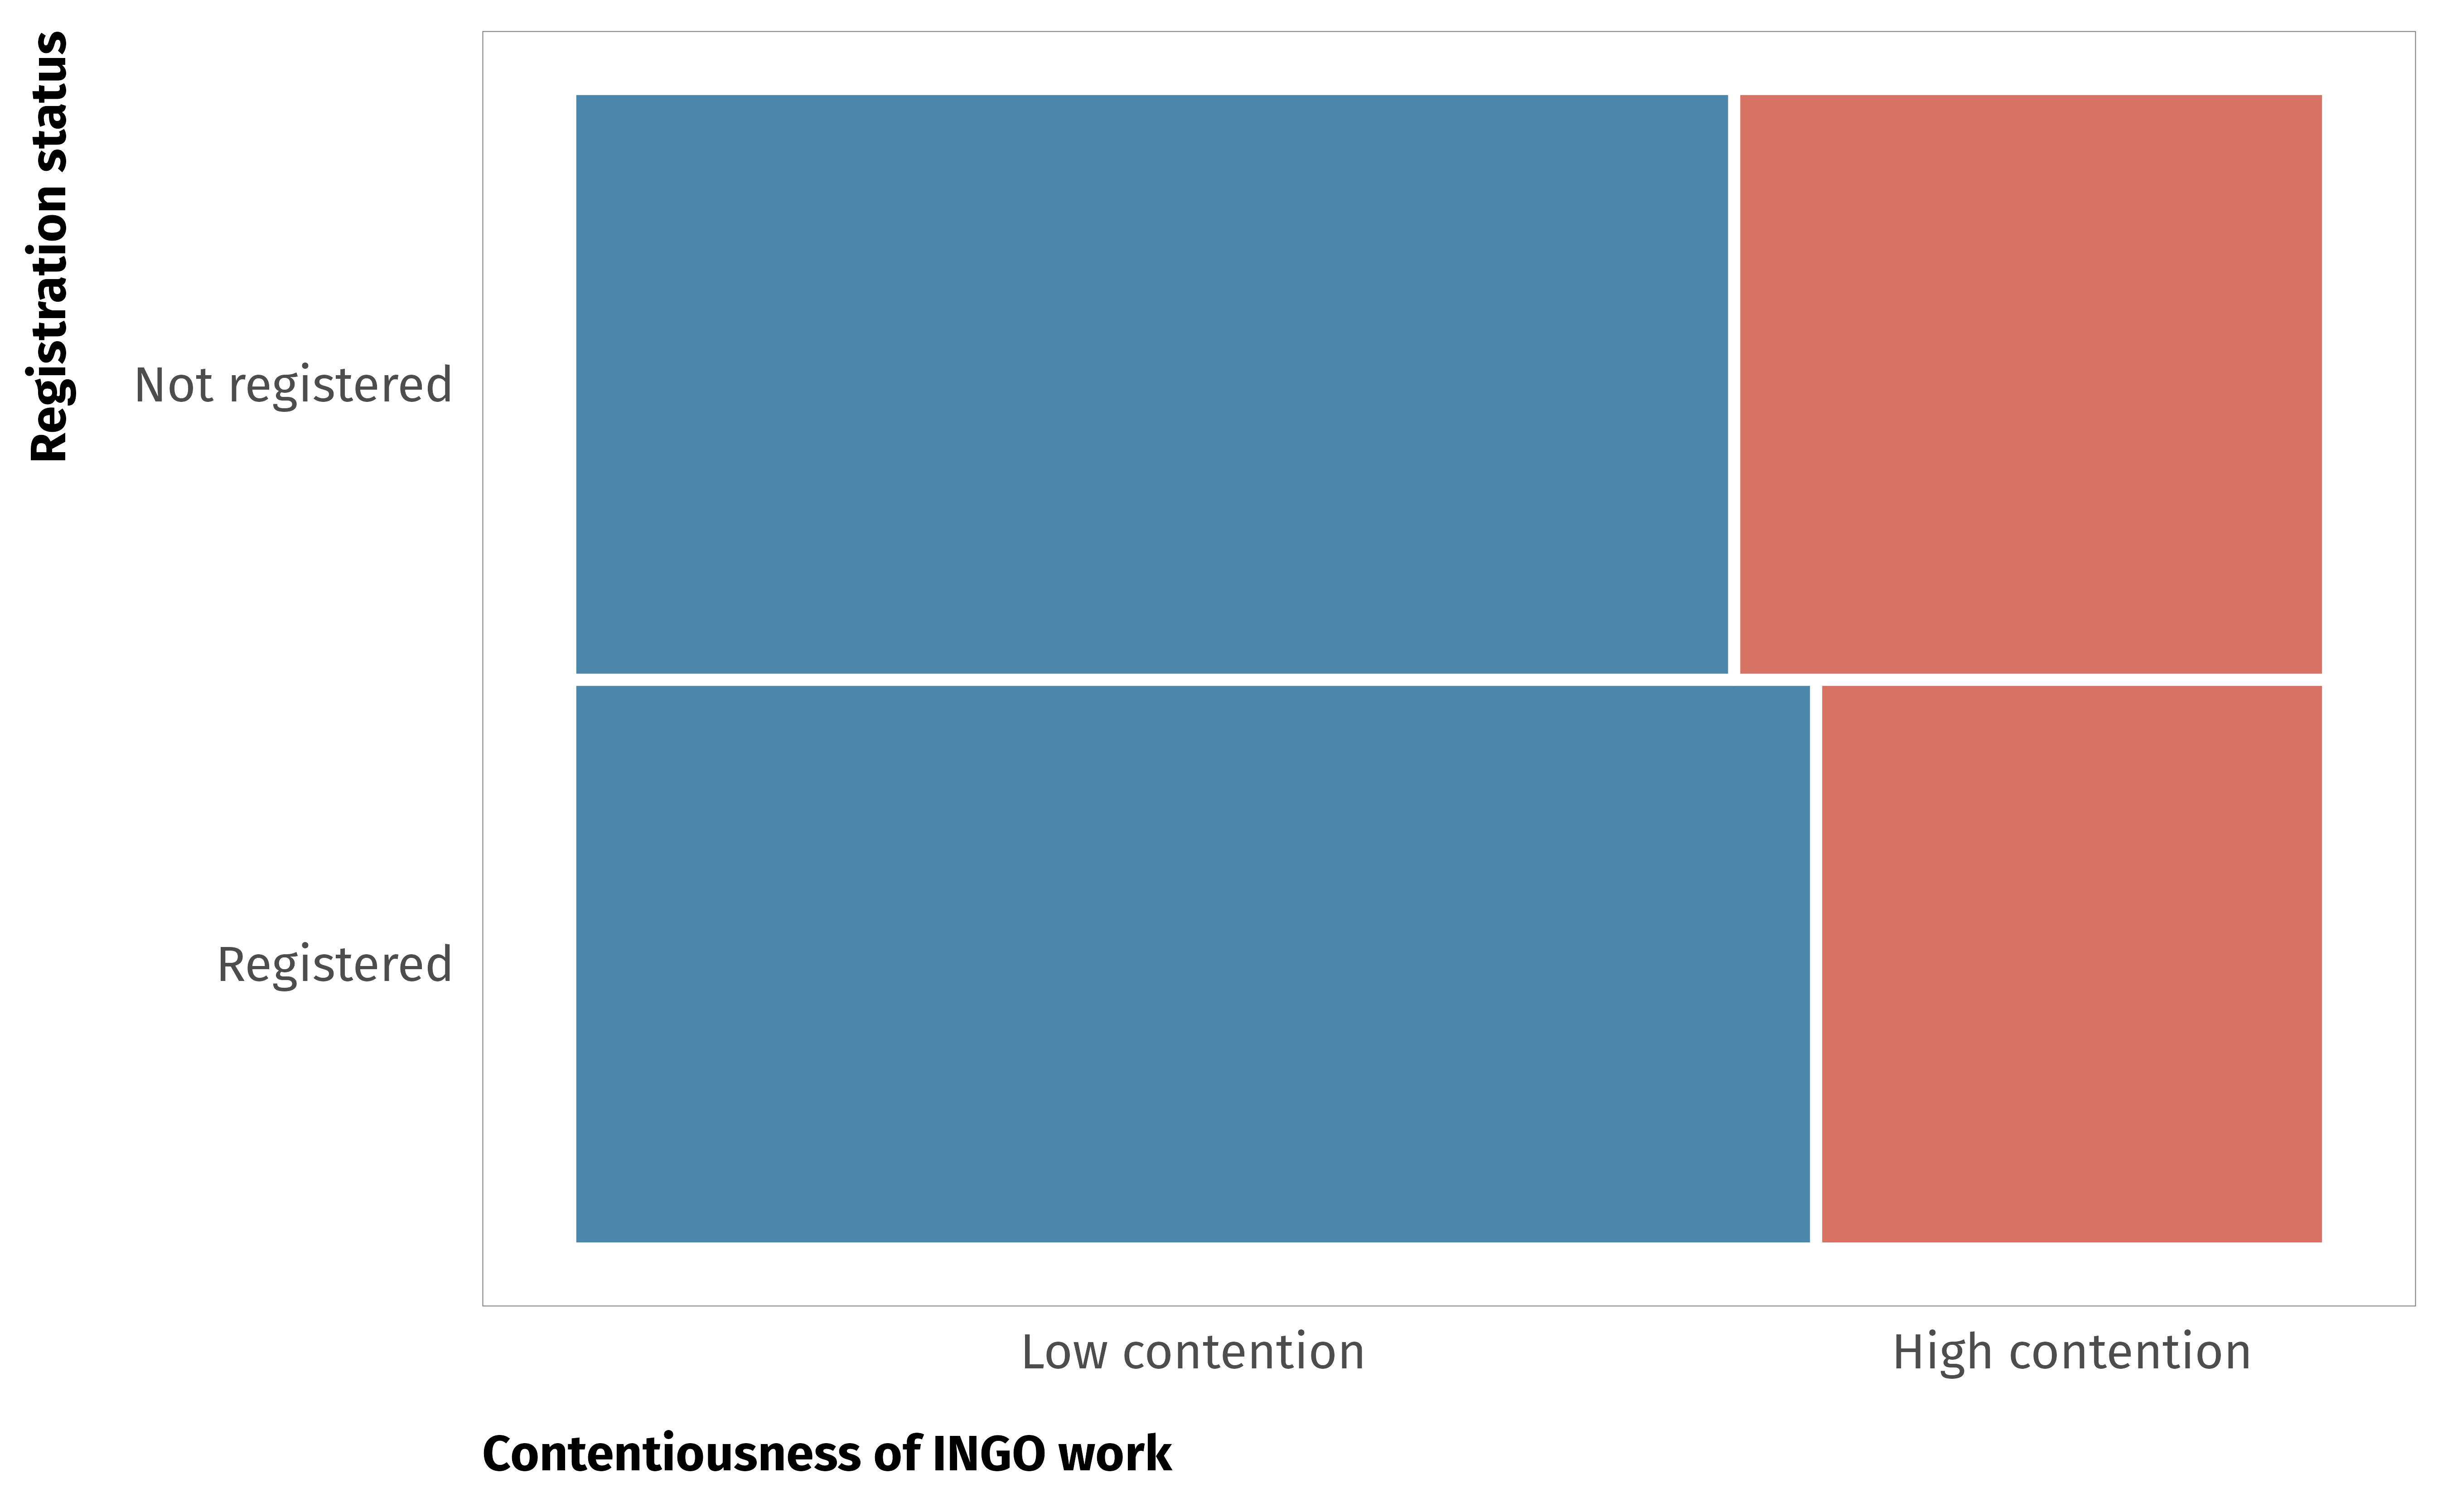
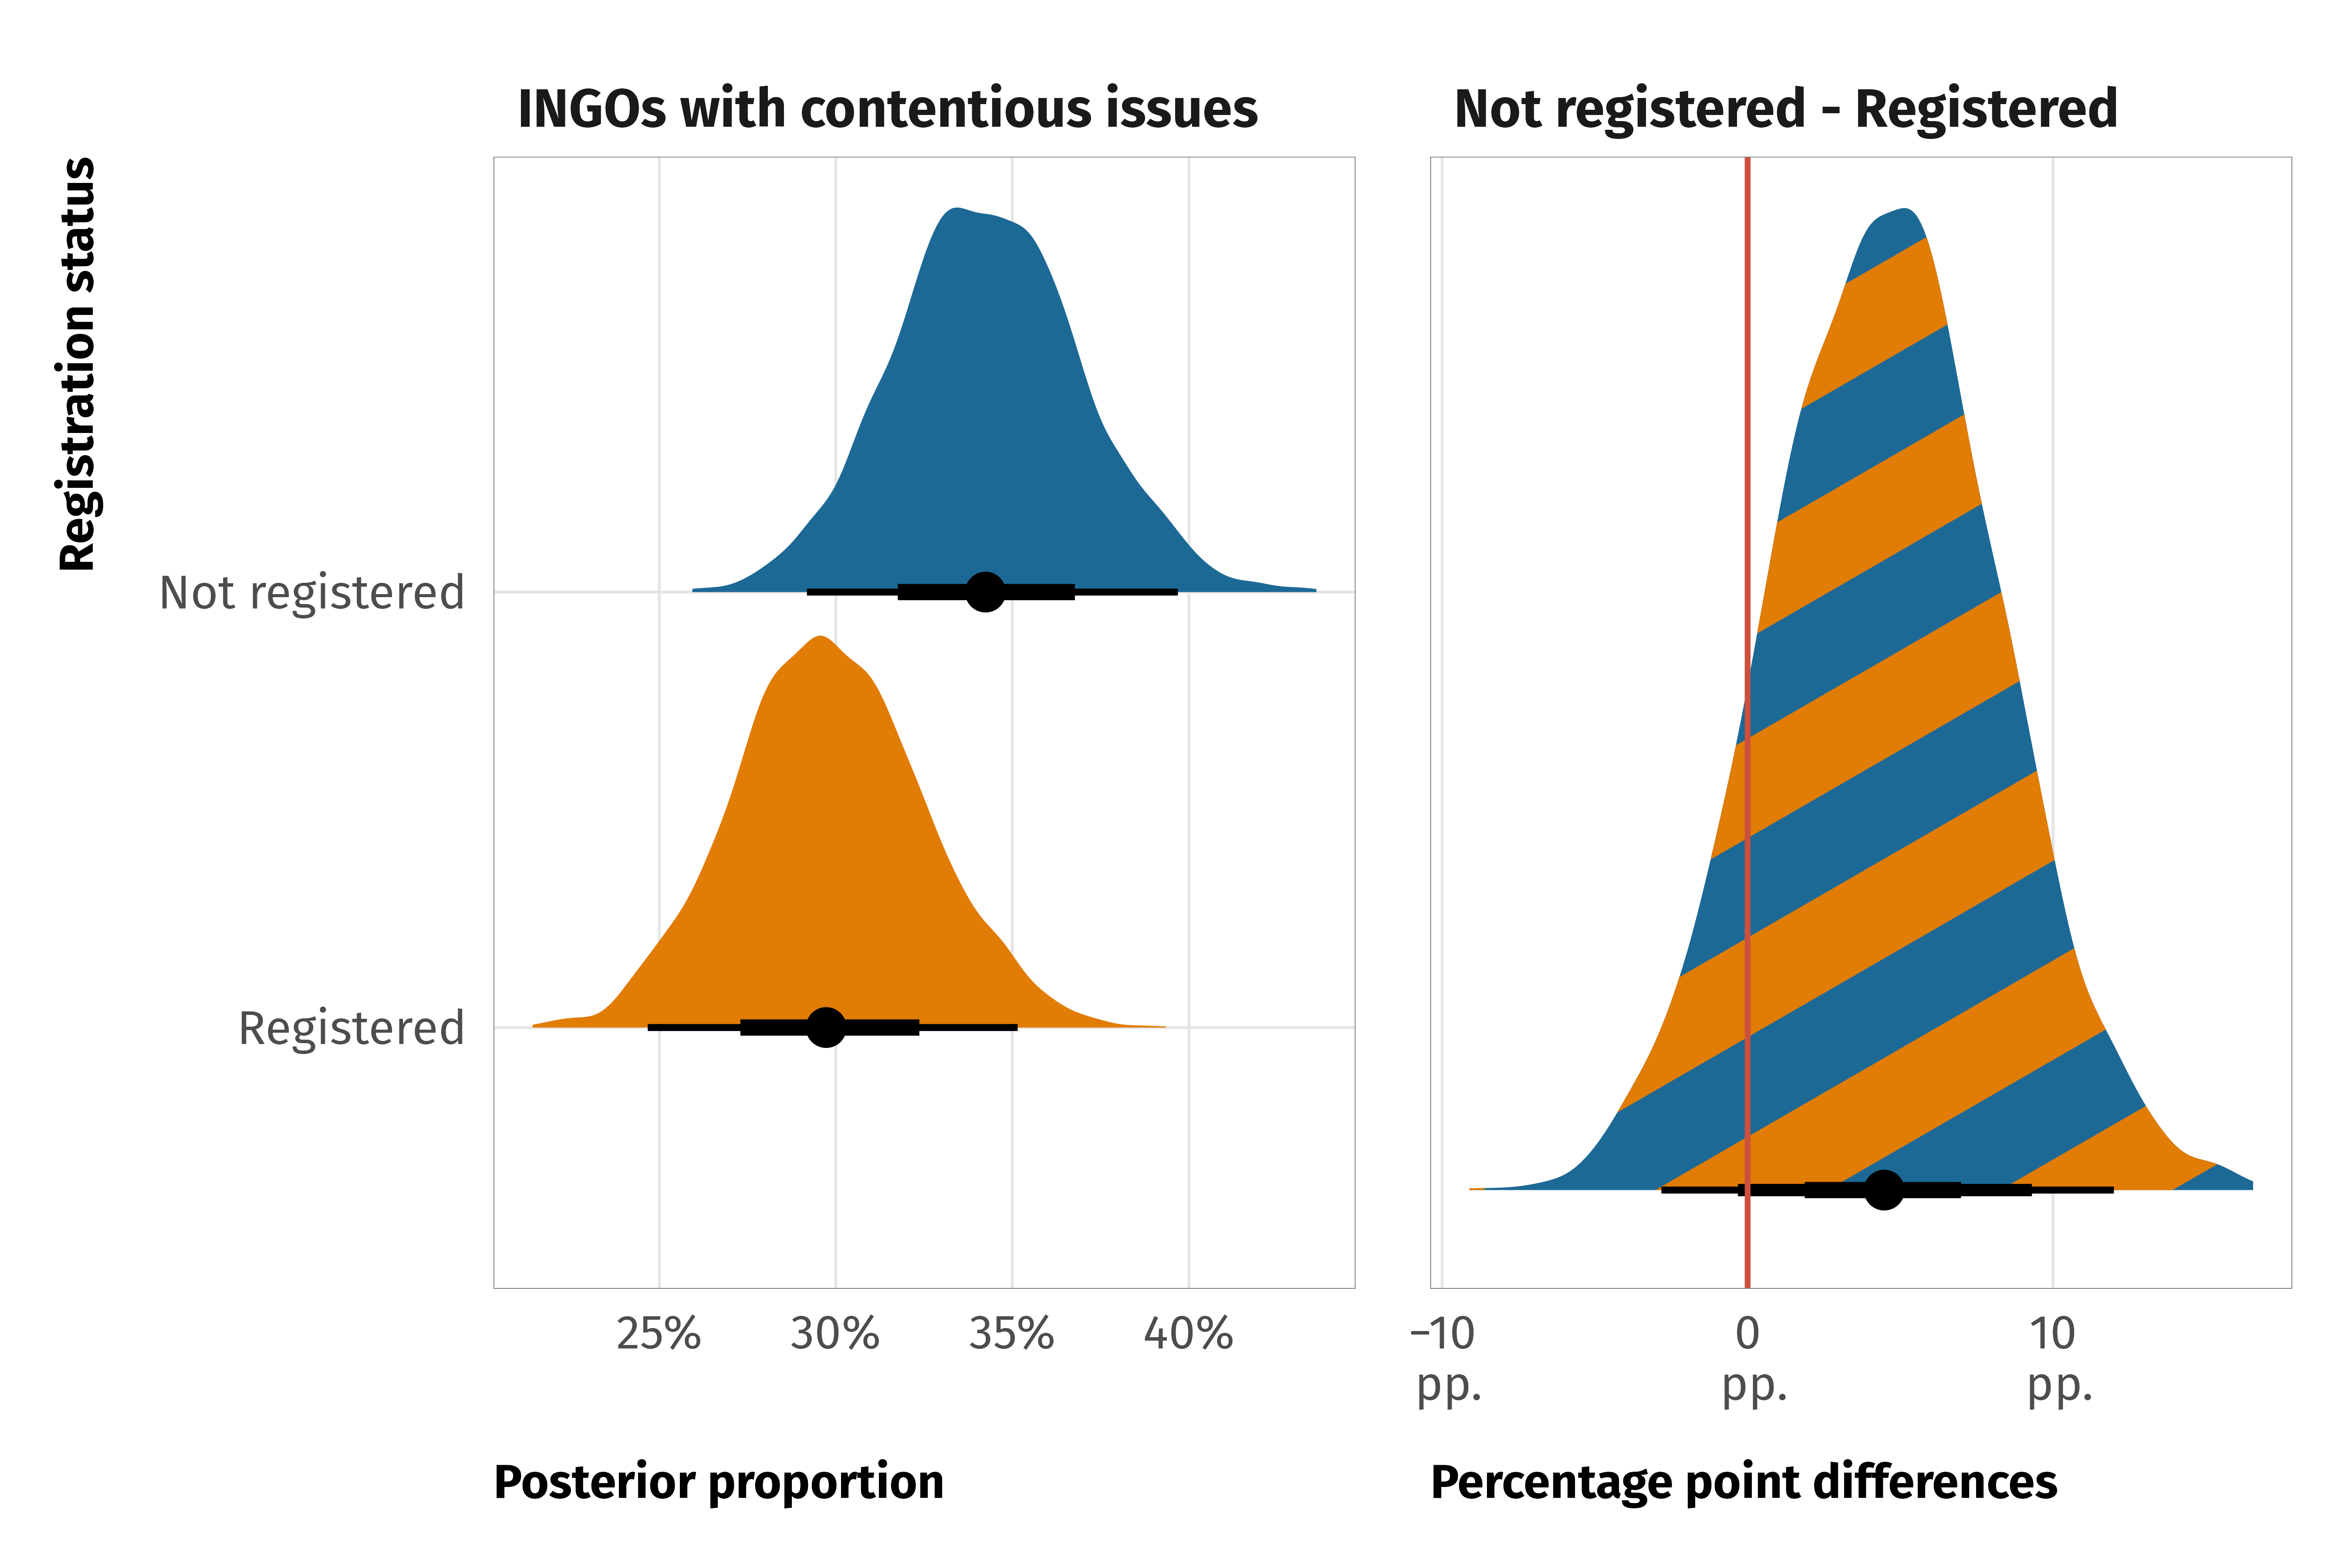
ggplot(data = df_govt_positivity_issue) +geom_mosaic(aes(x =product(potential.contentiousness, Q4.11_collapsed), fill = potential.contentiousness),divider =mosaic("v"), offset =0, color ="white", linewidth =1) +scale_fill_manual(values =c(clrs$Prism[2], clrs$Prism[8]),guide ="none") +labs(x ="Contentiousness of INGO work",y ="Relationship with target country",title =glue("How would you characterize your organization’s<br>","relationship with the government of {country}?",country =build_span("target_country",c("font-family"="Consolas", "color"= clrs$Prism[1])))) +theme_ingo() +theme(panel.grid.major.x =element_blank(),panel.grid.major.y =element_blank(),plot.title =element_markdown(lineheight =1.2))
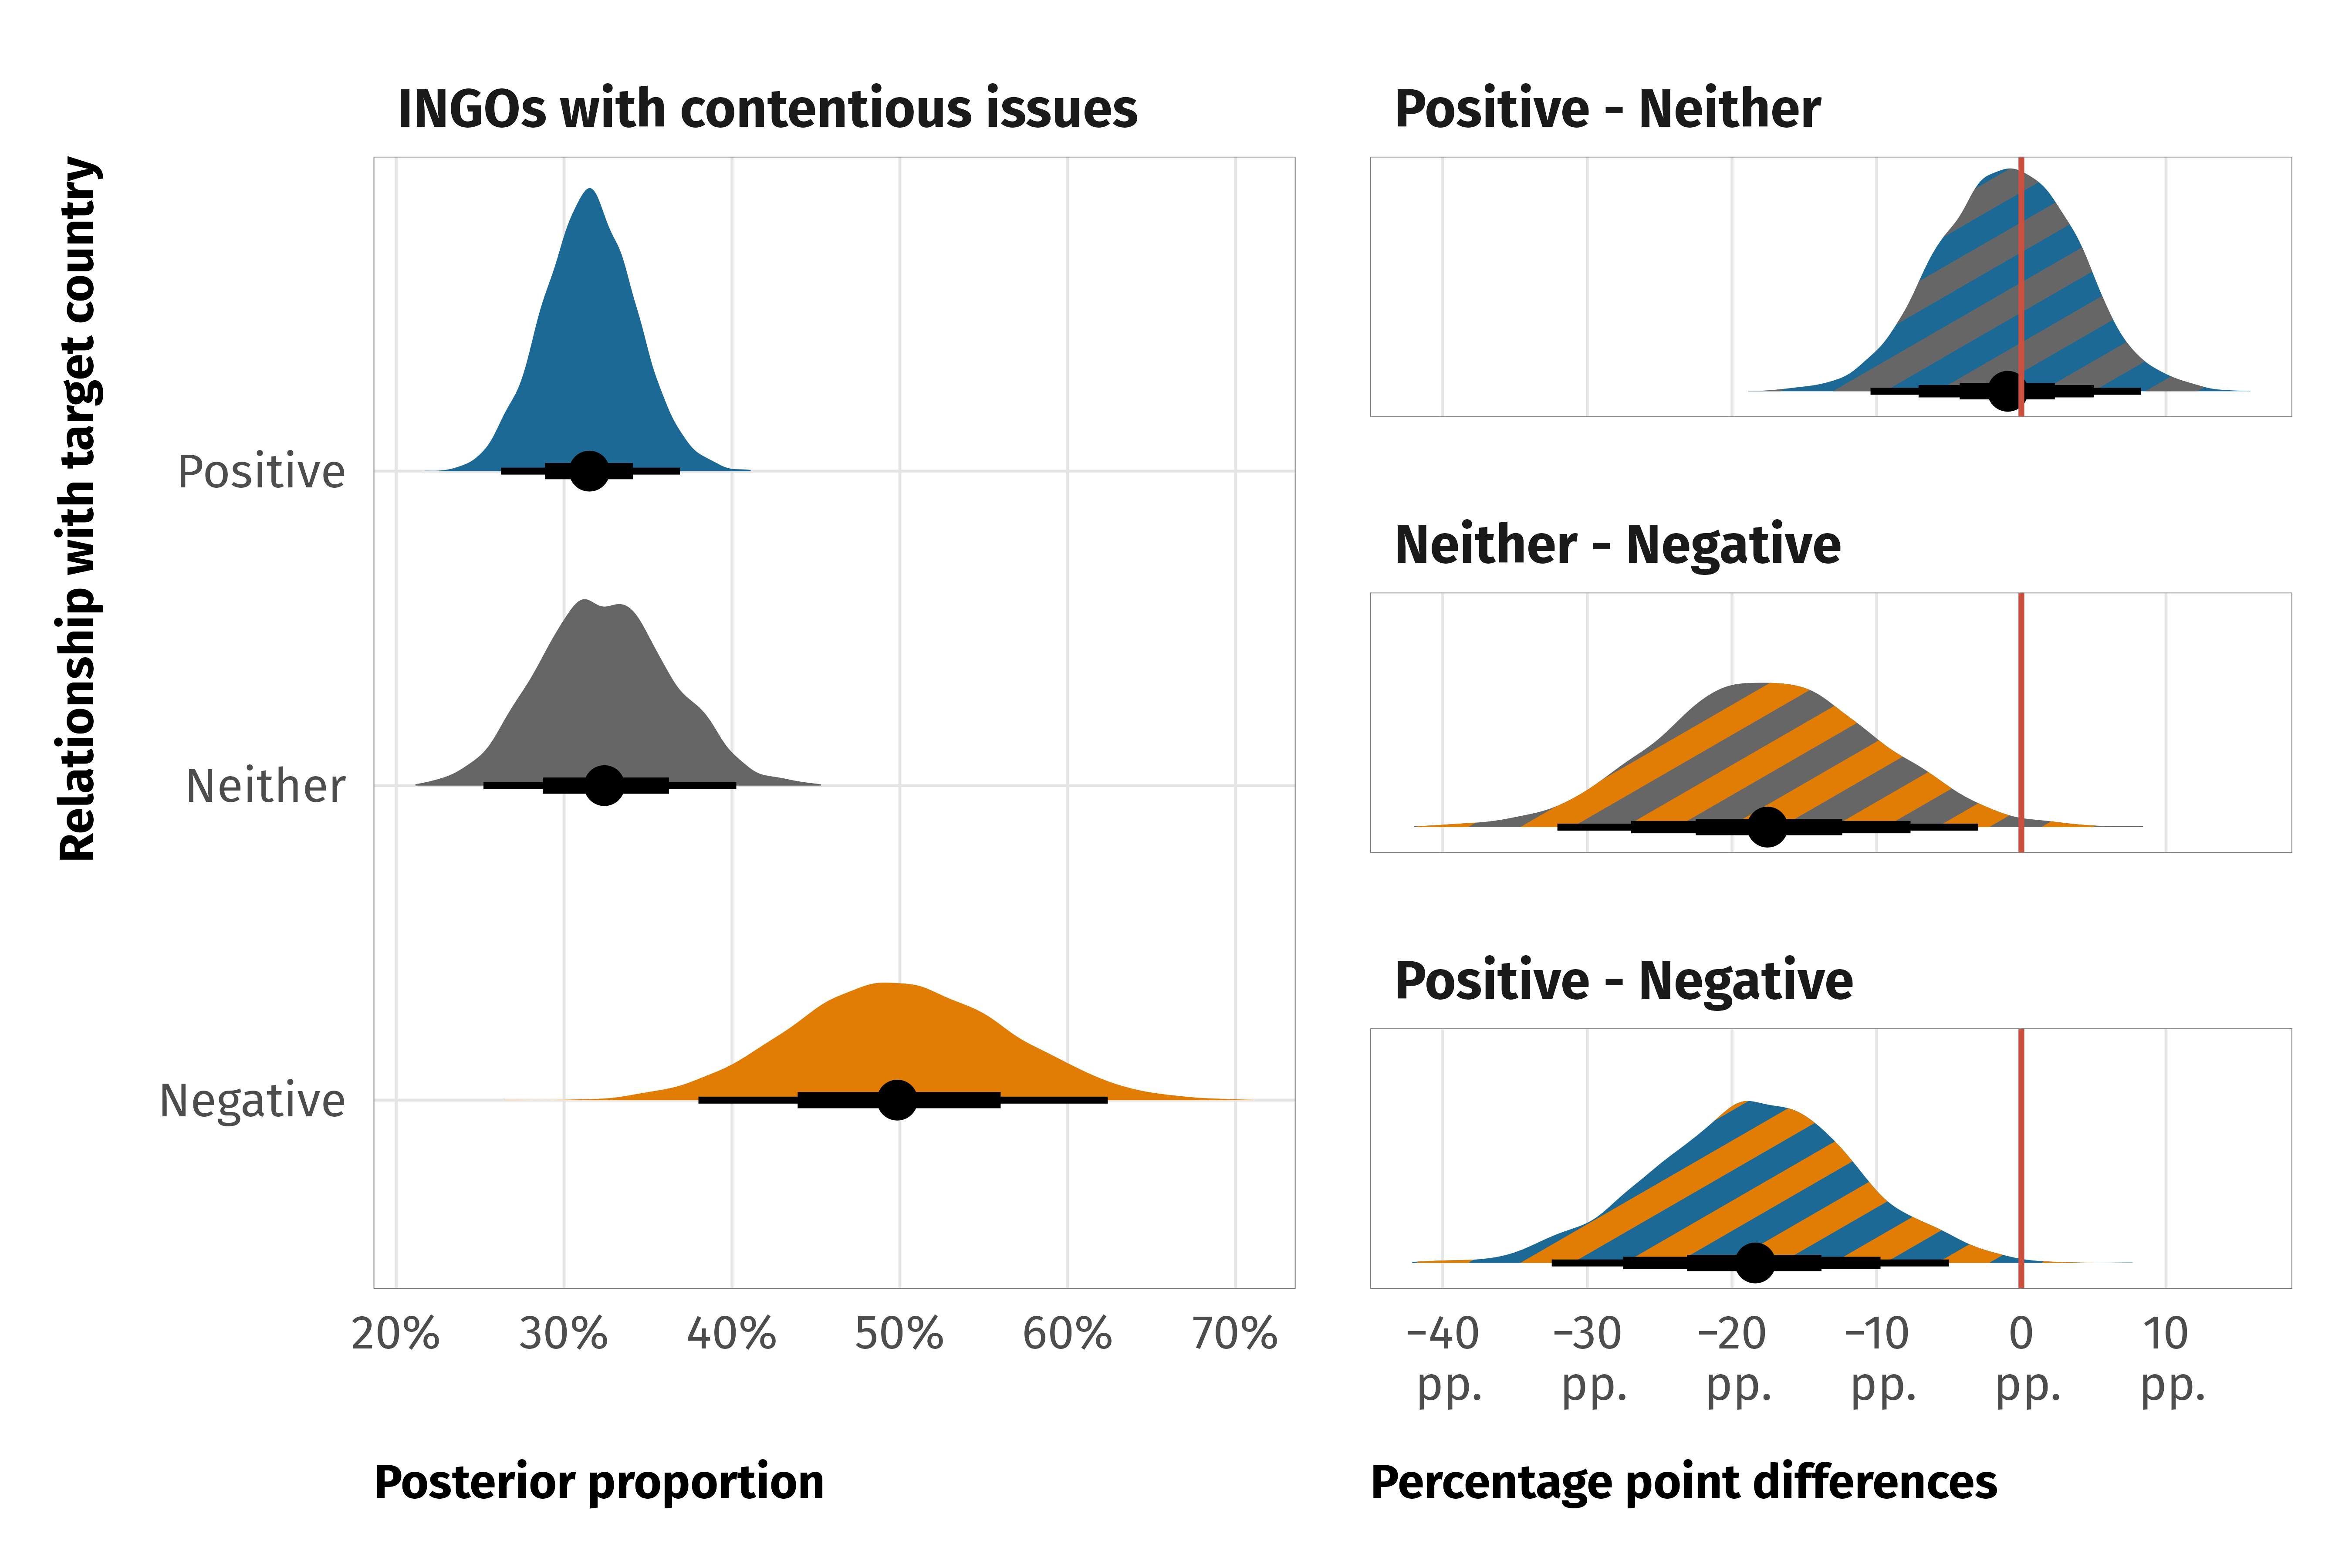
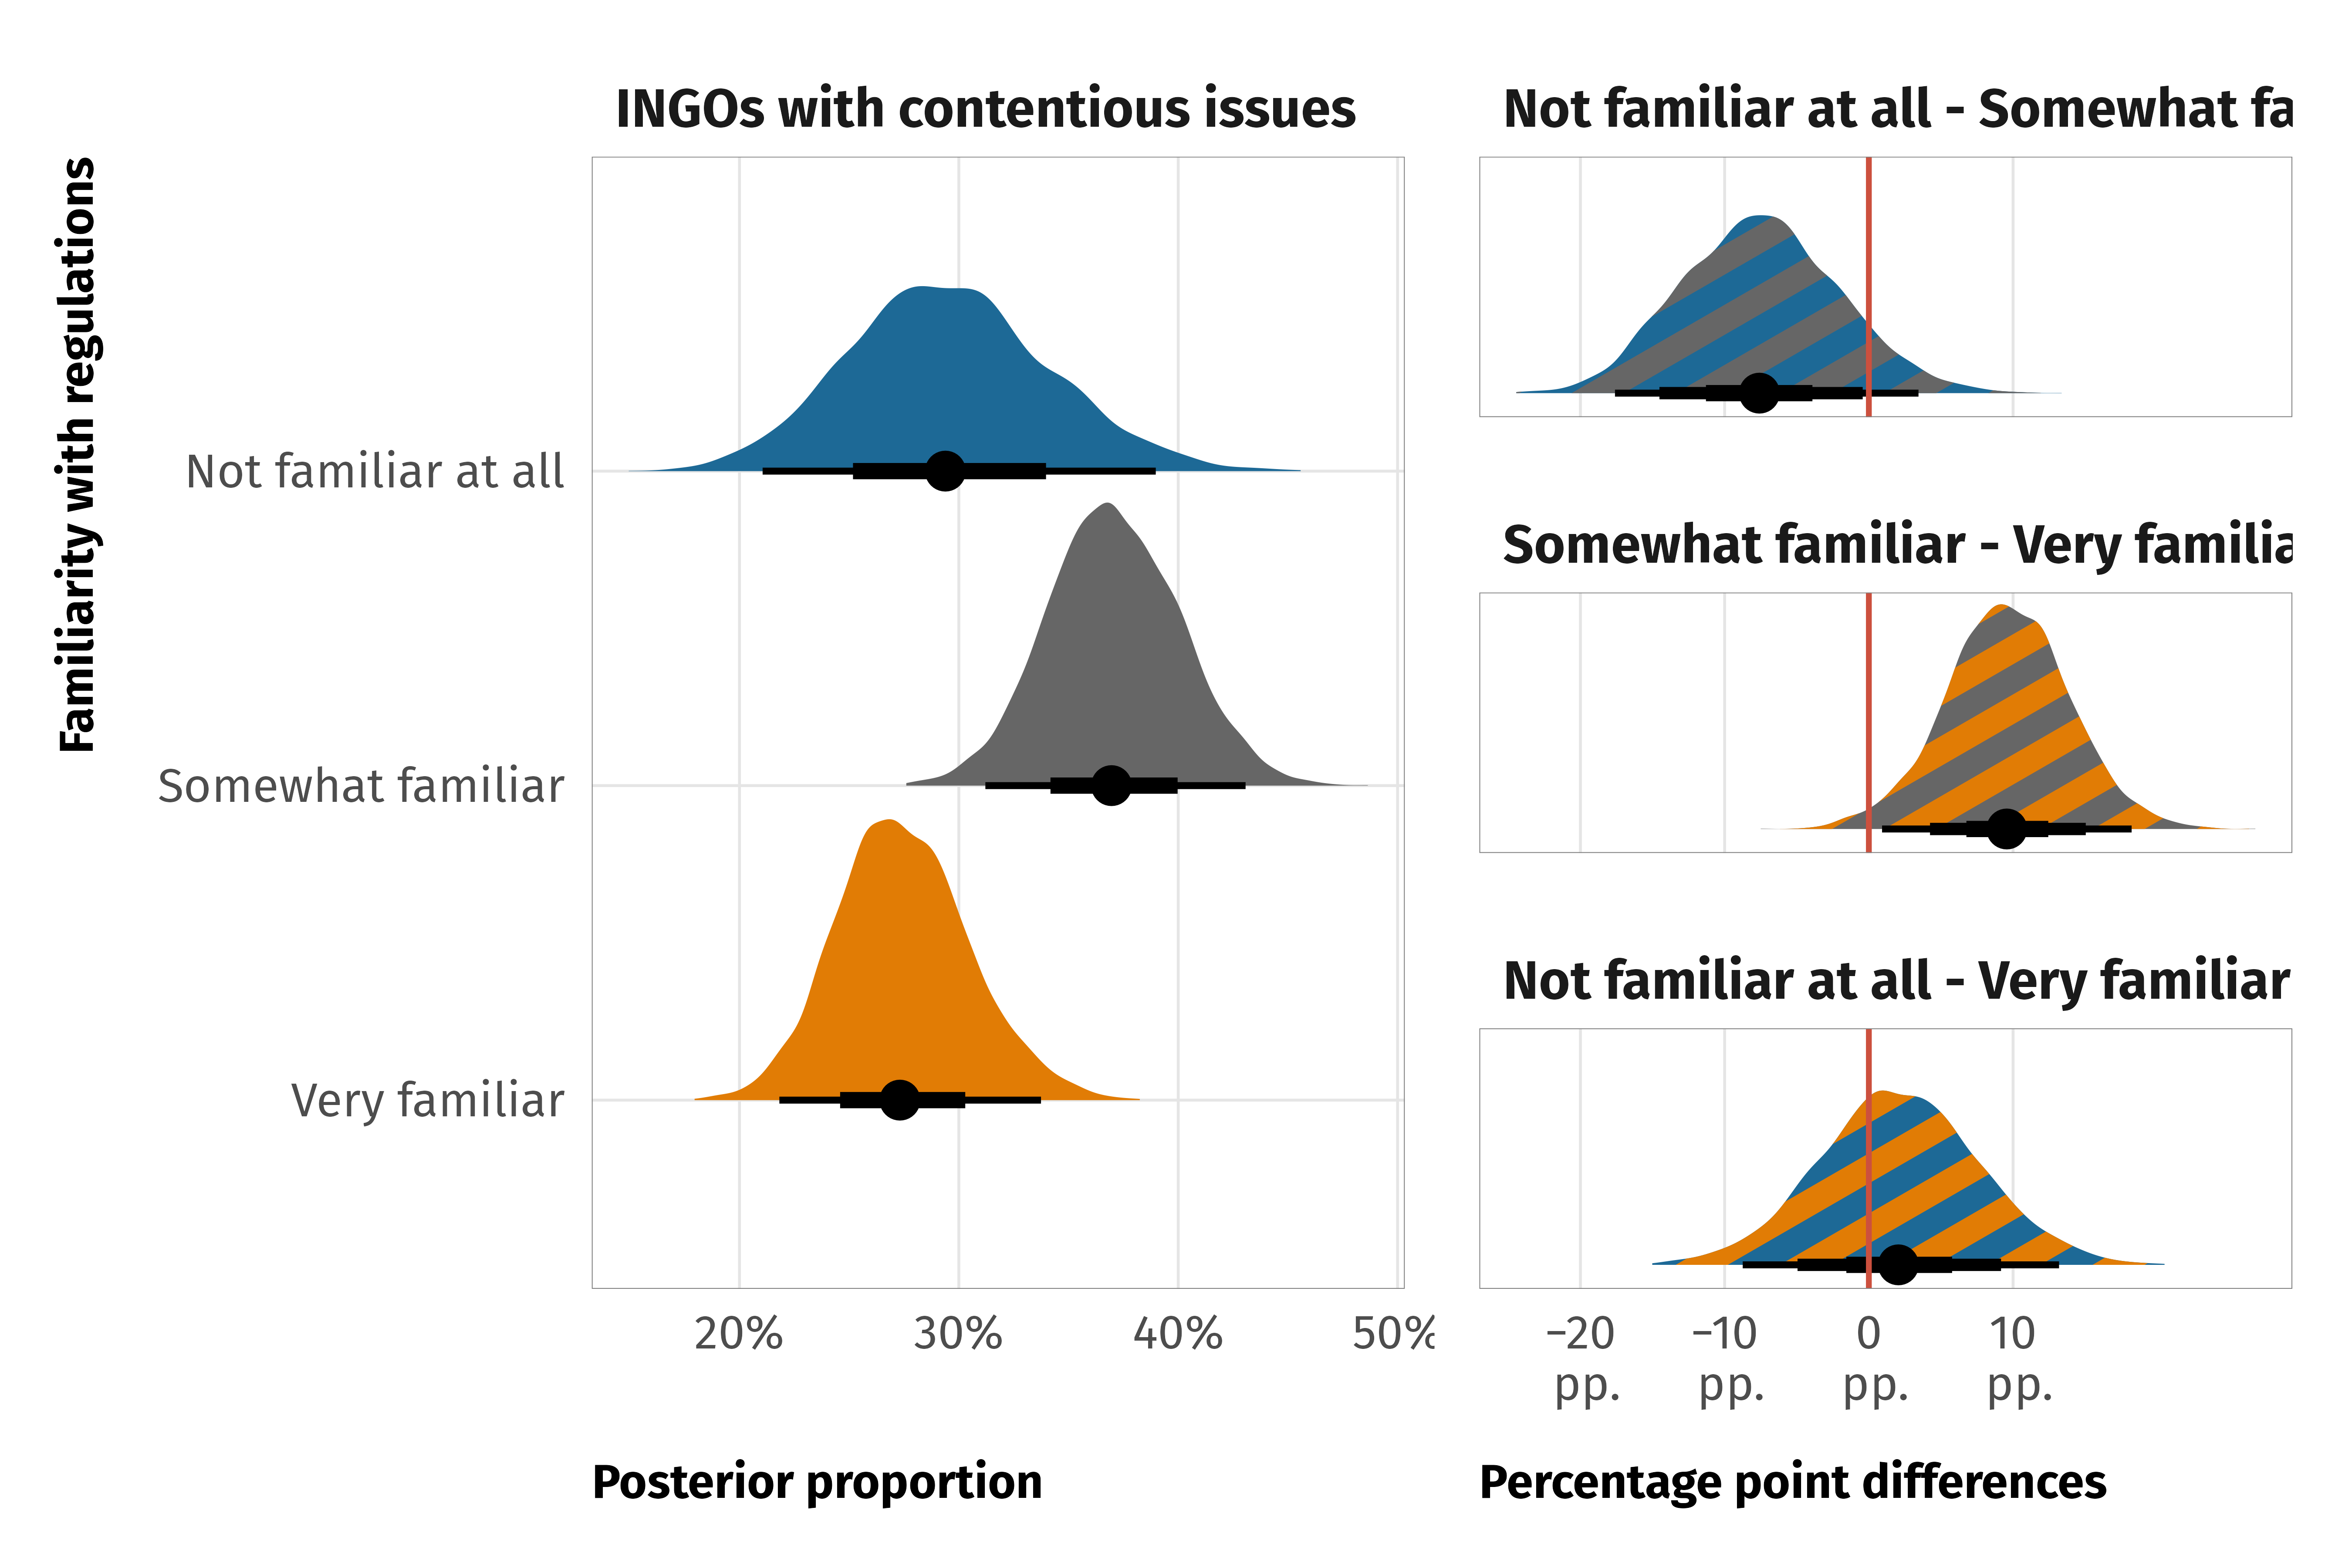
Median proportions for NGOs working on contentious issues
Not familiar at all
0.29 (0.21 – 0.39)
—
Very familiar
0.27 (0.22 – 0.34)
—
Somewhat familiar
0.37 (0.31 – 0.43)
—
Differences
Not familiar at all − Somewhat familiar
-0.08 (-0.18 – 0.03)
0.09
Not familiar at all − Very familiar
0.02 (-0.09 – 0.13)
0.65
Somewhat familiar − Very familiar
0.10 (0.01 – 0.18)
0.98
95% credible intervals shown in parentheses
Frequency of changes
Code
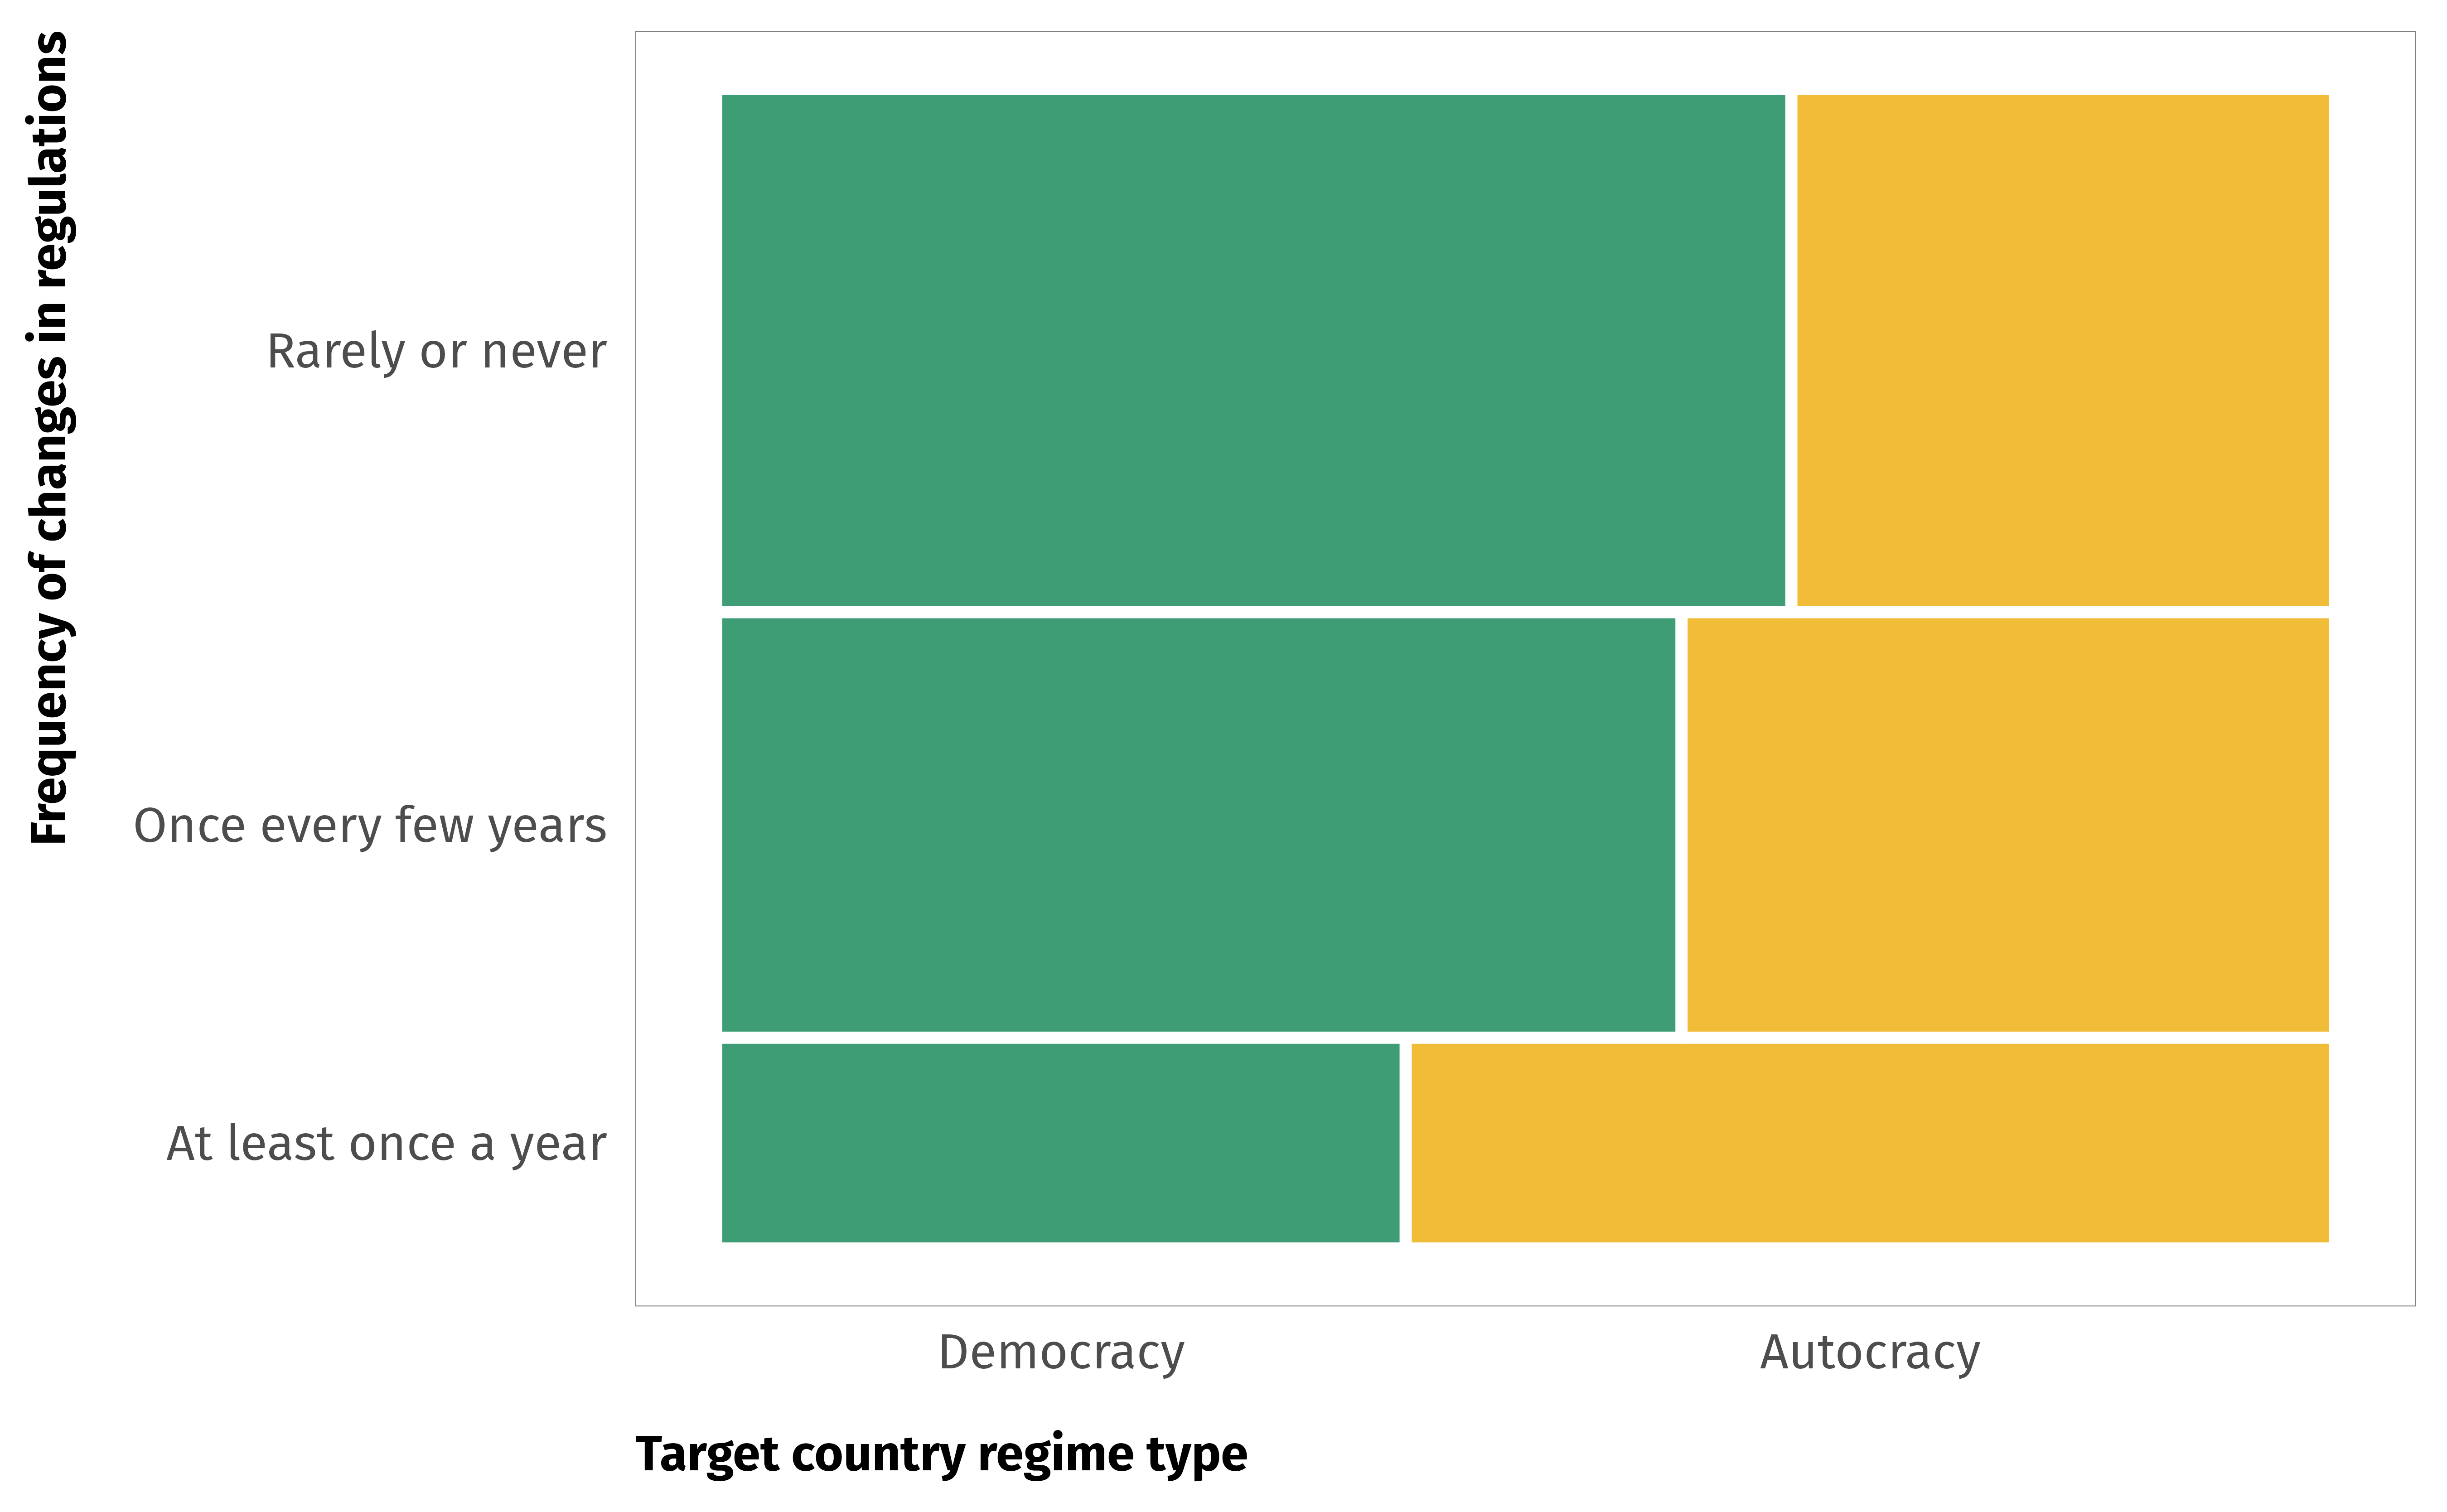
ggplot(data = df_frequency_regime) +geom_mosaic(aes(x =product(target.regime.type, Q4.14_collapsed),fill = target.regime.type ),divider =mosaic("v"),offset =0, color ="white", linewidth =1 ) +scale_fill_manual(values =c(clrs$Prism[4], clrs$Prism[6]),guide ="none" ) +labs(x ="Target country regime type",y ="Frequency of changes in regulations" ) +theme_ingo() +theme(panel.grid.major.x =element_blank(),panel.grid.major.y =element_blank(),plot.title =element_markdown(lineheight =1.2) )
Code
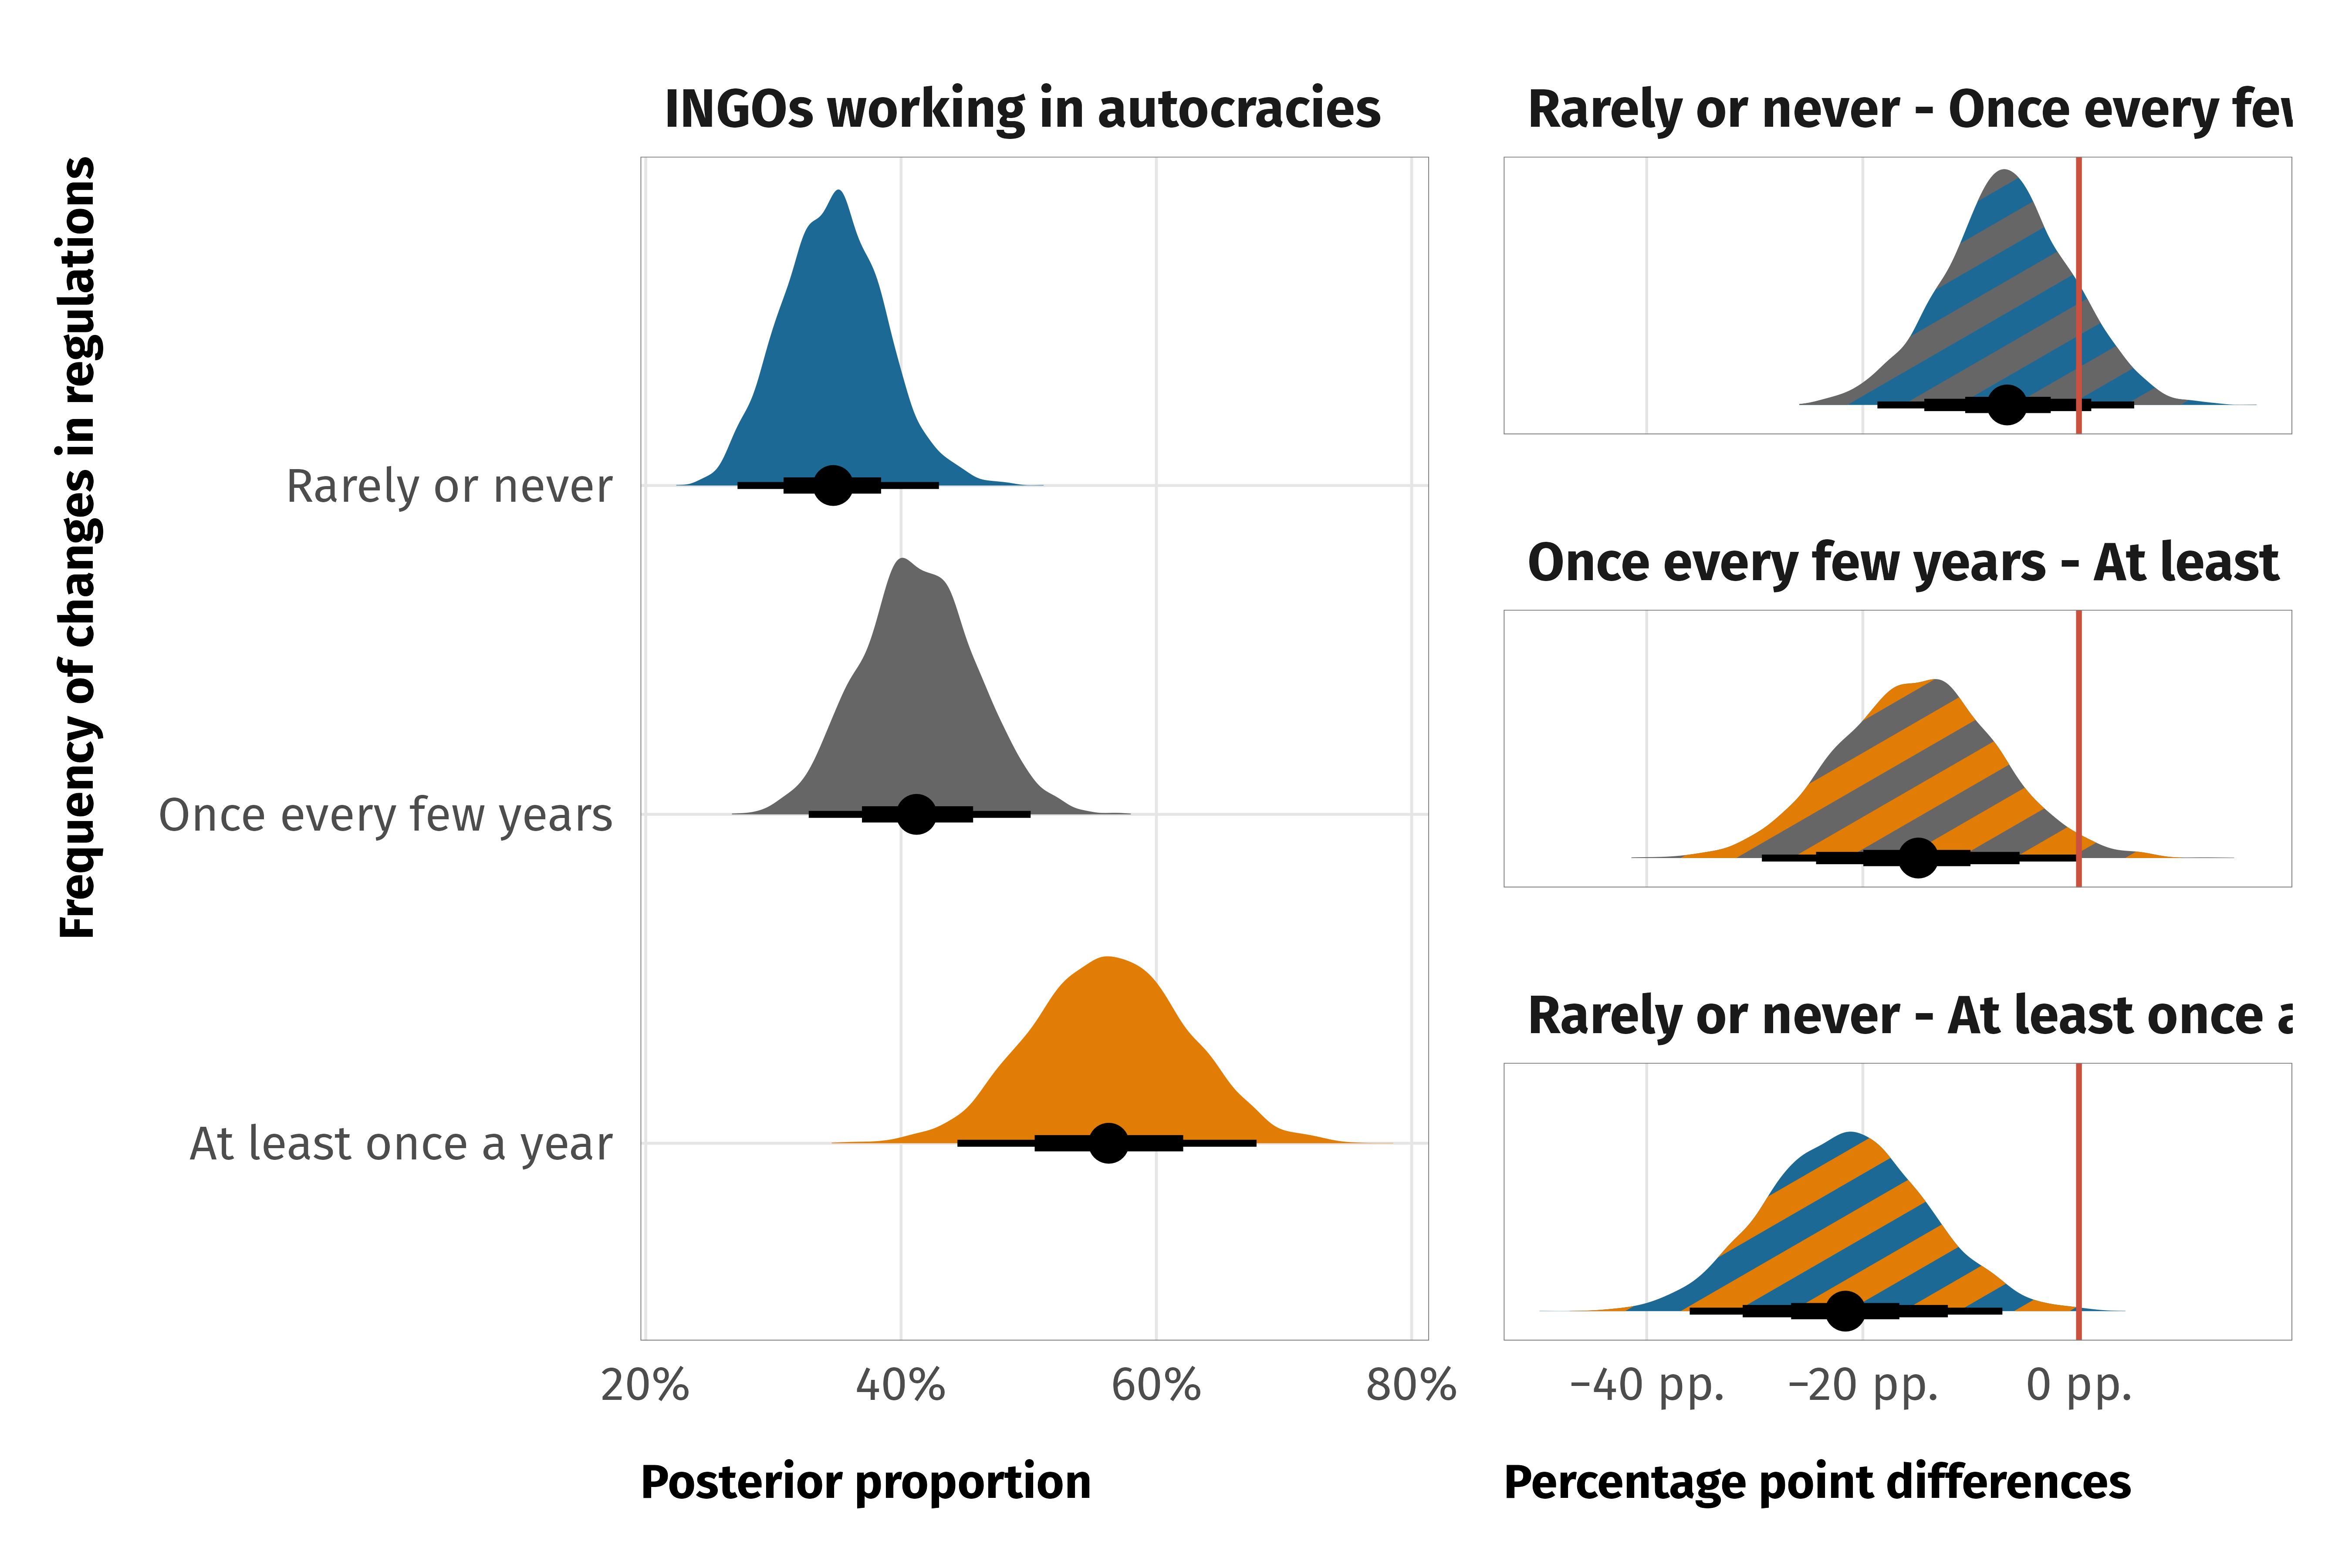
p1 <- models_frequency_regime$draws %>%ggplot(aes(x = .epred, y = Q4.14_collapsed, fill = Q4.14_collapsed)) +stat_halfeye() +scale_x_continuous(labels =label_percent()) +scale_fill_manual(values =c(clrs$Prism[7], clrs$Prism[12], clrs$Prism[2]),guide ="none" ) +labs(x ="Posterior proportion", y ="Frequency of changes in regulations") +facet_wrap(vars("INGOs working in autocracies")) +theme_ingo()plot_data <- models_frequency_regime$diffs %>%mutate(diffs =factor(Q4.14_collapsed,levels =c("Rarely or never - Once every few years","Once every few years - At least once a year","Rarely or never - At least once a year" ) ))diffs_summary <- plot_data %>%group_by(diffs) %>%median_qi(.epred, .width =c(0.5, 0.8, 0.95))p2 <- models_frequency_regime$diffs %>%mutate(diffs =factor(Q4.14_collapsed,levels =c("Rarely or never - Once every few years","Once every few years - At least once a year","Rarely or never - At least once a year" ) )) %>%ggplot(aes(x = .epred, fill = diffs, pattern_fill = diffs)) +geom_density_pattern(pattern ="stripe",pattern_density =0.5,pattern_spacing =0.2,pattern_size =0,trim =TRUE,linewidth =0 ) +geom_pointinterval(data = diffs_summary, aes(x = .epred, xmin = .lower, xmax = .upper)) +geom_vline(xintercept =0, linewidth =0.5, color = clrs$Prism[8]) +facet_wrap(vars(diffs), ncol =1) +scale_fill_manual(values =c(clrs$Prism[2], clrs$Prism[12], clrs$Prism[2]),guide ="none") +scale_pattern_fill_manual(values =c(clrs$Prism[12], clrs$Prism[7], clrs$Prism[7]),guide ="none") +scale_x_continuous(labels =label_number(scale =100, style_negative ="minus",suffix =" pp."),breaks =seq(-0.6, 0.2, by =0.2)) +labs(x ="Percentage point differences", y =NULL) +theme_ingo() +theme(panel.grid.major.y =element_blank(),axis.text.y =element_blank())p1 | p2
Median proportions for INGOs working in autocracies
At least once a year
0.56 (0.44 – 0.68)
—
Once every few years
0.41 (0.33 – 0.50)
—
Rarely or never
0.35 (0.27 – 0.43)
—
Differences
Once every few years − At least once a year
-0.15 (-0.29 – 0.00)
0.02
Rarely or never − At least once a year
-0.22 (-0.36 – -0.07)
0.00
Rarely or never − Once every few years
-0.07 (-0.19 – 0.05)
0.14
95% credible intervals shown in parentheses
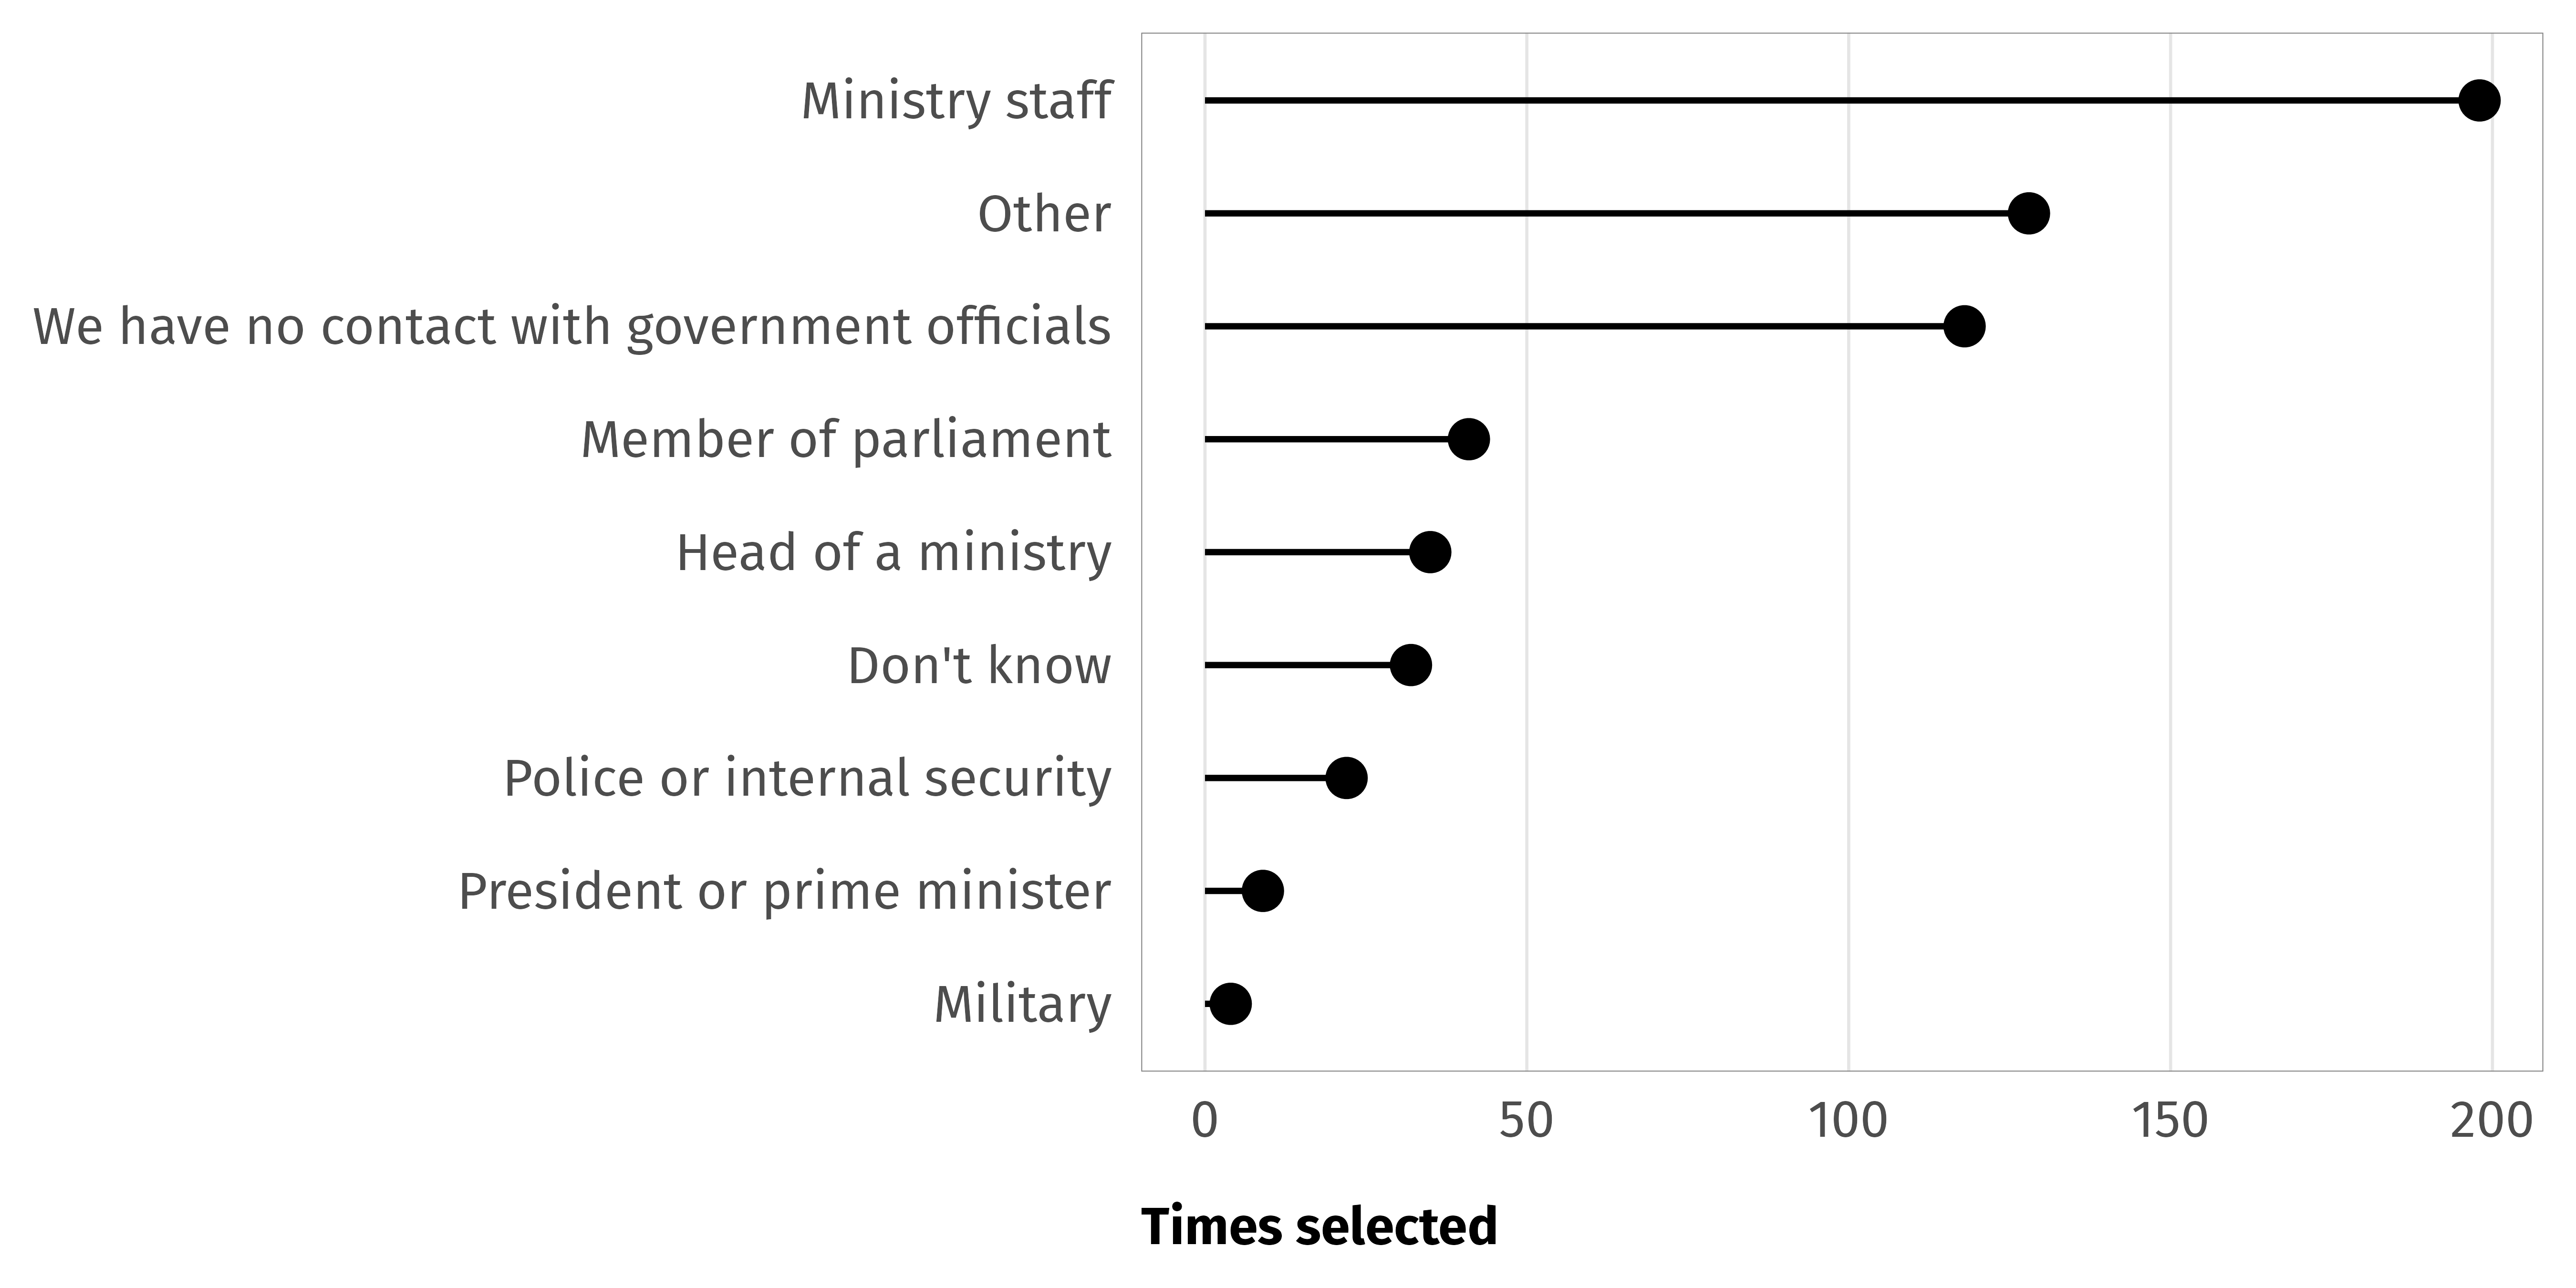
How NGOs find out about changes
Code
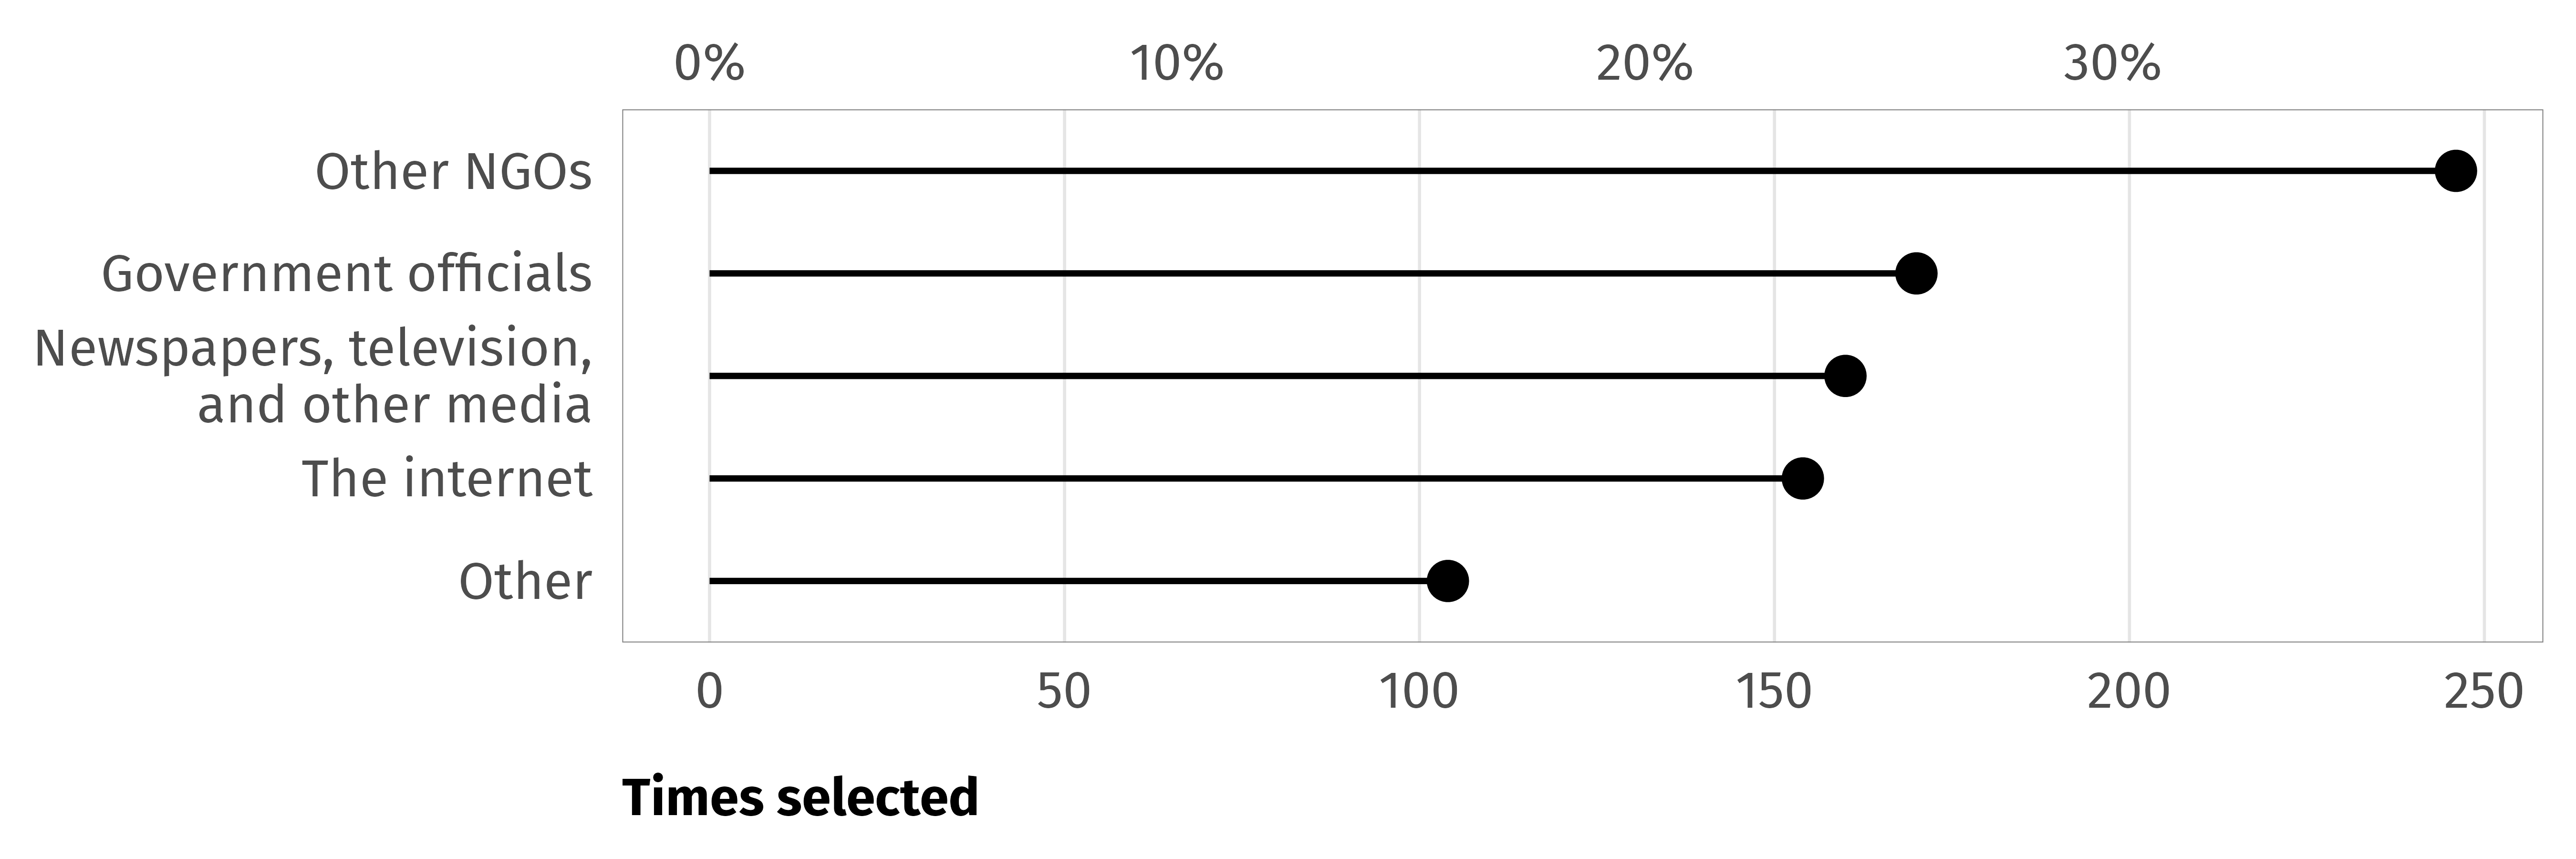
df_change_how <- survey_countries %>%unnest(Q4.15_value) %>%group_by(Q4.15_value) %>%summarise(num =n()) %>%arrange(desc(num)) %>%filter(!is.na(Q4.15_value)) %>%mutate(how =fct_inorder(Q4.15_value)) %>%mutate(how =fct_recode(how,"Newspapers, television,\nand other media"="Newspapers, television, and other media", NULL ="Don't know" )) %>%filter(!is.na(how))ggplot(df_change_how, aes(x = num, y =fct_rev(how))) +geom_pointrange(aes(xmin =0, xmax = num)) +scale_x_continuous(sec.axis =sec_axis(~ . /nrow(survey_countries),labels =label_percent() )) +labs(x ="Times selected", y =NULL) +theme_ingo() +theme(panel.grid.major.y =element_blank())
Code
# What are the other ways?df_change_how_other <- survey_countries %>%filter(!is.na(Q4.15_other_TEXT)) %>%select(clean.id, Q4.15_other_TEXT) %>%arrange(Q4.15_other_TEXT)
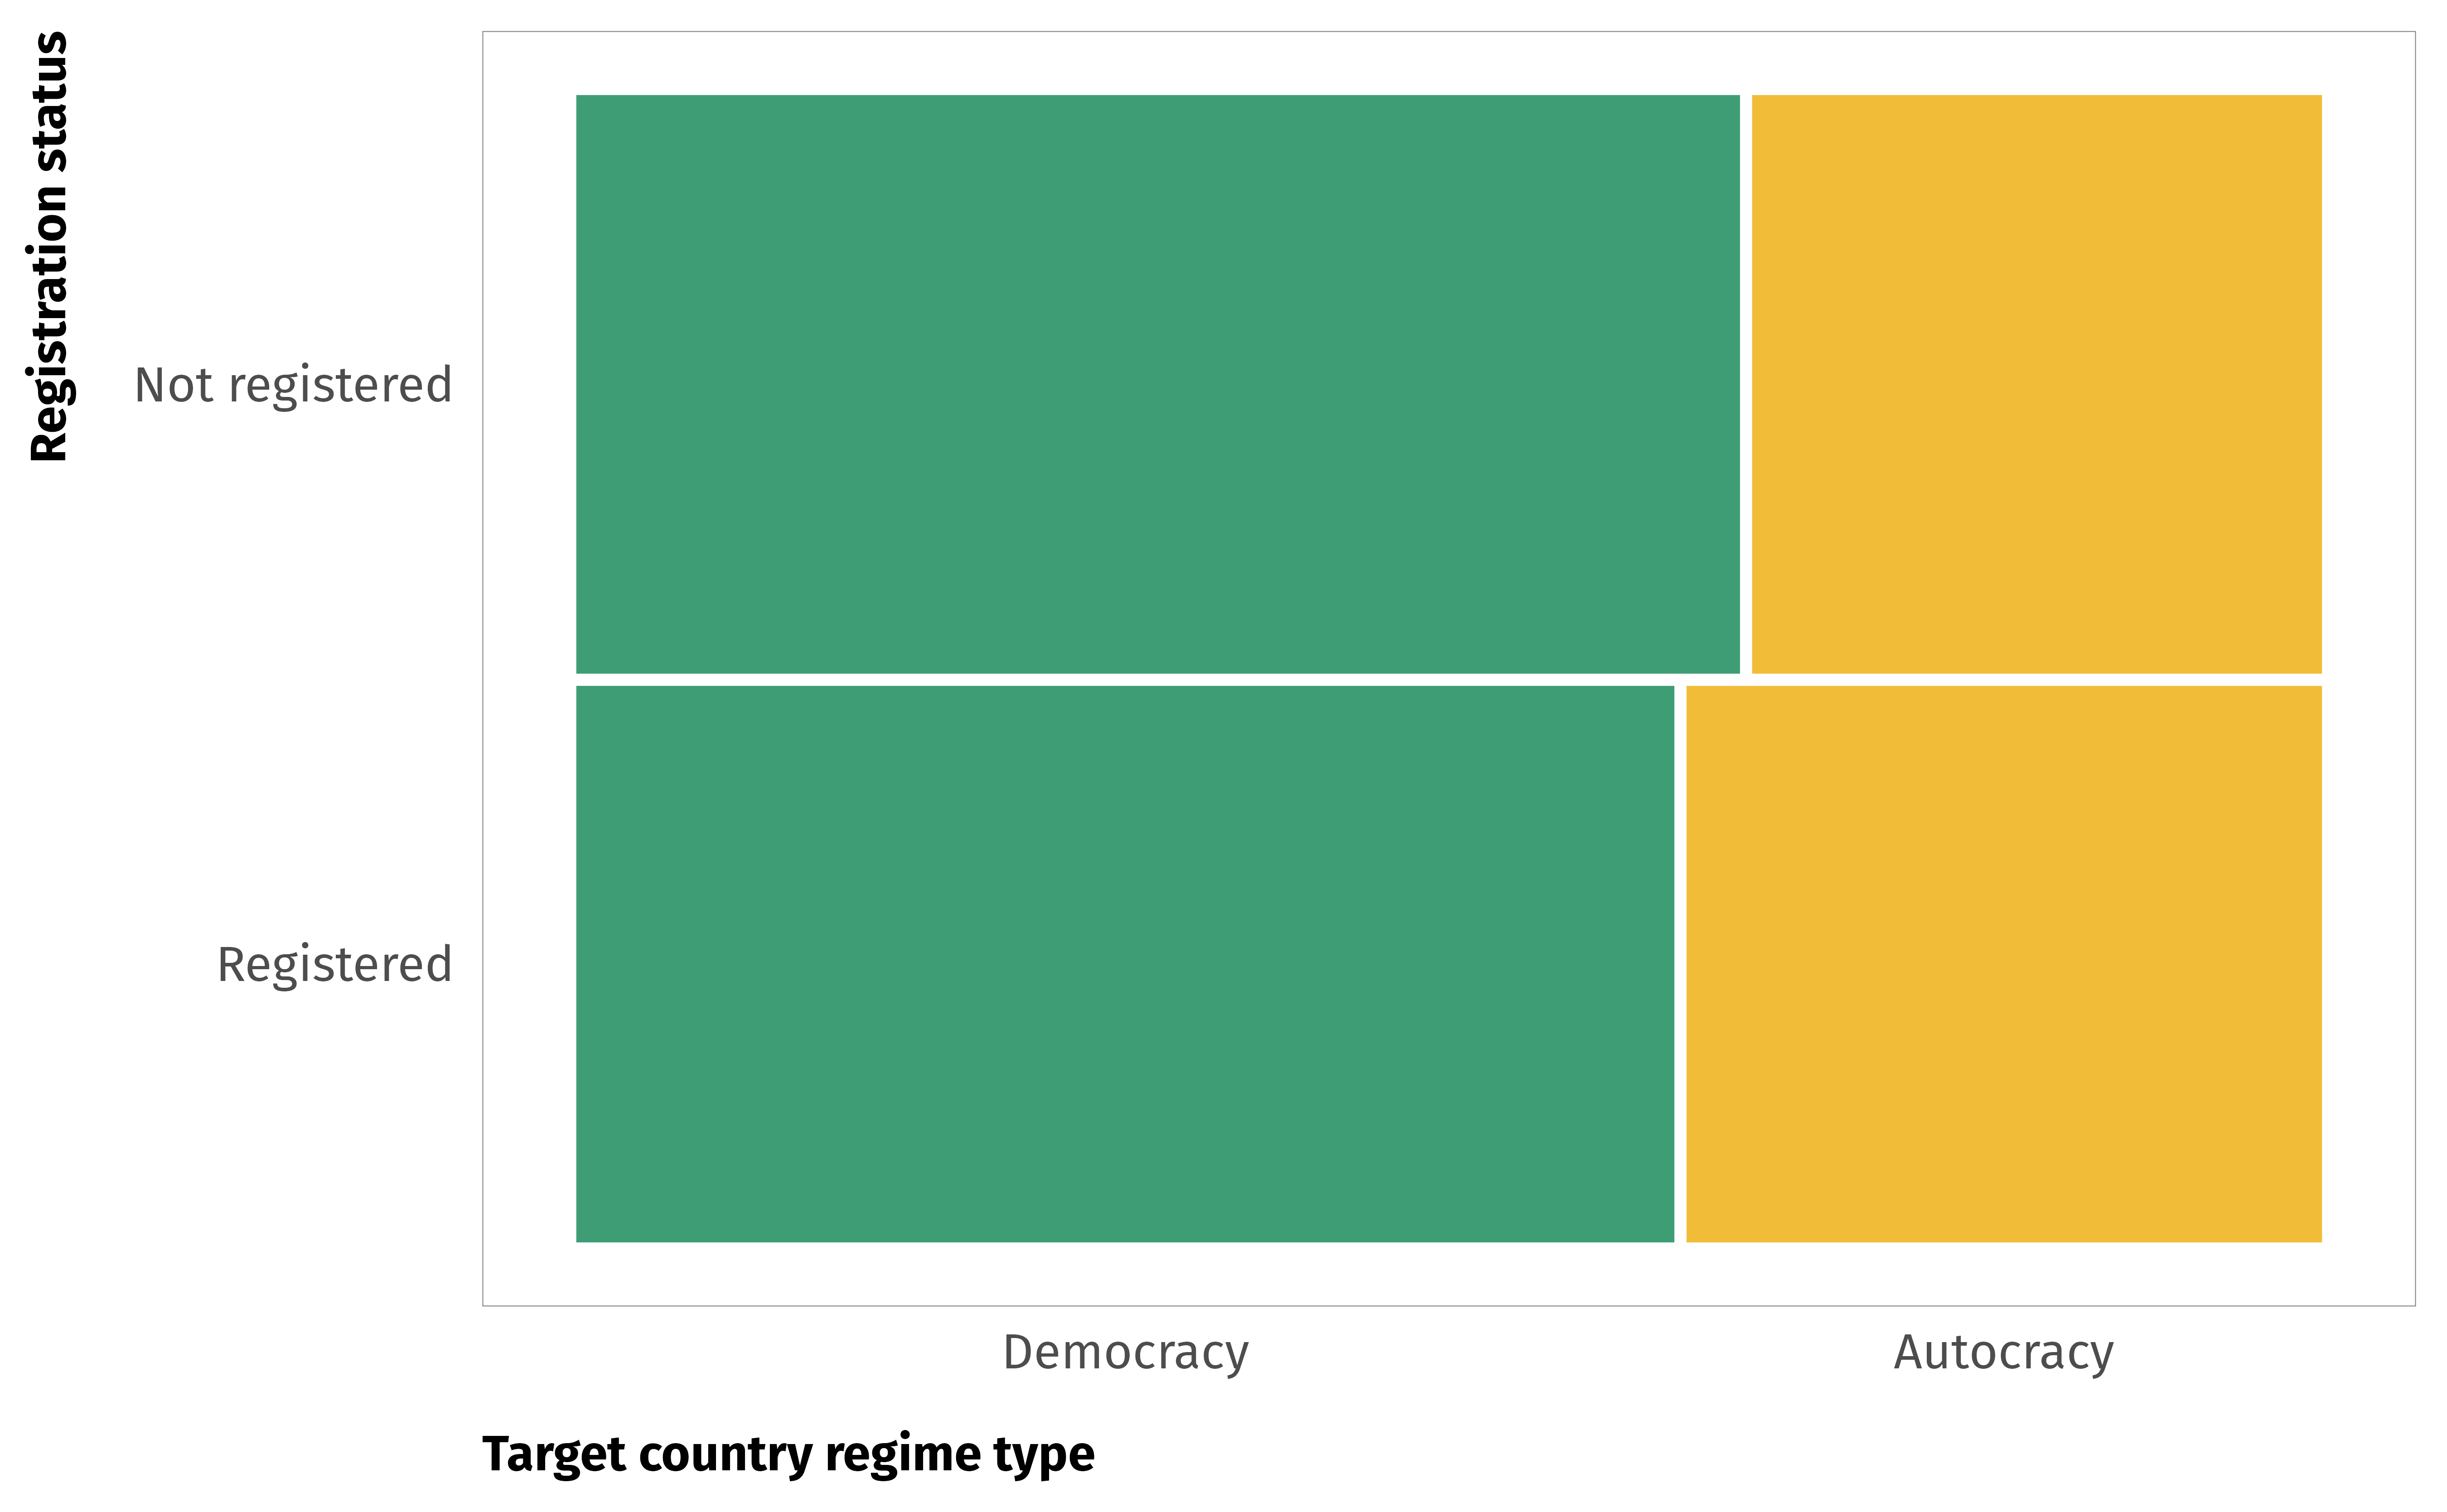
Median proportions for NGOs working on contentious issues
Registered
0.30 (0.25 – 0.35)
—
Not registered
0.34 (0.29 – 0.40)
—
Differences
Not registered − Registered
0.04 (-0.03 – 0.12)
0.88
95% credible intervals shown in parentheses
Government involvement in INGO activity
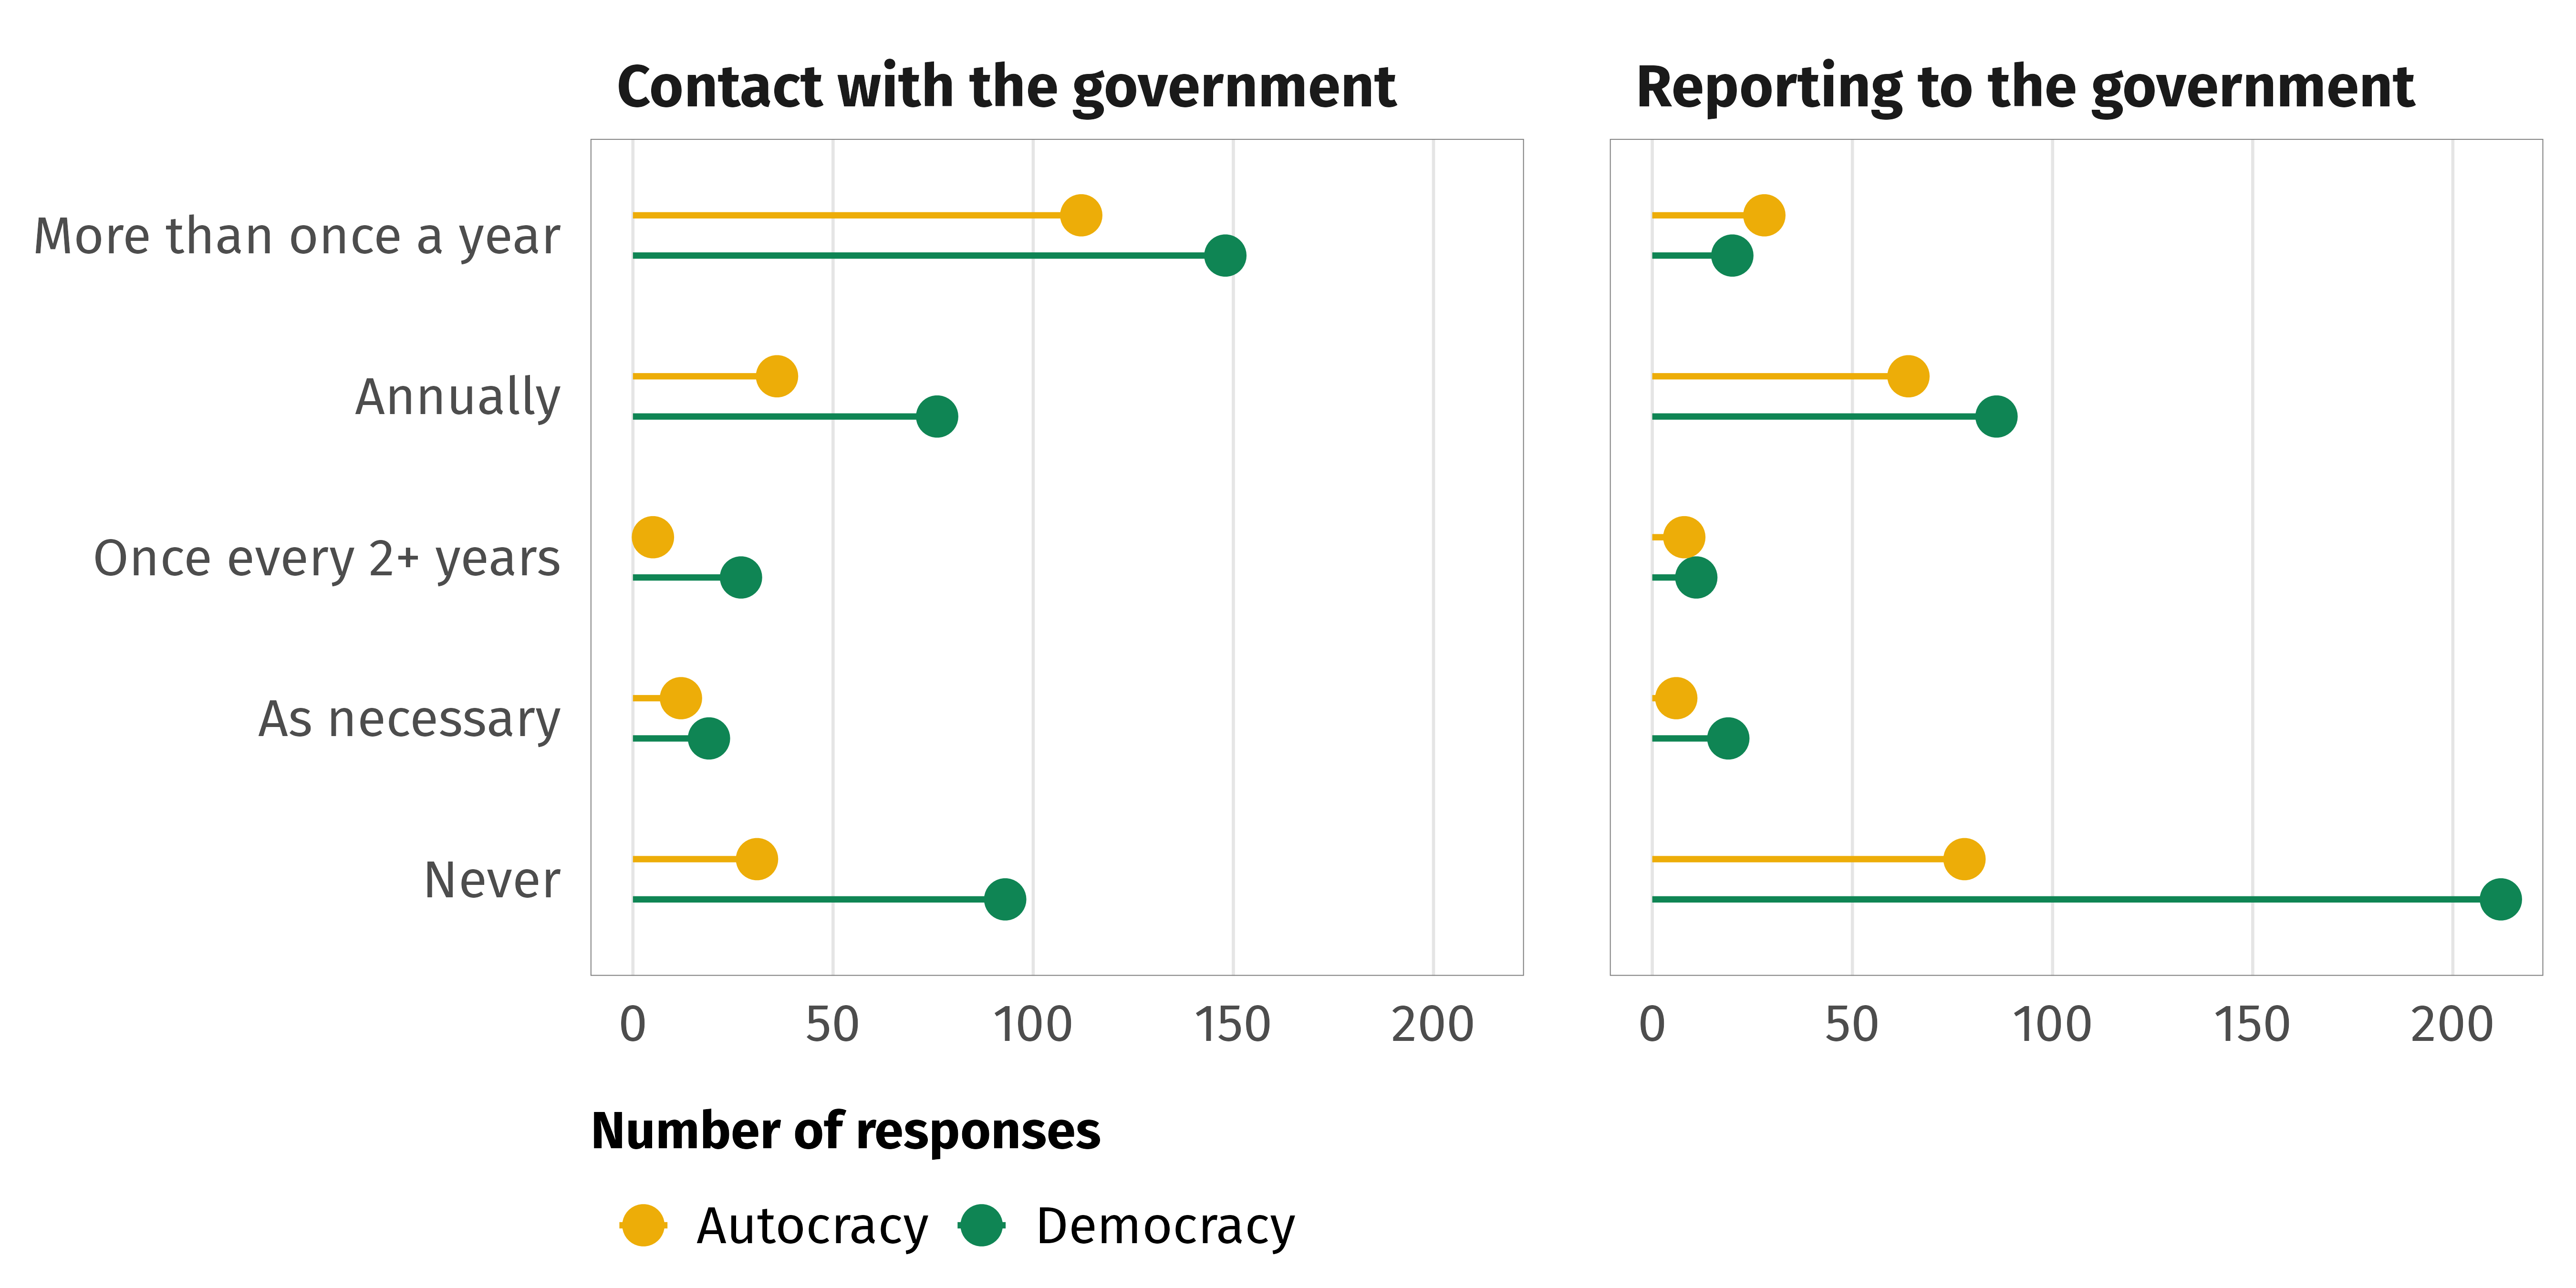
Contact and reporting frequency
Code
df_freq_report <- survey_all %>%mutate(Q4.8.collapsed =fct_recode(Q4.8.clean,`More than once a year`="More than once a week",`More than once a year`="Once a week",`More than once a year`="More than once a month,\nless than once a week",`More than once a year`="Once a month",`More than once a year`="More than once a year,\nless than once a month",`Annually`="Once a year",`Once every 2+ years`="Once every 2+ years",`Never`="Rarely",`Never`="Never",`As necessary`="As necessary/depends",NULL ="Don't know" )) %>%mutate(Q4.8.collapsed =fct_relevel(Q4.8.collapsed, "As necessary", after =1)) %>%filter(!is.na(Q4.8.collapsed)) %>%group_by(target.regime.type, Q4.8.collapsed) %>%summarise(num =n()) %>%rename(freq = Q4.8.collapsed)
Code
df_freq_contact <- survey_all %>%mutate(Q4.5.collapsed =fct_recode(Q4.5.clean,`More than once a year`="More than once a week",`More than once a year`="Once a week",`More than once a year`="More than once a month,\nless than once a week",`More than once a year`="Once a month",`More than once a year`="More than once a year,\nless than once a month",`Annually`="Once a year",`Once every 2+ years`="Once every 2+ years",`Never`="Rarely",`Never`="Never",`As necessary`="As necessary/depends",NULL ="Don't know" )) %>%mutate(Q4.5.collapsed =fct_relevel(Q4.5.collapsed, "As necessary", after =1)) %>%filter(!is.na(Q4.5.collapsed)) %>%group_by(target.regime.type, Q4.5.collapsed) %>%summarise(num =n()) %>%rename(freq = Q4.5.collapsed)
Code
df_freq_both <-bind_rows( df_freq_contact, df_freq_report,.id ="report.type") %>%mutate(report.type =recode( report.type,`1`="Contact with the government",`2`="Reporting to the government" ))ggplot( df_freq_both,aes(x = num, y = freq,colour = target.regime.type )) +geom_pointrange(aes(xmin =0, xmax = num),position =position_dodge(width =0.5),size =0.5 ) +scale_colour_manual(values =c(clrs$Prism[4], clrs$Prism[6]), name =NULL ) +guides(colour =guide_legend(reverse =TRUE)) +labs(x ="Number of responses", y =NULL) +facet_wrap(vars(report.type)) +theme_ingo() +theme(panel.grid.major.y =element_blank())