Analysis and figures
Suparna Chaudhry, Marc Dotson, and Andrew Heiss
Last run: 2021-04-21
library(tidyverse)
library(targets)
library(scales)
library(patchwork)
library(here)

# Generated via random.org
set.seed(8316)

# Load data
# Need to use this withr thing because tar_read() and tar_load() need to see the
# _targets folder in the current directory, but this .Rmd file is in a subfolder
withr::with_dir(here::here(), {
  source(tar_read(plot_funs))

  tar_load(survey_results)
  tar_load(sim_excel_final)
  tar_load(sim_final)
  tar_load(giving_aggregate)
  tar_load(giving_per_capita)
})
General demographics of recipients
Religion
religion_lookup <- tribble(
  ~Q5.10, ~religion,
  1, "Catholic",
  2, "Protestant",
  3, "Christian Orthodox",
  4, "Jewish",
  5, "Muslim",
  6, "Sikh",
  7, "Hindu",
  8, "Buddhist",
  9, "Atheist",
  10, "Other"
)

n_respondents <- nrow(survey_results)

religions <- survey_results %>%
  count(Q5.10) %>%
  left_join(religion_lookup, by = "Q5.10") %>%
  arrange(n) %>%
  mutate(religion = fct_inorder(religion)) %>%
  mutate(percent = n / n_respondents)

ggplot(religions, aes(x = n, y = religion)) +
  geom_col(fill = clrs_okabe_ito$reddish_purple) +
  scale_x_continuous(sec.axis = sec_axis(~. / n_respondents, labels = percent)) +
  labs(x = "Number of respondents", y = NULL) +
  theme_ngo()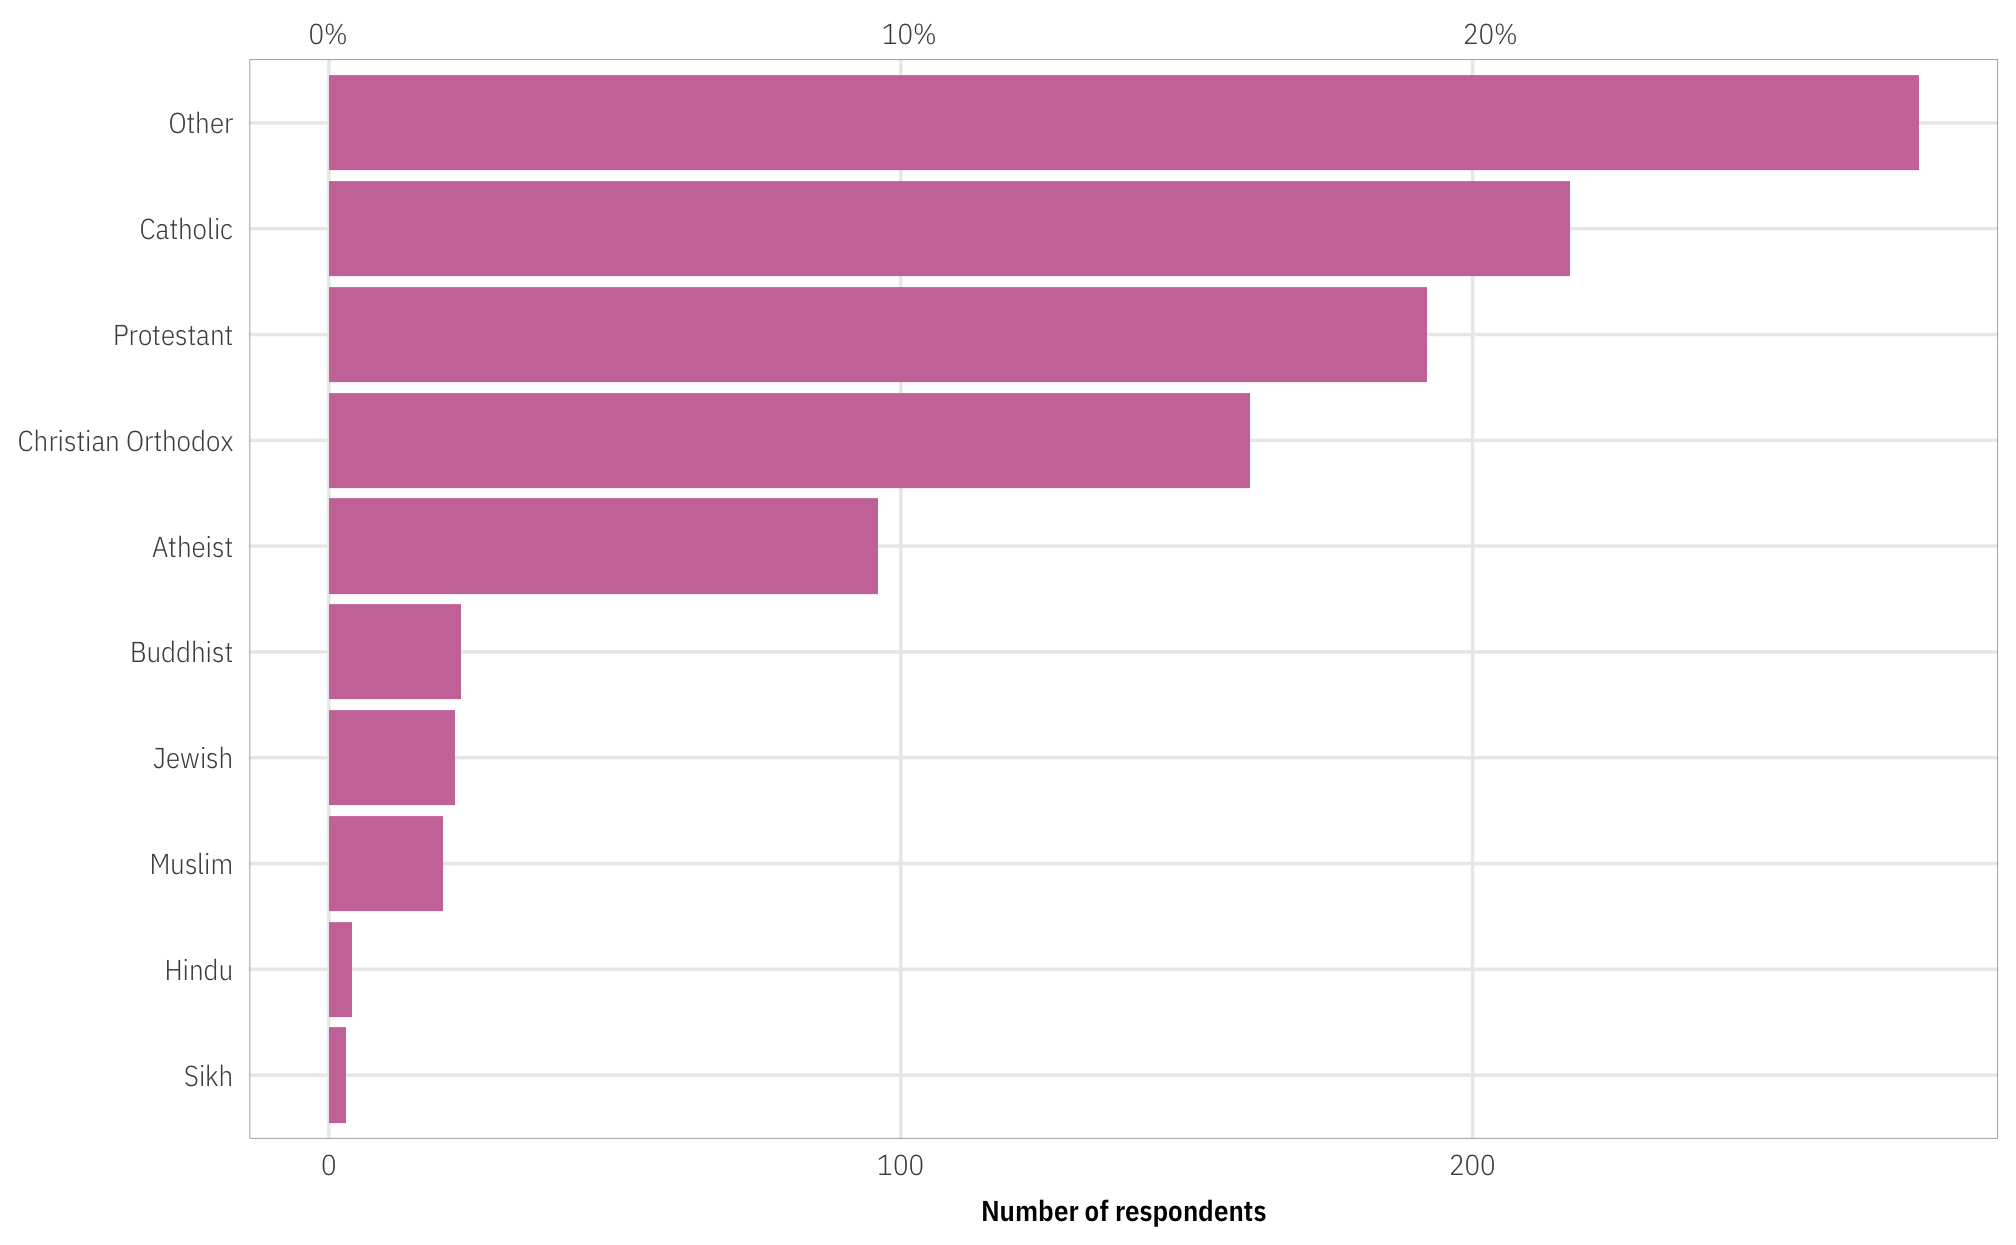
religion_others <- survey_results %>%
  filter(!is.na(Q5.10_TEXT)) %>%
  mutate(Q5.10_TEXT = str_to_lower(Q5.10_TEXT)) %>%
  count(Q5.10_TEXT) %>%
  arrange(desc(n))
religion_others
## # A tibble: 91 x 2
## Q5.10_TEXT n
## <chr> <int>
## 1 christian 34
## 2 agnostic 21
## 3 none 18
## 4 spiritual 9
## 5 baptist 8
## 6 born again christian 4
## 7 pagan 4
## 8 wiccan 4
## 9 lds 3
## 10 methodist 3
## # … with 81 more rowsGeneral trends in private philanthropy
Based on data from Giving USA, philanthropy in the United states continues to increase, both in aggregate and per capita.
Total giving
ggplot(giving_aggregate, aes(x = Year, y = `Total donations`)) +
  geom_line(size = 1, color = clrs_okabe_ito$orange) +
  scale_x_continuous(breaks = seq(1980, 2015, 5)) +
  scale_y_continuous(labels = dollar, breaks = seq(100, 450, 50)) +
  coord_cartesian(ylim = c(100, 450)) +
  labs(x = NULL, y = "Billions of dollars") +
  theme_ngo()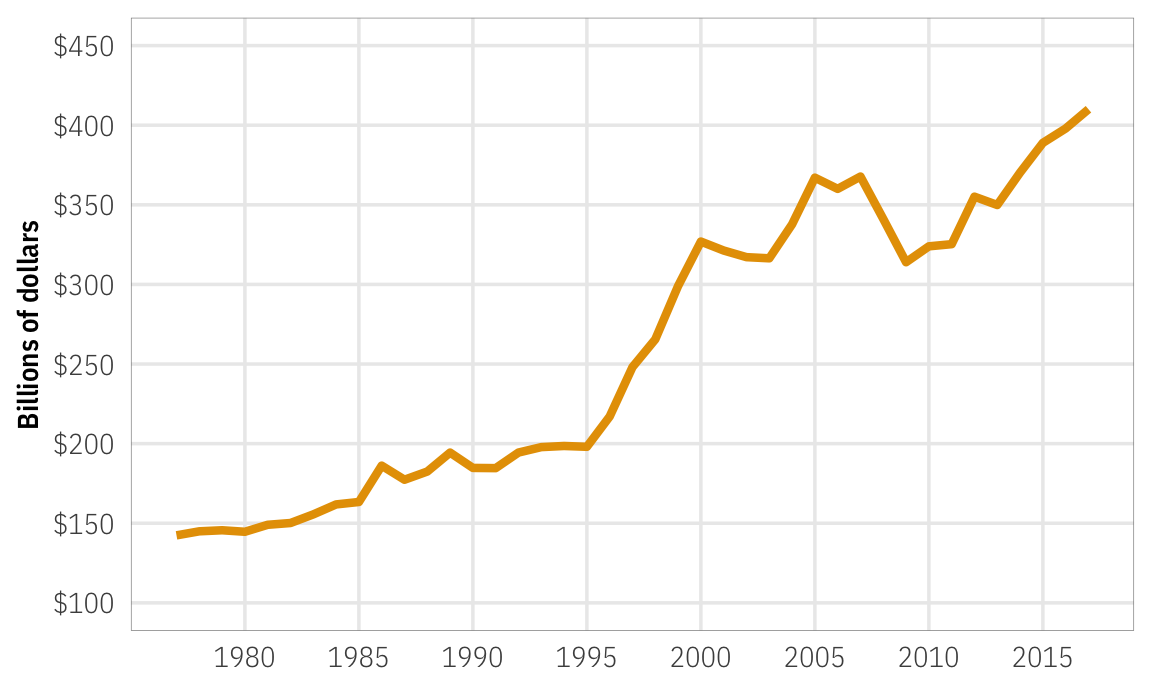
Average per capita giving
ggplot(giving_per_capita, aes(x = Year, y = `Average giving`)) +
  geom_line(size = 1, color = clrs_okabe_ito$sky_blue) +
  scale_x_continuous(breaks = seq(2000, 2014, 2)) +
  scale_y_continuous(labels = dollar, breaks = seq(1750, 2750, 250)) +
  coord_cartesian(ylim = c(1750, 2750)) +
  labs(x = NULL, y = "Average annual donation") +
  theme_ngo()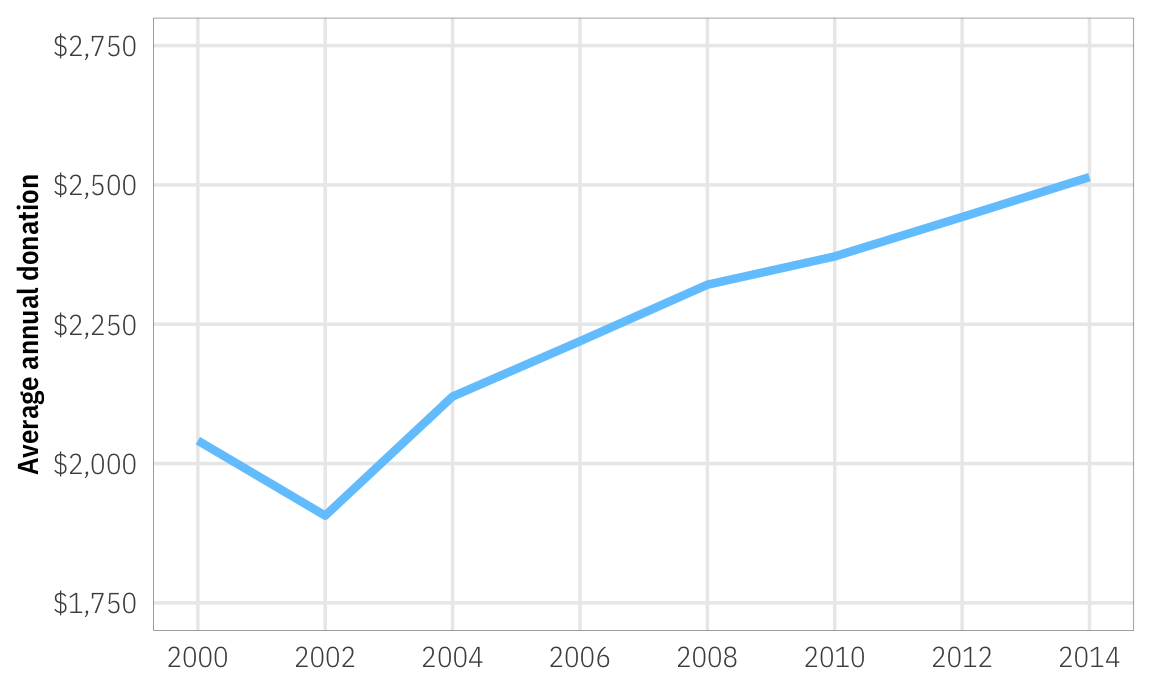
Simulations
Income across issue area, funding, and relationship
plot_income_issue <- sim_final %>%
  group_by(org_issue, persona_income) %>%
  summarize(avg_share = mean(share)) %>%
  mutate(facet = "Issue area") %>%
  ggplot(aes(y = fct_rev(str_wrap_factor(org_issue, 15)),
             x = avg_share, color = fct_rev(persona_income))) +
  geom_pointrange(size = 0.75, fatten = 1.5,
                  aes(xmin = 0, xmax = ..x..), position = position_dodge(width = 0.5)) +
  scale_x_continuous(labels = percent_format(accuracy = 1), expand = expansion(add = c(0, 0.002)),
                     breaks = seq(0, 0.06, 0.02)) +
  scale_color_manual(values = clrs_ngo_pairs[[1]], guide = FALSE) +
  coord_cartesian(xlim = c(0, 0.06)) +
  labs(x = "Average donation share", y = NULL, color = NULL) +
  facet_wrap(vars(facet)) +
  theme_ngo() +
  theme(panel.grid.major.y = element_blank())

plot_income_funding <- sim_final %>%
  group_by(org_funding, persona_income) %>%
  summarize(avg_share = mean(share)) %>%
  mutate(facet = "Funding sources") %>%
  ggplot(aes(y = fct_rev(str_wrap_factor(org_funding, 10)),
             x = avg_share, color = fct_rev(persona_income))) +
  geom_pointrange(size = 0.75, fatten = 1.5,
                  aes(xmin = 0, xmax = ..x..), position = position_dodge(width = 0.5)) +
  scale_x_continuous(labels = percent_format(accuracy = 1), expand = expansion(add = c(0, 0.002))) +
  coord_cartesian(xlim = c(0, 0.06)) +
  scale_color_manual(values = clrs_ngo_pairs[[1]], guide = FALSE) +
  labs(x = "Average donation share", y = NULL, color = NULL) +
  facet_wrap(vars(facet)) +
  theme_ngo() +
  theme(panel.grid.major.y = element_blank())

plot_income_relationship <- sim_final %>%
  mutate(persona_income = fct_recode(persona_income,
                                     "< $61,372/year" = "Lower income",
                                     "> $61,372/year" = "Higher income")) %>%
  group_by(org_relationship, persona_income) %>%
  summarize(avg_share = mean(share)) %>%
  mutate(facet = "Relationship with host government") %>%
  ggplot(aes(y = fct_rev(str_wrap_factor(org_relationship, 10)),
             x = avg_share, color = fct_rev(persona_income))) +
  geom_pointrange(size = 0.75, fatten = 1.5,
                  aes(xmin = 0, xmax = ..x..), position = position_dodge(width = 0.5)) +
  scale_x_continuous(labels = percent_format(accuracy = 1), expand = expansion(add = c(0, 0.003))) +
  coord_cartesian(xlim = c(0, 0.1)) +
  scale_color_manual(values = clrs_ngo_pairs[[1]],
                     guide = guide_legend(reverse = TRUE, nrow = 1,
                                          override.aes = list(size = 0.25,
                                                              linetype = 0))) +
  labs(x = "Average donation share", y = NULL, color = NULL) +
  facet_wrap(vars(str_wrap(facet, 50))) +
  theme_ngo() +
  theme(panel.grid.major.y = element_blank(),
        legend.key.width = unit(0.5, "lines"))

plot_income_relationship_extreme <- sim_excel_final %>%
  mutate(persona_income = fct_recode(persona_income,
                                     "$50,000/year" = "Lower income",
                                     "$100,000/year" = "Higher income"),
         org_relationship = fct_recode(org_relationship,
                                       "Under crackdown" = "Crackdown")) %>%
  group_by(org_relationship, persona_income) %>%
  summarize(avg_share = mean(share)) %>%
  mutate(facet = "Relationship with host government") %>%
  ggplot(aes(y = fct_rev(str_wrap_factor(org_relationship, 10)),
             x = avg_share, color = fct_rev(persona_income))) +
  geom_pointrange(size = 0.75, fatten = 1.5, linetype = "21", pch = 2,
                  aes(xmin = 0, xmax = ..x..), position = position_dodge(width = 0.5)) +
  scale_x_continuous(labels = percent_format(accuracy = 1), expand = expansion(add = c(0, 0.002))) +
  coord_cartesian(xlim = c(0, 0.1)) +
  scale_color_manual(values = clrs_ngo_pairs[[1]],
                     guide = guide_legend(reverse = TRUE, nrow = 1,
                                          override.aes = list(size = 0.25,
                                                              linetype = 0))) +
  labs(x = "Average donation share", y = NULL, color = NULL) +
  facet_wrap(vars(str_wrap(facet, 50))) +
  theme_ngo() +
  theme(panel.grid.major.y = element_blank(),
        legend.key.width = unit(0.5, "lines"))

plot_income <- ((plot_income_issue + labs(x = NULL)) +
  (plot_income_funding + labs(x = NULL))) /
  (plot_income_relationship + plot_income_relationship_extreme)

plot_income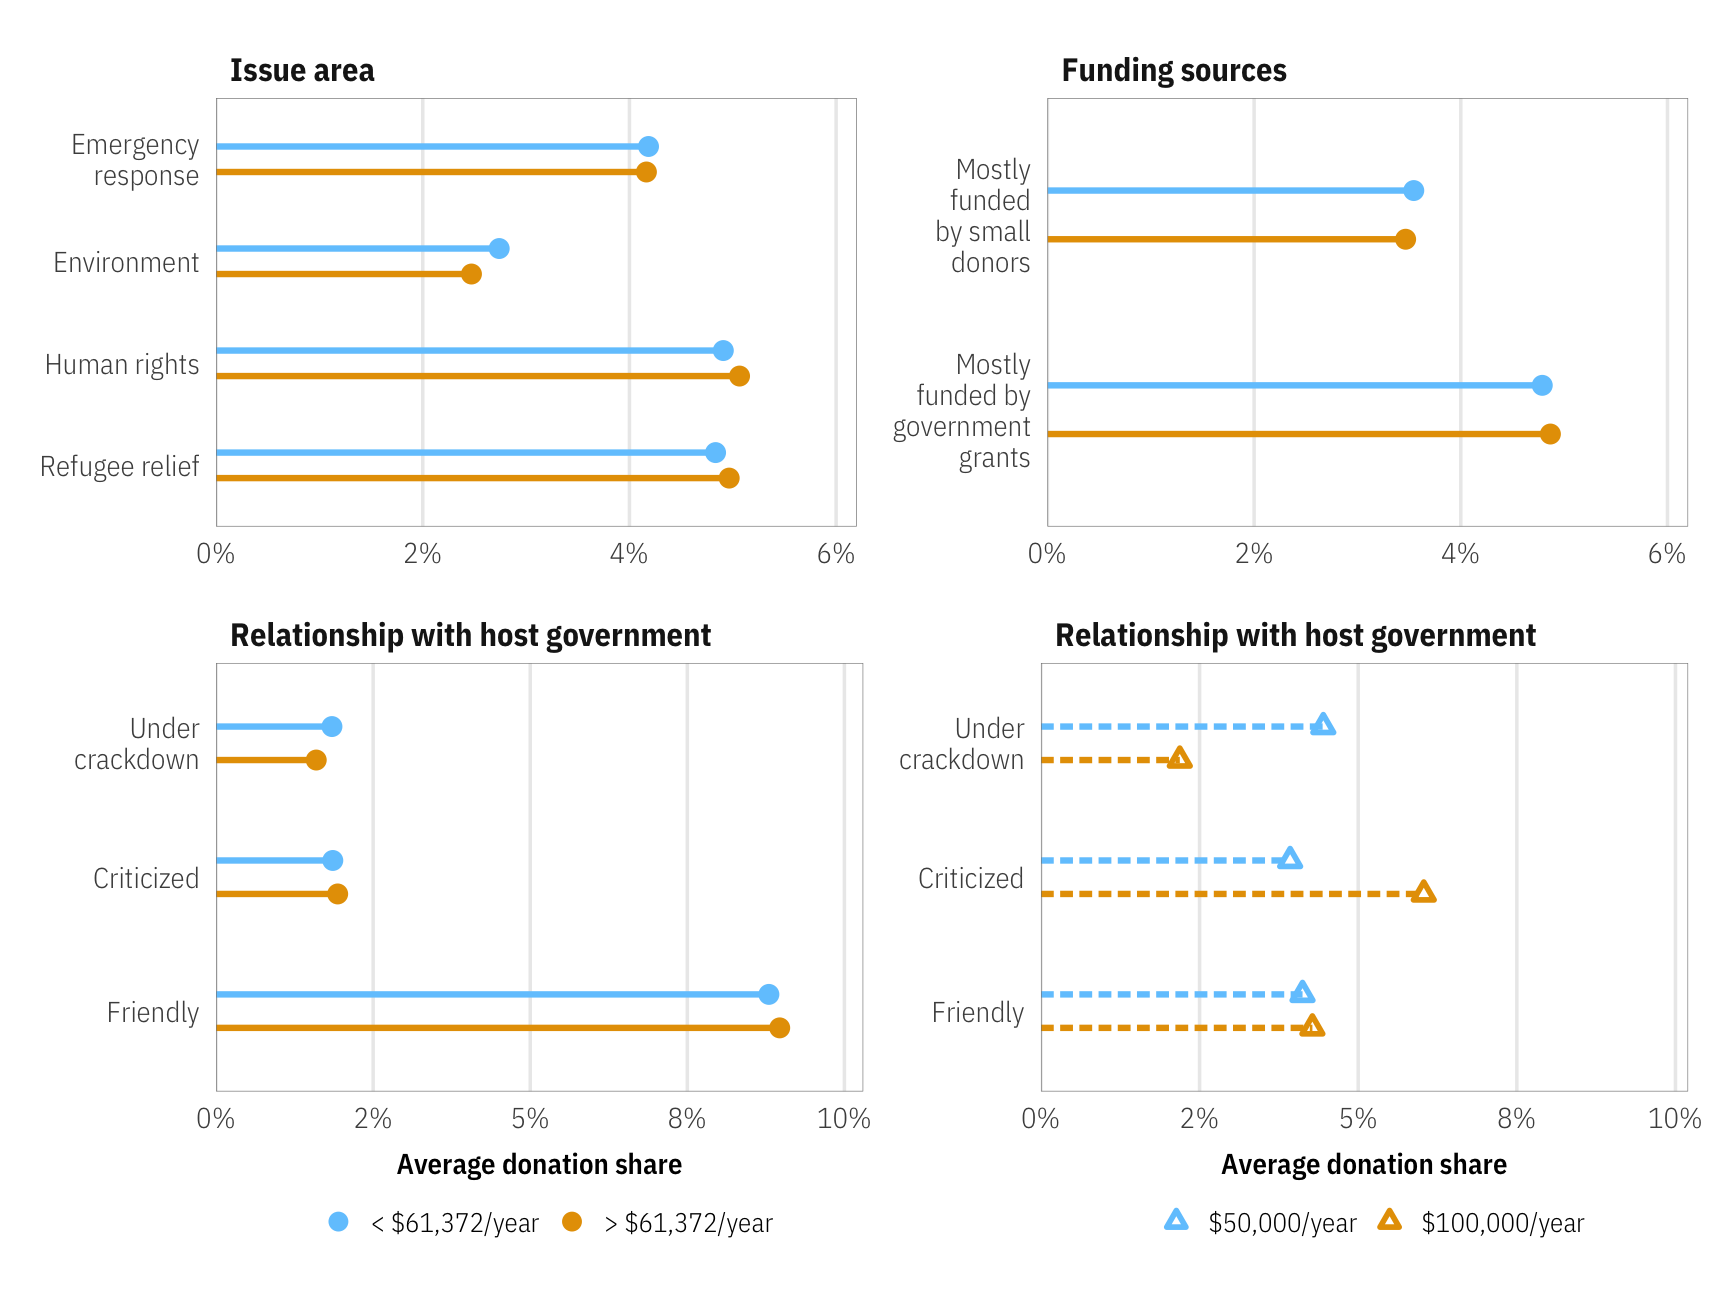
Education across issue area, funding, and relationship
plot_education_issue <- sim_final %>%
  group_by(org_issue, persona_education) %>%
  summarize(avg_share = mean(share)) %>%
  mutate(facet = "Issue area") %>%
  ggplot(aes(y = fct_rev(str_wrap_factor(org_issue, 15)),
             x = avg_share, color = fct_rev(persona_education))) +
  geom_pointrange(size = 0.75, fatten = 1.5,
                  aes(xmin = 0, xmax = ..x..), position = position_dodge(width = 0.5)) +
  scale_x_continuous(labels = percent_format(accuracy = 1), expand = expansion(add = c(0, 0.002))) +
  coord_cartesian(xlim = c(0, 0.06)) +
  scale_color_manual(values = clrs_ngo_pairs[[2]], guide = FALSE) +
  labs(x = "Average donation share", y = NULL, color = NULL) +
  facet_wrap(vars(facet)) +
  theme_ngo() +
  theme(panel.grid.major.y = element_blank())

plot_education_funding <- sim_final %>%
  group_by(org_funding, persona_education) %>%
  summarize(avg_share = mean(share)) %>%
  mutate(facet = "Funding sources") %>%
  ggplot(aes(y = fct_rev(str_wrap_factor(org_funding, 10)),
             x = avg_share, color = fct_rev(persona_education))) +
  geom_pointrange(size = 0.75, fatten = 1.5,
                  aes(xmin = 0, xmax = ..x..), position = position_dodge(width = 0.5)) +
  scale_x_continuous(labels = percent_format(accuracy = 1), expand = expansion(add = c(0, 0.002))) +
  coord_cartesian(xlim = c(0, 0.06)) +
  scale_color_manual(values = clrs_ngo_pairs[[2]], guide = FALSE) +
  labs(x = "Average donation share", y = NULL, color = NULL) +
  facet_wrap(vars(facet)) +
  theme_ngo() +
  theme(panel.grid.major.y = element_blank())

plot_education_relationship <- sim_final %>%
  group_by(org_relationship, persona_education) %>%
  summarize(avg_share = mean(share)) %>%
  mutate(facet = "Relationship with host government") %>%
  ggplot(aes(y = fct_rev(str_wrap_factor(org_relationship, 10)),
             x = avg_share, color = fct_rev(persona_education))) +
  geom_pointrange(size = 0.75, fatten = 1.5,
                  aes(xmin = 0, xmax = ..x..), position = position_dodge(width = 0.5)) +
  scale_x_continuous(labels = percent_format(accuracy = 1), expand = expansion(add = c(0, 0.002))) +
  coord_cartesian(xlim = c(0, 0.1)) +
  scale_color_manual(values = clrs_ngo_pairs[[2]],
                     guide = guide_legend(reverse = TRUE, ncol = 1,
                                          override.aes = list(size = 0.25,
                                                              linetype = 0)),
                     labels = label_wrap(15)) +
  labs(x = "Average donation share", y = NULL, color = NULL) +
  facet_wrap(vars(str_wrap(facet, 20))) +
  theme_ngo() +
  theme(panel.grid.major.y = element_blank(),
        legend.key.width = unit(0.5, "lines"))

plot_education <- plot_education_issue + plot_education_funding +
  plot_education_relationship + guide_area() +
  plot_layout(guides = "collect", ncol = 4)
plot_education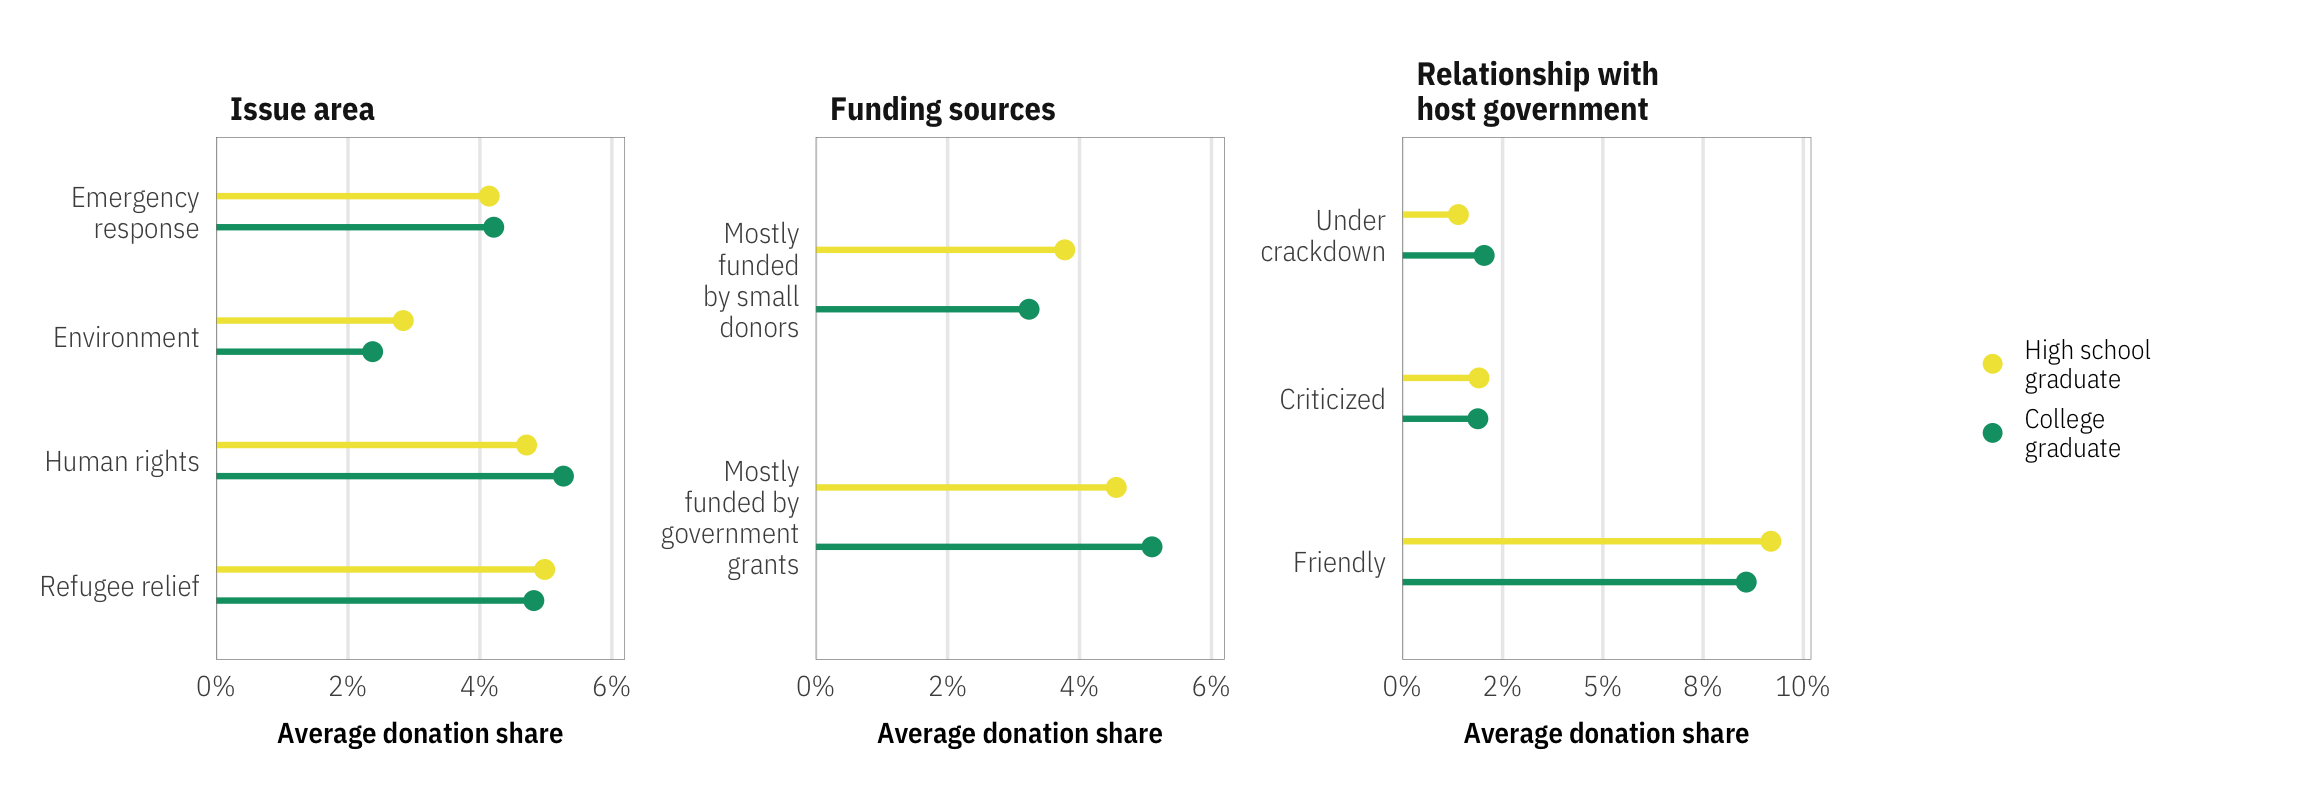
Religiosity across issue area, funding, and relationship
plot_religion_issue <- sim_final %>%
  group_by(org_issue, persona_religion) %>%
  summarize(avg_share = mean(share)) %>%
  mutate(facet = "Issue area") %>%
  ggplot(aes(y = fct_rev(str_wrap_factor(org_issue, 15)),
             x = avg_share, color = fct_rev(persona_religion))) +
  geom_pointrange(size = 0.75, fatten = 1.5, pch = 17,
                  aes(xmin = 0, xmax = ..x..), position = position_dodge(width = 0.5)) +
  scale_x_continuous(labels = percent_format(accuracy = 1), expand = expansion(add = c(0, 0.002))) +
  coord_cartesian(xlim = c(0, 0.06)) +
  scale_color_manual(values = clrs_ngo_pairs[[4]], guide = FALSE) +
  labs(x = "Average donation share", y = NULL, color = NULL) +
  facet_wrap(vars(facet)) +
  theme_ngo() +
  theme(panel.grid.major.y = element_blank())

plot_religion_funding <- sim_final %>%
  group_by(org_funding, persona_religion) %>%
  summarize(avg_share = mean(share)) %>%
  mutate(facet = "Funding sources") %>%
  ggplot(aes(y = fct_rev(str_wrap_factor(org_funding, 10)),
             x = avg_share, color = fct_rev(persona_religion))) +
  geom_pointrange(size = 0.75, fatten = 1.5, pch = 17,
                  aes(xmin = 0, xmax = ..x..), position = position_dodge(width = 0.5)) +
  scale_x_continuous(labels = percent_format(accuracy = 1), expand = expansion(add = c(0, 0.002))) +
  coord_cartesian(xlim = c(0, 0.06)) +
  scale_color_manual(values = clrs_ngo_pairs[[4]], guide = FALSE) +
  labs(x = "Average donation share", y = NULL, color = NULL) +
  facet_wrap(vars(facet)) +
  theme_ngo() +
  theme(panel.grid.major.y = element_blank())

plot_religion_relationship <- sim_final %>%
  group_by(org_relationship, persona_religion) %>%
  summarize(avg_share = mean(share)) %>%
  mutate(facet = "Relationship with host government") %>%
  ggplot(aes(y = fct_rev(str_wrap_factor(org_relationship, 10)),
             x = avg_share, color = fct_rev(persona_religion))) +
  geom_pointrange(size = 0.75, fatten = 1.5, pch = 17,
                  aes(xmin = 0, xmax = ..x..), position = position_dodge(width = 0.5)) +
  scale_x_continuous(labels = percent_format(accuracy = 1), expand = expansion(add = c(0, 0.002))) +
  coord_cartesian(xlim = c(0, 0.1)) +
  scale_color_manual(values = clrs_ngo_pairs[[4]],
                     guide = guide_legend(reverse = TRUE, ncol = 1,
                                          override.aes = list(size = 0.25,
                                                              linetype = 0)),
                     labels = label_wrap(20)) +
  labs(x = "Average donation share", y = NULL, color = NULL) +
  facet_wrap(vars(str_wrap(facet, 20))) +
  theme_ngo() +
  theme(panel.grid.major.y = element_blank(),
        legend.key.width = unit(0.5, "lines"))

plot_religion <- plot_religion_issue + plot_religion_funding +
  plot_religion_relationship + guide_area() +
  plot_layout(guides = "collect", ncol = 4)
plot_religion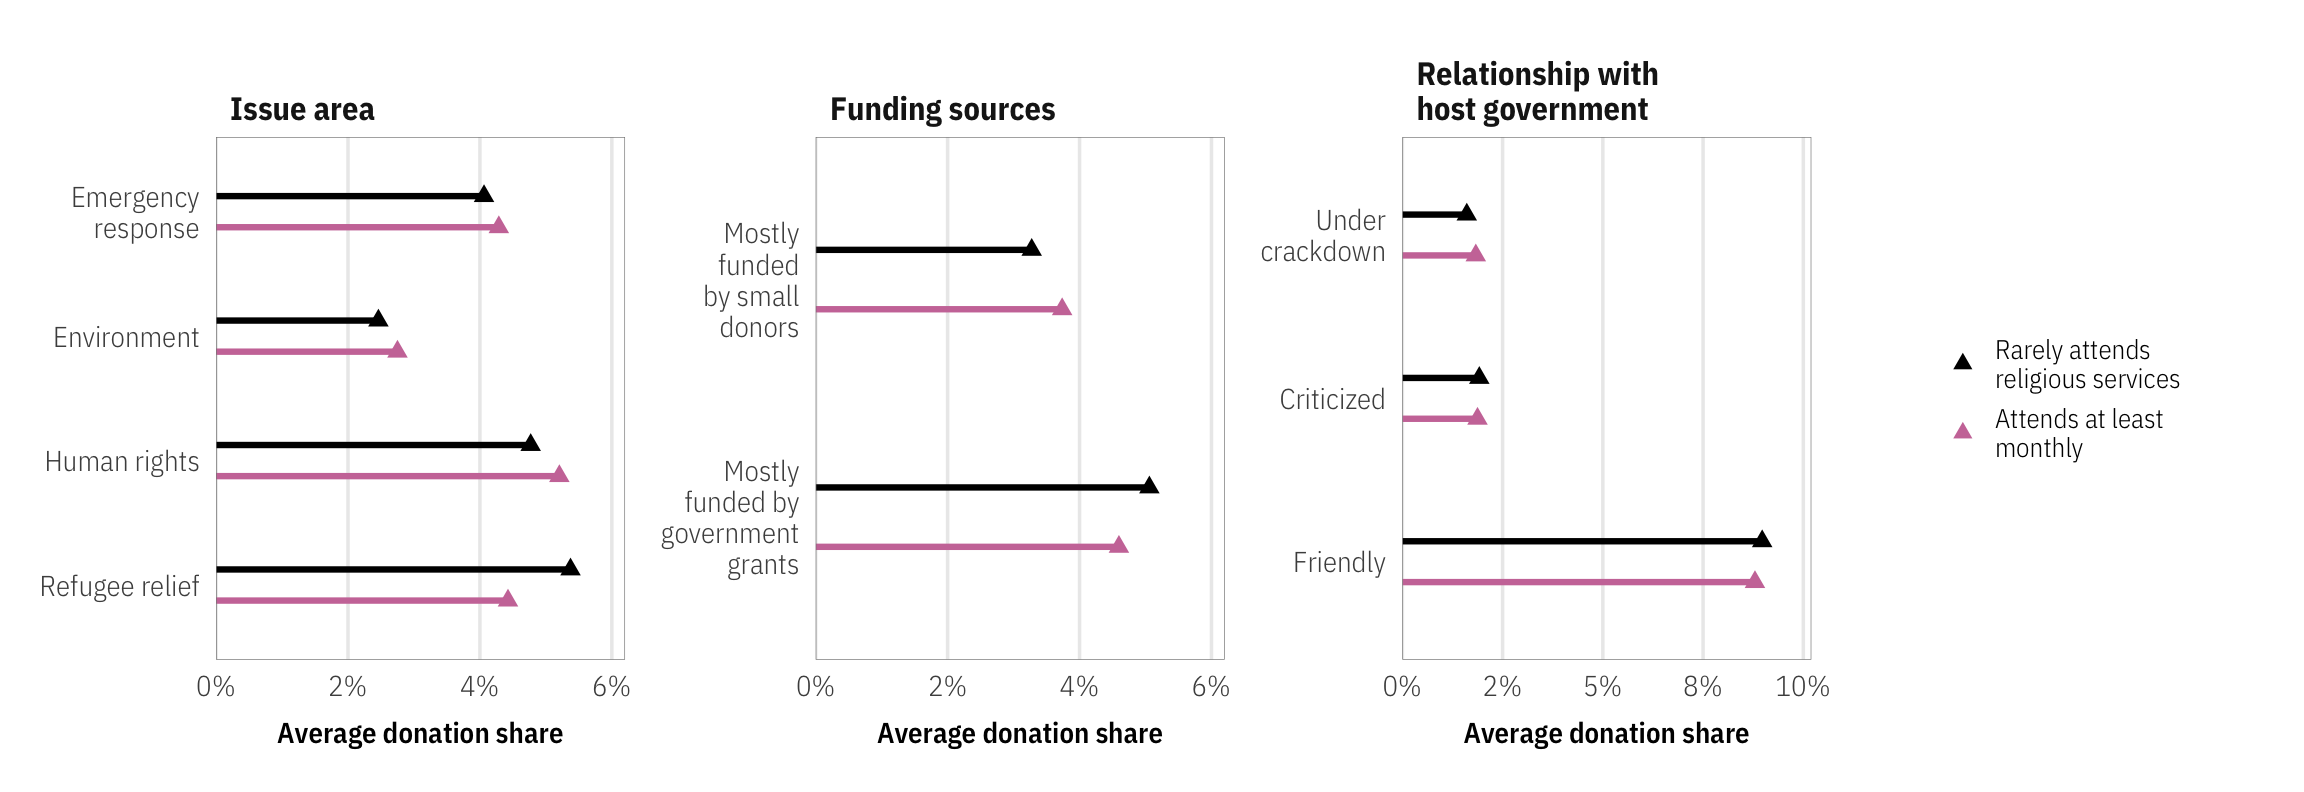
Education and religion across issue area, funding, and relationship
plot_education_religion <- (plot_education_issue + labs(x = NULL)) +
  (plot_education_funding + labs(x = NULL)) +
  (plot_education_relationship + labs(x = NULL)) +
  guide_area() +
  plot_religion_issue +
  plot_religion_funding +
  plot_religion_relationship +
  plot_layout(guides = "collect", ncol = 4)

plot_education_religion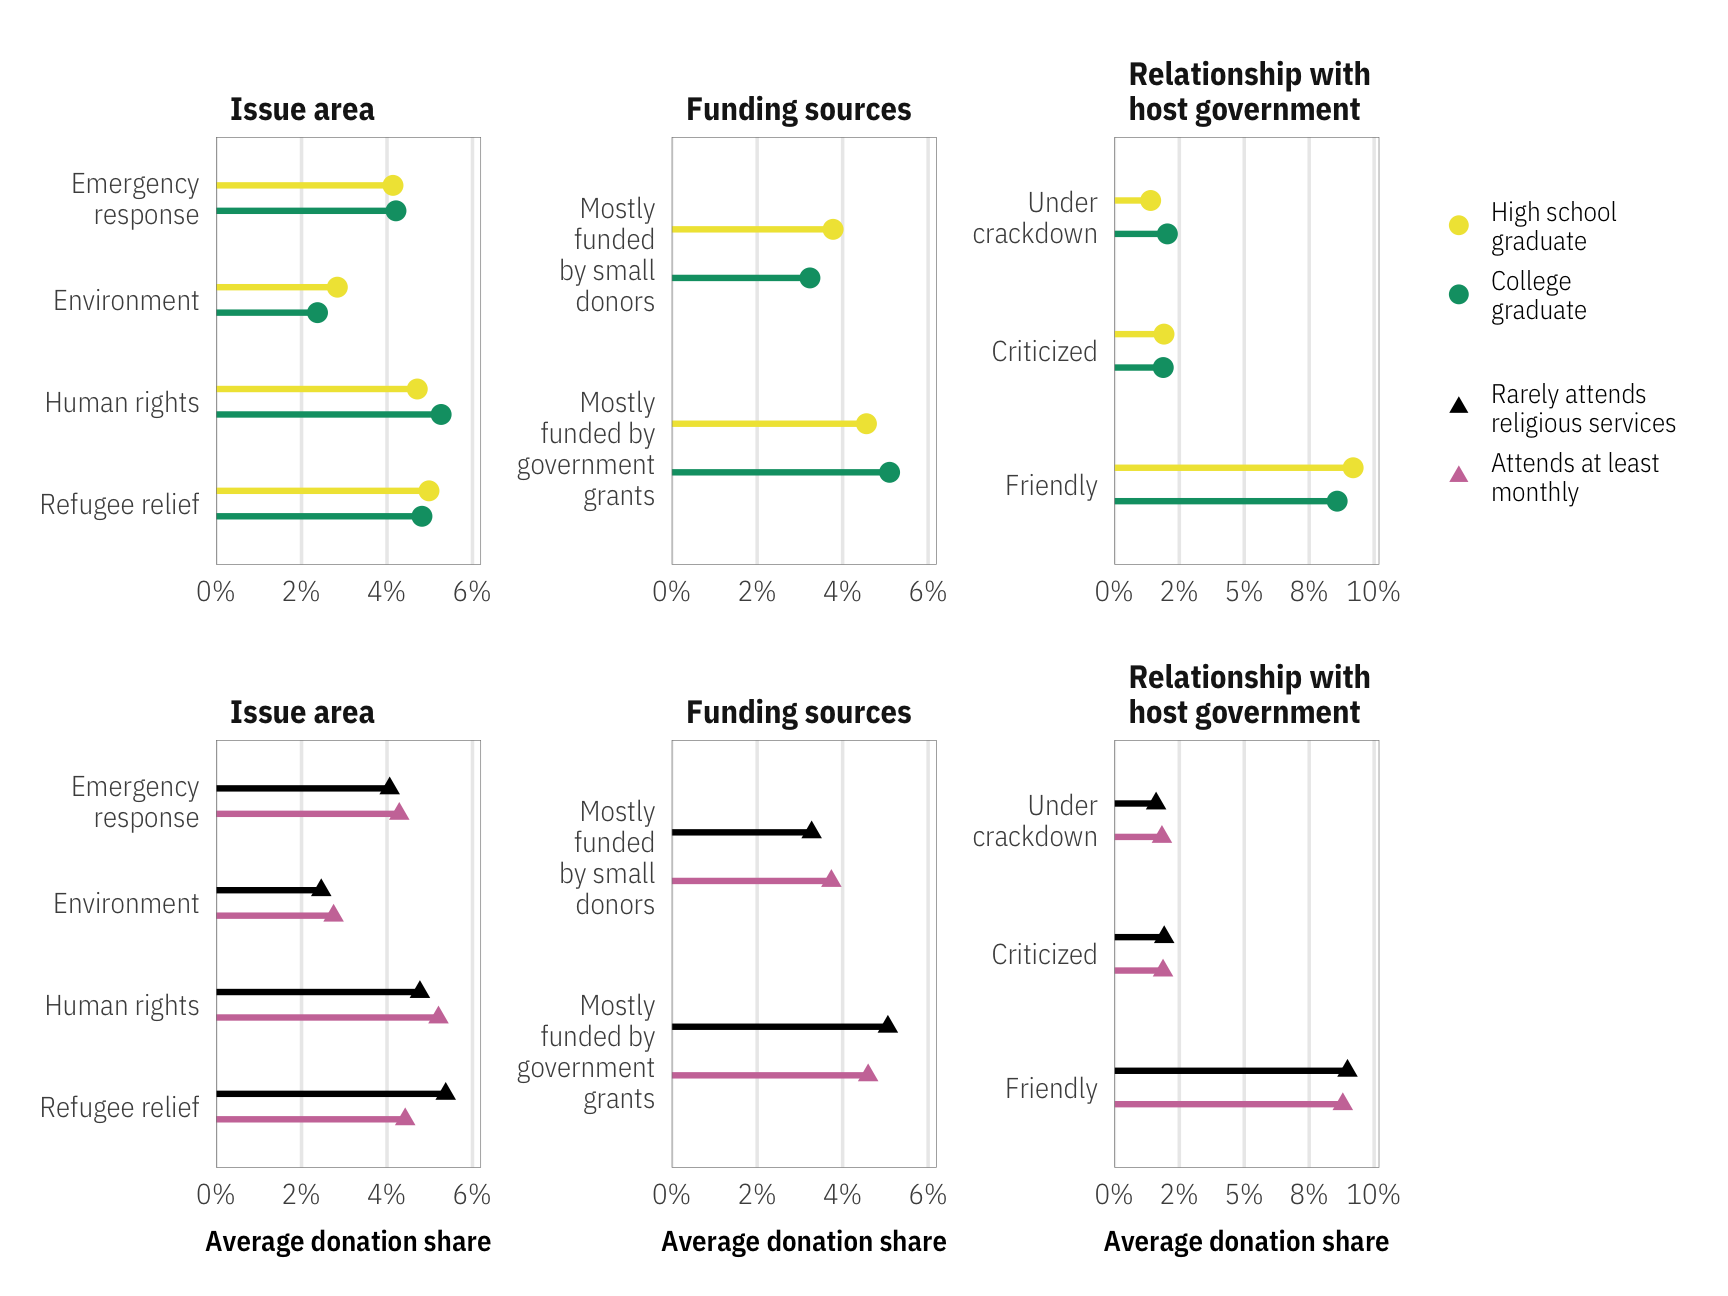
Social trust across relationship
plot_relationship_social <- sim_final %>%
  group_by(org_relationship, persona_trust, persona_ideology, persona_experience) %>%
  summarize(avg_share = mean(share)) %>%
  ggplot(aes(y = fct_rev(str_wrap_factor(org_relationship, 10)),
             x = avg_share, color = persona_trust)) +
  geom_pointrange(size = 0.75, fatten = 1.5,
                  aes(xmin = 0, xmax = ..x..), position = position_dodge(width = 0.5)) +
  scale_x_continuous(labels = percent_format(accuracy = 1), expand = expansion(add = c(0, 0.002))) +
  scale_color_manual(values = clrs_ngo_pairs[[3]],
                     guide = guide_legend(reverse = TRUE,
                                          override.aes = list(size = 0.25,
                                                              linetype = 0))) +
  labs(x = "Average share of donations", y = NULL, color = NULL) +
  facet_grid(rows = vars(persona_ideology), cols = vars(str_wrap(persona_experience, 100))) +
  theme_ngo() +
  theme(panel.grid.major.y = element_blank(),
        legend.key.width = unit(0.5, "lines"))

plot_relationship_social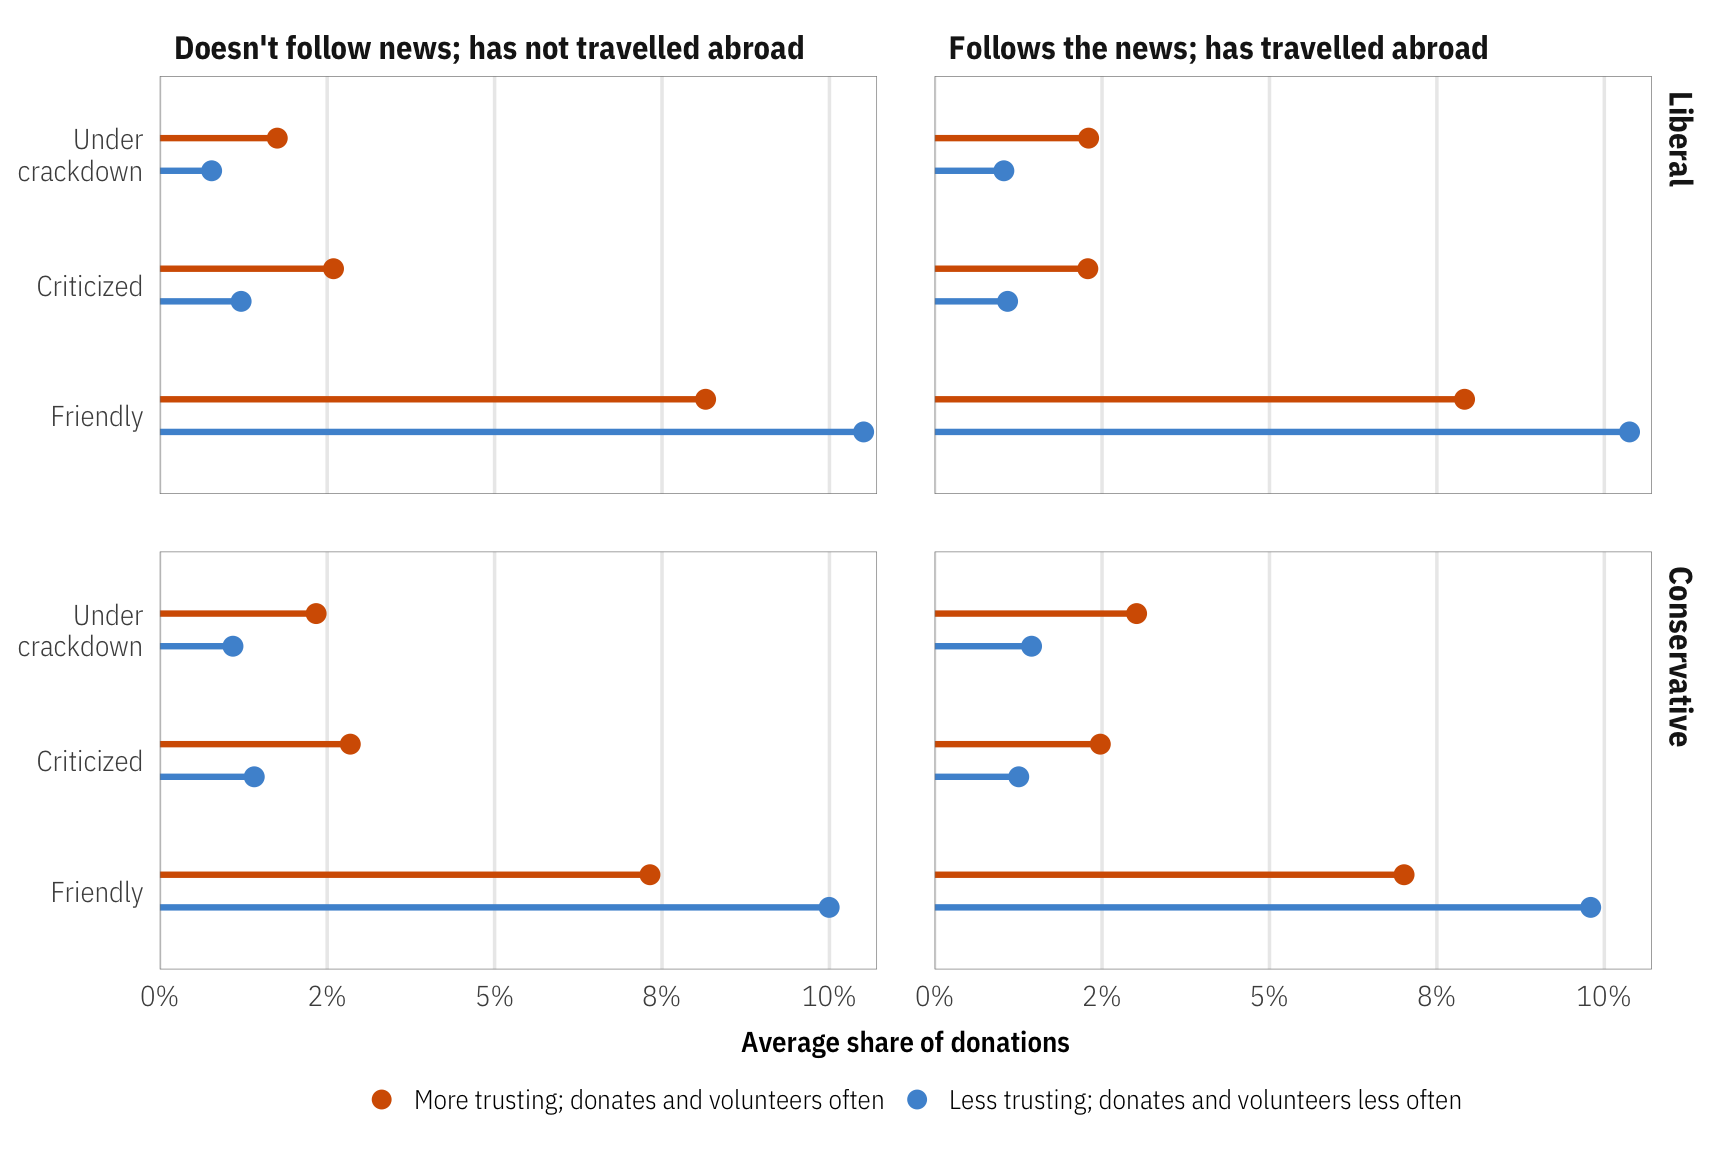
Social trust across funding
plot_funding_social <- sim_final %>%
  group_by(org_funding, persona_trust, persona_ideology, persona_experience) %>%
  summarize(avg_share = mean(share)) %>%
  ggplot(aes(y = fct_rev(str_wrap_factor(org_funding, 15)),
             x = avg_share, color = persona_trust)) +
  geom_pointrange(size = 0.75, fatten = 1.5,
                  aes(xmin = 0, xmax = ..x..), position = position_dodge(width = 0.5)) +
  scale_x_continuous(labels = percent_format(accuracy = 1), expand = expansion(add = c(0, 0.002))) +
  scale_color_manual(values = clrs_ngo_pairs[[3]],
                     guide = guide_legend(reverse = TRUE,
                                          override.aes = list(size = 0.25,
                                                              linetype = 0))) +
  labs(x = "Average share of donations", y = NULL, color = NULL) +
  facet_grid(rows = vars(persona_ideology), cols = vars(str_wrap(persona_experience, 100))) +
  theme_ngo() +
  theme(panel.grid.major.y = element_blank(),
        legend.key.width = unit(0.5, "lines"))

plot_funding_social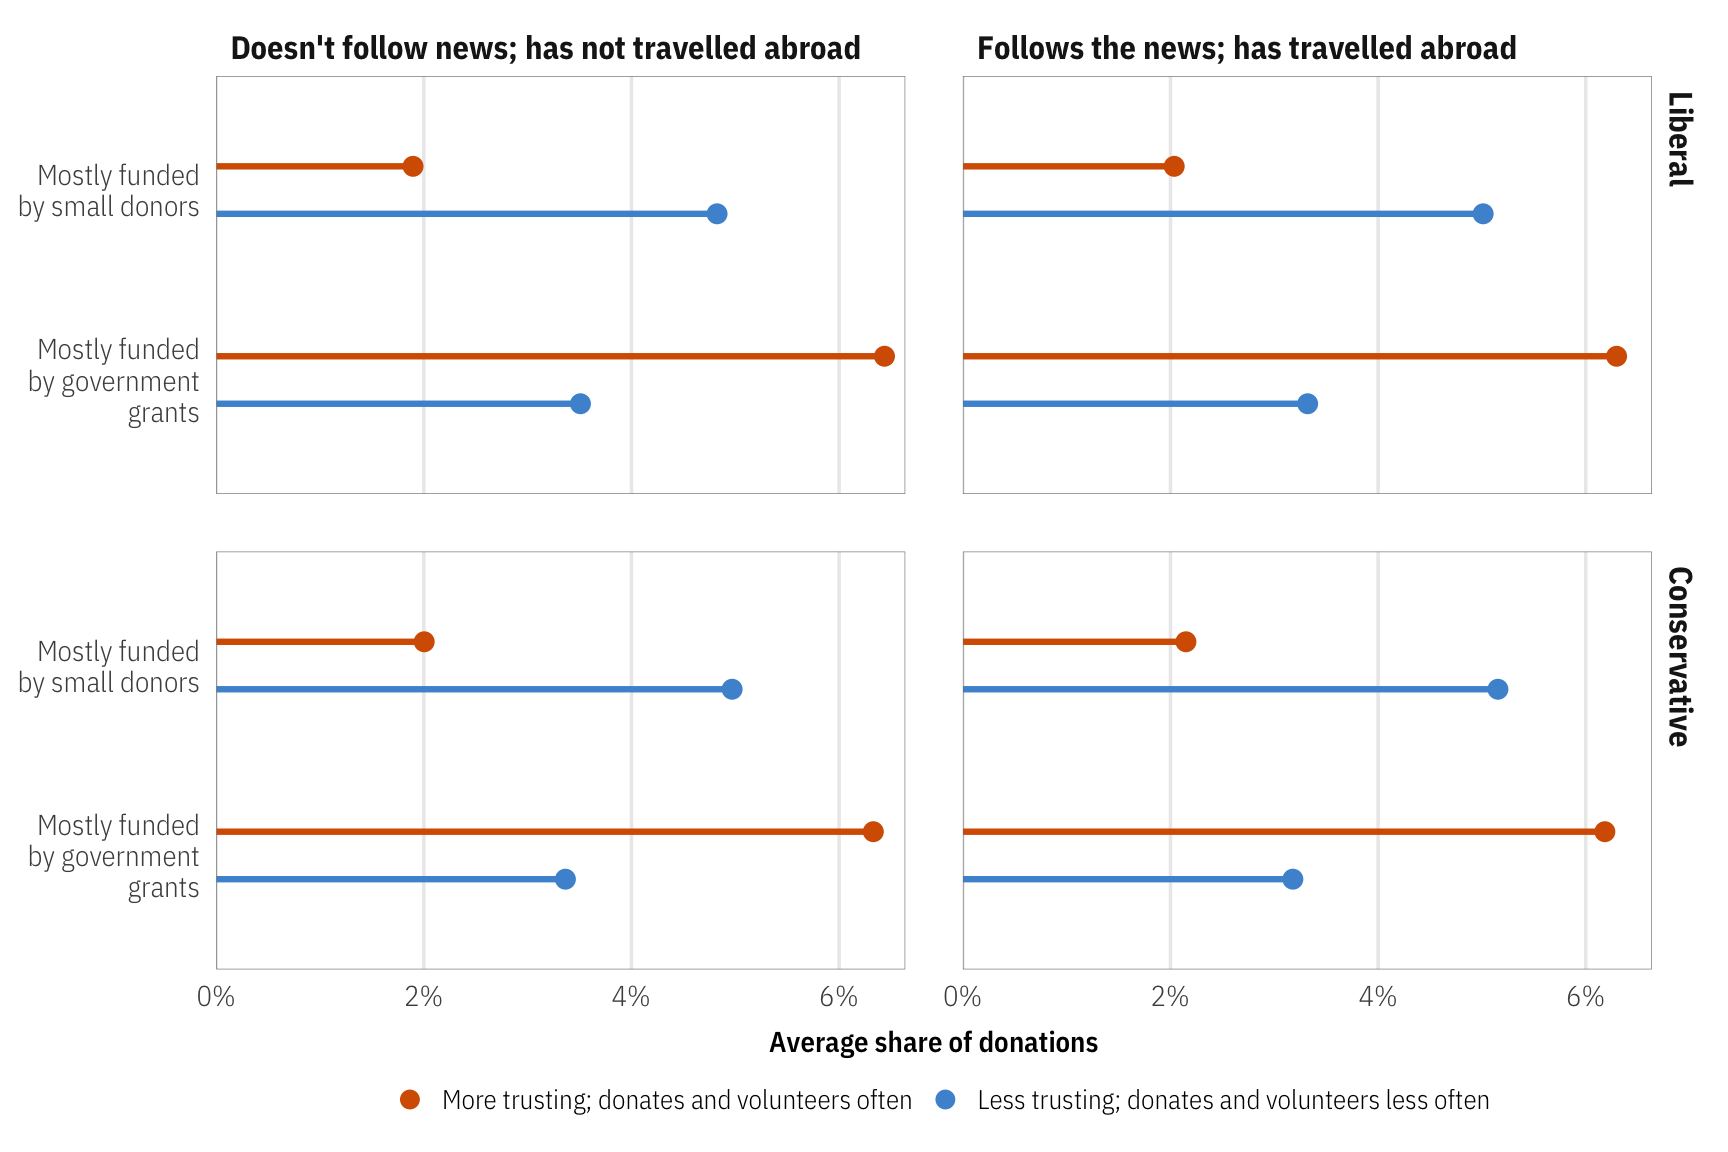
Original computing environment
devtools::session_info()## ─ Session info ─────────────────────────────────────────────────────────────────────────
## setting value
## version R version 4.0.3 (2020-10-10)
## os macOS Big Sur 10.16
## system x86_64, darwin17.0
## ui X11
## language (EN)
## collate en_US.UTF-8
## ctype en_US.UTF-8
## tz America/New_York
## date 2021-04-21
##
## ─ Packages ─────────────────────────────────────────────────────────────────────────────
## ! package * version date lib source
## P assertthat 0.2.1 2019-03-21 [?] CRAN (R 4.0.0)
## P backports 1.2.1 2020-12-09 [?] CRAN (R 4.0.2)
## P broom 0.7.5 2021-02-19 [?] CRAN (R 4.0.2)
## P bslib 0.2.4 2021-01-25 [?] CRAN (R 4.0.2)
## P cachem 1.0.4 2021-02-13 [?] CRAN (R 4.0.2)
## callr 3.6.0 2021-03-28 [1] CRAN (R 4.0.2)
## P cellranger 1.1.0 2016-07-27 [?] CRAN (R 4.0.0)
## cli 2.4.0 2021-04-05 [1] CRAN (R 4.0.2)
## P codetools 0.2-18 2020-11-04 [?] CRAN (R 4.0.2)
## P colorspace 2.0-0 2020-11-11 [?] CRAN (R 4.0.2)
## P crayon 1.4.1 2021-02-08 [?] CRAN (R 4.0.2)
## P data.table 1.14.0 2021-02-21 [?] CRAN (R 4.0.2)
## P DBI 1.1.1 2021-01-15 [?] CRAN (R 4.0.2)
## P dbplyr 2.1.0 2021-02-03 [?] CRAN (R 4.0.2)
## P desc 1.3.0 2021-03-05 [?] CRAN (R 4.0.2)
## devtools 2.4.0 2021-04-07 [1] CRAN (R 4.0.2)
## P digest 0.6.27 2020-10-24 [?] CRAN (R 4.0.2)
## P dplyr * 1.0.5 2021-03-05 [?] CRAN (R 4.0.2)
## P ellipsis 0.3.1 2020-05-15 [?] CRAN (R 4.0.0)
## P evaluate 0.14 2019-05-28 [?] CRAN (R 4.0.0)
## P fansi 0.4.2 2021-01-15 [?] CRAN (R 4.0.2)
## P farver 2.1.0 2021-02-28 [?] CRAN (R 4.0.2)
## P fastmap 1.1.0 2021-01-25 [?] CRAN (R 4.0.2)
## P forcats * 0.5.1 2021-01-27 [?] CRAN (R 4.0.2)
## P fs 1.5.0 2020-07-31 [?] CRAN (R 4.0.2)
## P generics 0.1.0 2020-10-31 [?] CRAN (R 4.0.2)
## P ggplot2 * 3.3.3 2020-12-30 [?] CRAN (R 4.0.2)
## P glue 1.4.2 2020-08-27 [?] CRAN (R 4.0.2)
## P gtable 0.3.0 2019-03-25 [?] CRAN (R 4.0.0)
## P haven 2.3.1 2020-06-01 [?] CRAN (R 4.0.2)
## P here * 1.0.1 2020-12-13 [?] CRAN (R 4.0.2)
## P highr 0.8 2019-03-20 [?] CRAN (R 4.0.0)
## P hms 1.0.0 2021-01-13 [?] CRAN (R 4.0.2)
## P htmltools 0.5.1.1 2021-01-22 [?] CRAN (R 4.0.2)
## P httr 1.4.2 2020-07-20 [?] CRAN (R 4.0.2)
## P igraph 1.2.6 2020-10-06 [?] CRAN (R 4.0.2)
## P jquerylib 0.1.3 2020-12-17 [?] CRAN (R 4.0.2)
## P jsonlite 1.7.2 2020-12-09 [?] CRAN (R 4.0.2)
## P knitr 1.31 2021-01-27 [?] CRAN (R 4.0.2)
## P labeling 0.4.2 2020-10-20 [?] CRAN (R 4.0.2)
## P lifecycle 1.0.0 2021-02-15 [?] CRAN (R 4.0.2)
## P lubridate 1.7.10 2021-02-26 [?] CRAN (R 4.0.2)
## P magrittr 2.0.1 2020-11-17 [?] CRAN (R 4.0.2)
## P memoise 2.0.0 2021-01-26 [?] CRAN (R 4.0.2)
## P modelr 0.1.8 2020-05-19 [?] CRAN (R 4.0.2)
## P munsell 0.5.0 2018-06-12 [?] CRAN (R 4.0.0)
## P patchwork * 1.1.1 2020-12-17 [?] CRAN (R 4.0.2)
## P pillar 1.5.1 2021-03-05 [?] CRAN (R 4.0.2)
## P pkgbuild 1.2.0 2020-12-15 [?] CRAN (R 4.0.2)
## P pkgconfig 2.0.3 2019-09-22 [?] CRAN (R 4.0.0)
## pkgload 1.2.1 2021-04-06 [1] CRAN (R 4.0.2)
## P prettyunits 1.1.1 2020-01-24 [?] CRAN (R 4.0.0)
## P processx 3.5.1 2021-04-04 [?] CRAN (R 4.0.2)
## P ps 1.6.0 2021-02-28 [?] CRAN (R 4.0.2)
## P purrr * 0.3.4 2020-04-17 [?] CRAN (R 4.0.0)
## P R6 2.5.0 2020-10-28 [?] CRAN (R 4.0.2)
## P Rcpp 1.0.6 2021-01-15 [?] CRAN (R 4.0.2)
## P readr * 1.4.0 2020-10-05 [?] CRAN (R 4.0.2)
## P readxl 1.3.1 2019-03-13 [?] CRAN (R 4.0.0)
## remotes 2.3.0 2021-04-01 [1] CRAN (R 4.0.2)
## renv 0.13.0 2021-02-24 [1] CRAN (R 4.0.2)
## P reprex 1.0.0 2021-01-27 [?] CRAN (R 4.0.2)
## P rlang 0.4.10 2020-12-30 [?] CRAN (R 4.0.2)
## P rmarkdown 2.7 2021-02-19 [?] CRAN (R 4.0.2)
## P rprojroot 2.0.2 2020-11-15 [?] CRAN (R 4.0.2)
## P rstudioapi 0.13 2020-11-12 [?] CRAN (R 4.0.2)
## P rvest 1.0.0 2021-03-09 [?] CRAN (R 4.0.2)
## P sass 0.3.1 2021-01-24 [?] CRAN (R 4.0.2)
## P scales * 1.1.1 2020-05-11 [?] CRAN (R 4.0.0)
## P sessioninfo 1.1.1 2018-11-05 [?] CRAN (R 4.0.0)
## P stringi 1.5.3 2020-09-09 [?] CRAN (R 4.0.2)
## P stringr * 1.4.0 2019-02-10 [?] CRAN (R 4.0.0)
## P targets * 0.2.0 2021-02-27 [?] CRAN (R 4.0.2)
## P testthat 3.0.2 2021-02-14 [?] CRAN (R 4.0.2)
## P tibble * 3.1.0 2021-02-25 [?] CRAN (R 4.0.2)
## P tidyr * 1.1.3 2021-03-03 [?] CRAN (R 4.0.2)
## P tidyselect 1.1.0 2020-05-11 [?] CRAN (R 4.0.0)
## P tidyverse * 1.3.0 2019-11-21 [?] CRAN (R 4.0.0)
## P usethis 2.0.1 2021-02-10 [?] CRAN (R 4.0.2)
## P utf8 1.1.4 2018-05-24 [?] CRAN (R 4.0.0)
## P vctrs 0.3.7 2021-03-29 [?] CRAN (R 4.0.2)
## P withr 2.4.1 2021-01-26 [?] CRAN (R 4.0.2)
## P xfun 0.22 2021-03-11 [?] CRAN (R 4.0.2)
## P xml2 1.3.2 2020-04-23 [?] CRAN (R 4.0.0)
## P yaml 2.2.1 2020-02-01 [?] CRAN (R 4.0.0)
##
## [1] /Users/andrew/Dropbox (Personal)/Research collaboration/Global policy special issue/renv/library/R-4.0/x86_64-apple-darwin17.0
## [2] /private/var/folders/4d/ynkkj1nj0yj0lt91mkw2mq100000gn/T/Rtmp0tLEGE/renv-system-library
##
## P ── Loaded and on-disk path mismatch.writeLines(readLines(file.path(Sys.getenv("HOME"), ".R/Makevars")))## # http://dirk.eddelbuettel.com/blog/2017/11/27/#011_faster_package_installation_one
## VER=
## CCACHE=ccache
## CC=$(CCACHE) gcc$(VER)
## CXX=$(CCACHE) g++$(VER)
## CXX11=$(CCACHE) g++$(VER)
## CXX14=$(CCACHE) g++$(VER)
## FC=$(CCACHE) gfortran$(VER)
## F77=$(CCACHE) gfortran$(VER)
##
## CXX14FLAGS=-O3 -march=native -mtune=native -fPICLS0tCnRpdGxlOiAiQW5hbHlzaXMgYW5kIGZpZ3VyZXMiCmF1dGhvcjogIlN1cGFybmEgQ2hhdWRocnksIE1hcmMgRG90c29uLCBhbmQgQW5kcmV3IEhlaXNzIgpkYXRlOiAiTGFzdCBydW46IGByIGZvcm1hdChTeXMudGltZSgpLCAnJUYnKWAiCm91dHB1dDogCiAgaHRtbF9kb2N1bWVudDoKICAgIGNvZGVfZm9sZGluZzogaGlkZQogICAgcGFuZG9jX2FyZ3M6CiAgICAgIC0gIi0tZGVmYXVsdC1pbWFnZS1leHRlbnNpb249cG5nIgplZGl0b3Jfb3B0aW9uczogCiAgY2h1bmtfb3V0cHV0X3R5cGU6IGNvbnNvbGUKLS0tCgpgYGB7ciBzZXR1cCwgaW5jbHVkZT1GQUxTRX0Ka25pdHI6Om9wdHNfY2h1bmskc2V0KGZpZy5yZXRpbmEgPSAzLAogICAgICAgICAgICAgICAgICAgICAgdGlkeS5vcHRzID0gbGlzdCh3aWR0aC5jdXRvZmYgPSAxMjApLCAgIyBGb3IgY29kZQogICAgICAgICAgICAgICAgICAgICAgb3B0aW9ucyh3aWR0aCA9IDkwKSwgICMgRm9yIG91dHB1dAogICAgICAgICAgICAgICAgICAgICAgZmlnLmFzcCA9IDAuNjE4LCBmaWcud2lkdGggPSA3LCAKICAgICAgICAgICAgICAgICAgICAgIGZpZy5hbGlnbiA9ICJjZW50ZXIiLCBvdXQud2lkdGggPSAiODUlIikKCm9wdGlvbnMoZHBseXIuc3VtbWFyaXNlLmluZm9ybSA9IEZBTFNFLAogICAgICAgIGtuaXRyLmthYmxlLk5BID0gIiIpCmBgYAoKYGBge3IgbG9hZC1saWJyYXJpZXMtZGF0YSwgbWVzc2FnZT1GQUxTRSwgd2FybmluZz1GQUxTRX0KbGlicmFyeSh0aWR5dmVyc2UpCmxpYnJhcnkodGFyZ2V0cykKbGlicmFyeShzY2FsZXMpCmxpYnJhcnkocGF0Y2h3b3JrKQpsaWJyYXJ5KGhlcmUpCgojIEdlbmVyYXRlZCB2aWEgcmFuZG9tLm9yZwpzZXQuc2VlZCg4MzE2KQoKIyBMb2FkIGRhdGEKIyBOZWVkIHRvIHVzZSB0aGlzIHdpdGhyIHRoaW5nIGJlY2F1c2UgdGFyX3JlYWQoKSBhbmQgdGFyX2xvYWQoKSBuZWVkIHRvIHNlZSB0aGUKIyBfdGFyZ2V0cyBmb2xkZXIgaW4gdGhlIGN1cnJlbnQgZGlyZWN0b3J5LCBidXQgdGhpcyAuUm1kIGZpbGUgaXMgaW4gYSBzdWJmb2xkZXIKd2l0aHI6OndpdGhfZGlyKGhlcmU6OmhlcmUoKSwgewogIHNvdXJjZSh0YXJfcmVhZChwbG90X2Z1bnMpKQogIAogIHRhcl9sb2FkKHN1cnZleV9yZXN1bHRzKQogIHRhcl9sb2FkKHNpbV9leGNlbF9maW5hbCkKICB0YXJfbG9hZChzaW1fZmluYWwpCiAgdGFyX2xvYWQoZ2l2aW5nX2FnZ3JlZ2F0ZSkKICB0YXJfbG9hZChnaXZpbmdfcGVyX2NhcGl0YSkKfSkKYGBgCgojIEdlbmVyYWwgZGVtb2dyYXBoaWNzIG9mIHJlY2lwaWVudHMKCiMjIFJlbGlnaW9uCgpgYGB7ciBwbG90LXJlbGlnaW9ufQpyZWxpZ2lvbl9sb29rdXAgPC0gdHJpYmJsZSgKICB+UTUuMTAsIH5yZWxpZ2lvbiwKICAxLCAiQ2F0aG9saWMiLAogIDIsICJQcm90ZXN0YW50IiwKICAzLCAiQ2hyaXN0aWFuIE9ydGhvZG94IiwKICA0LCAiSmV3aXNoIiwKICA1LCAiTXVzbGltIiwKICA2LCAiU2lraCIsCiAgNywgIkhpbmR1IiwKICA4LCAiQnVkZGhpc3QiLAogIDksICJBdGhlaXN0IiwKICAxMCwgIk90aGVyIgopCgpuX3Jlc3BvbmRlbnRzIDwtIG5yb3coc3VydmV5X3Jlc3VsdHMpCgpyZWxpZ2lvbnMgPC0gc3VydmV5X3Jlc3VsdHMgJT4lIAogIGNvdW50KFE1LjEwKSAlPiUgCiAgbGVmdF9qb2luKHJlbGlnaW9uX2xvb2t1cCwgYnkgPSAiUTUuMTAiKSAlPiUgCiAgYXJyYW5nZShuKSAlPiUgCiAgbXV0YXRlKHJlbGlnaW9uID0gZmN0X2lub3JkZXIocmVsaWdpb24pKSAlPiUgCiAgbXV0YXRlKHBlcmNlbnQgPSBuIC8gbl9yZXNwb25kZW50cykKCmdncGxvdChyZWxpZ2lvbnMsIGFlcyh4ID0gbiwgeSA9IHJlbGlnaW9uKSkgKwogIGdlb21fY29sKGZpbGwgPSBjbHJzX29rYWJlX2l0byRyZWRkaXNoX3B1cnBsZSkgKwogIHNjYWxlX3hfY29udGludW91cyhzZWMuYXhpcyA9IHNlY19heGlzKH4uIC8gbl9yZXNwb25kZW50cywgbGFiZWxzID0gcGVyY2VudCkpICsKICBsYWJzKHggPSAiTnVtYmVyIG9mIHJlc3BvbmRlbnRzIiwgeSA9IE5VTEwpICsKICB0aGVtZV9uZ28oKQpgYGAKCmBgYHtyIHJlbGlnaW9uLW90aGVyc30KcmVsaWdpb25fb3RoZXJzIDwtIHN1cnZleV9yZXN1bHRzICU+JSAKICBmaWx0ZXIoIWlzLm5hKFE1LjEwX1RFWFQpKSAlPiUgCiAgbXV0YXRlKFE1LjEwX1RFWFQgPSBzdHJfdG9fbG93ZXIoUTUuMTBfVEVYVCkpICU+JSAKICBjb3VudChRNS4xMF9URVhUKSAlPiUgCiAgYXJyYW5nZShkZXNjKG4pKQpyZWxpZ2lvbl9vdGhlcnMKYGBgCgojIEdlbmVyYWwgdHJlbmRzIGluIHByaXZhdGUgcGhpbGFudGhyb3B5CgpCYXNlZCBvbiBkYXRhIGZyb20gW0dpdmluZyBVU0FdKGh0dHBzOi8vdGhlY29udmVyc2F0aW9uLmNvbS9mZXdlci1hbWVyaWNhbnMtYXJlLWdpdmluZy1tb25leS10by1jaGFyaXR5LWJ1dC10b3RhbC1kb25hdGlvbnMtYXJlLWF0LXJlY29yZC1sZXZlbHMtYW55d2F5LTk4MjkxKSwgcGhpbGFudGhyb3B5IGluIHRoZSBVbml0ZWQgc3RhdGVzIGNvbnRpbnVlcyB0byBpbmNyZWFzZSwgYm90aCBpbiBhZ2dyZWdhdGUgYW5kIHBlciBjYXBpdGEuCgojIyBUb3RhbCBnaXZpbmcKCmBgYHtyIHBsb3QtdG90YWwtZ2l2aW5nLCBmaWcud2lkdGg9NCwgZmlnLmhlaWdodD0yLjQsIGZpZy5hc3A9TlVMTCwgb3V0LndpZHRoPSI2MCUifQpnZ3Bsb3QoZ2l2aW5nX2FnZ3JlZ2F0ZSwgYWVzKHggPSBZZWFyLCB5ID0gYFRvdGFsIGRvbmF0aW9uc2ApKSArCiAgZ2VvbV9saW5lKHNpemUgPSAxLCBjb2xvciA9IGNscnNfb2thYmVfaXRvJG9yYW5nZSkgKwogIHNjYWxlX3hfY29udGludW91cyhicmVha3MgPSBzZXEoMTk4MCwgMjAxNSwgNSkpICsKICBzY2FsZV95X2NvbnRpbnVvdXMobGFiZWxzID0gZG9sbGFyLCBicmVha3MgPSBzZXEoMTAwLCA0NTAsIDUwKSkgKyAKICBjb29yZF9jYXJ0ZXNpYW4oeWxpbSA9IGMoMTAwLCA0NTApKSArCiAgbGFicyh4ID0gTlVMTCwgeSA9ICJCaWxsaW9ucyBvZiBkb2xsYXJzIikgKyAKICB0aGVtZV9uZ28oKQpgYGAKCiMjIEF2ZXJhZ2UgcGVyIGNhcGl0YSBnaXZpbmcKCmBgYHtyIHBsb3QtcGVyLWNhcGl0YS1naXZpbmcsIGZpZy53aWR0aD00LCBmaWcuaGVpZ2h0PTIuNCwgZmlnLmFzcD1OVUxMLCBvdXQud2lkdGg9IjYwJSJ9CmdncGxvdChnaXZpbmdfcGVyX2NhcGl0YSwgYWVzKHggPSBZZWFyLCB5ID0gYEF2ZXJhZ2UgZ2l2aW5nYCkpICsKICBnZW9tX2xpbmUoc2l6ZSA9IDEsIGNvbG9yID0gY2xyc19va2FiZV9pdG8kc2t5X2JsdWUpICsKICBzY2FsZV94X2NvbnRpbnVvdXMoYnJlYWtzID0gc2VxKDIwMDAsIDIwMTQsIDIpKSArCiAgc2NhbGVfeV9jb250aW51b3VzKGxhYmVscyA9IGRvbGxhciwgYnJlYWtzID0gc2VxKDE3NTAsIDI3NTAsIDI1MCkpICsgCiAgY29vcmRfY2FydGVzaWFuKHlsaW0gPSBjKDE3NTAsIDI3NTApKSArCiAgbGFicyh4ID0gTlVMTCwgeSA9ICJBdmVyYWdlIGFubnVhbCBkb25hdGlvbiIpICsgCiAgdGhlbWVfbmdvKCkKYGBgCgoKIyBTaW11bGF0aW9ucwoKIyMgSW5jb21lIGFjcm9zcyBpc3N1ZSBhcmVhLCBmdW5kaW5nLCBhbmQgcmVsYXRpb25zaGlwCgpgYGB7ciBpbmNvbWUtaXNzdWUtZnVuZGluZy1yZWxhdGlvbnNoaXAsIGZpZy53aWR0aD02LCBmaWcuaGVpZ2h0PTQuNSwgZmlnLmFzcD1OVUxMLCBvdXQud2lkdGg9IjEwMCUifQpwbG90X2luY29tZV9pc3N1ZSA8LSBzaW1fZmluYWwgJT4lIAogIGdyb3VwX2J5KG9yZ19pc3N1ZSwgcGVyc29uYV9pbmNvbWUpICU+JSAKICBzdW1tYXJpemUoYXZnX3NoYXJlID0gbWVhbihzaGFyZSkpICU+JSAKICBtdXRhdGUoZmFjZXQgPSAiSXNzdWUgYXJlYSIpICU+JSAKICBnZ3Bsb3QoYWVzKHkgPSBmY3RfcmV2KHN0cl93cmFwX2ZhY3RvcihvcmdfaXNzdWUsIDE1KSksCiAgICAgICAgICAgICB4ID0gYXZnX3NoYXJlLCBjb2xvciA9IGZjdF9yZXYocGVyc29uYV9pbmNvbWUpKSkgKwogIGdlb21fcG9pbnRyYW5nZShzaXplID0gMC43NSwgZmF0dGVuID0gMS41LAogICAgICAgICAgICAgICAgICBhZXMoeG1pbiA9IDAsIHhtYXggPSAuLnguLiksIHBvc2l0aW9uID0gcG9zaXRpb25fZG9kZ2Uod2lkdGggPSAwLjUpKSArIAogIHNjYWxlX3hfY29udGludW91cyhsYWJlbHMgPSBwZXJjZW50X2Zvcm1hdChhY2N1cmFjeSA9IDEpLCBleHBhbmQgPSBleHBhbnNpb24oYWRkID0gYygwLCAwLjAwMikpLAogICAgICAgICAgICAgICAgICAgICBicmVha3MgPSBzZXEoMCwgMC4wNiwgMC4wMikpICsKICBzY2FsZV9jb2xvcl9tYW51YWwodmFsdWVzID0gY2xyc19uZ29fcGFpcnNbWzFdXSwgZ3VpZGUgPSBGQUxTRSkgKwogIGNvb3JkX2NhcnRlc2lhbih4bGltID0gYygwLCAwLjA2KSkgKwogIGxhYnMoeCA9ICJBdmVyYWdlIGRvbmF0aW9uIHNoYXJlIiwgeSA9IE5VTEwsIGNvbG9yID0gTlVMTCkgKwogIGZhY2V0X3dyYXAodmFycyhmYWNldCkpICsKICB0aGVtZV9uZ28oKSArCiAgdGhlbWUocGFuZWwuZ3JpZC5tYWpvci55ID0gZWxlbWVudF9ibGFuaygpKQoKcGxvdF9pbmNvbWVfZnVuZGluZyA8LSBzaW1fZmluYWwgJT4lIAogIGdyb3VwX2J5KG9yZ19mdW5kaW5nLCBwZXJzb25hX2luY29tZSkgJT4lIAogIHN1bW1hcml6ZShhdmdfc2hhcmUgPSBtZWFuKHNoYXJlKSkgJT4lIAogIG11dGF0ZShmYWNldCA9ICJGdW5kaW5nIHNvdXJjZXMiKSAlPiUgCiAgZ2dwbG90KGFlcyh5ID0gZmN0X3JldihzdHJfd3JhcF9mYWN0b3Iob3JnX2Z1bmRpbmcsIDEwKSksIAogICAgICAgICAgICAgeCA9IGF2Z19zaGFyZSwgY29sb3IgPSBmY3RfcmV2KHBlcnNvbmFfaW5jb21lKSkpICsKICBnZW9tX3BvaW50cmFuZ2Uoc2l6ZSA9IDAuNzUsIGZhdHRlbiA9IDEuNSwKICAgICAgICAgICAgICAgICAgYWVzKHhtaW4gPSAwLCB4bWF4ID0gLi54Li4pLCBwb3NpdGlvbiA9IHBvc2l0aW9uX2RvZGdlKHdpZHRoID0gMC41KSkgKyAKICBzY2FsZV94X2NvbnRpbnVvdXMobGFiZWxzID0gcGVyY2VudF9mb3JtYXQoYWNjdXJhY3kgPSAxKSwgZXhwYW5kID0gZXhwYW5zaW9uKGFkZCA9IGMoMCwgMC4wMDIpKSkgKwogIGNvb3JkX2NhcnRlc2lhbih4bGltID0gYygwLCAwLjA2KSkgKwogIHNjYWxlX2NvbG9yX21hbnVhbCh2YWx1ZXMgPSBjbHJzX25nb19wYWlyc1tbMV1dLCBndWlkZSA9IEZBTFNFKSArCiAgbGFicyh4ID0gIkF2ZXJhZ2UgZG9uYXRpb24gc2hhcmUiLCB5ID0gTlVMTCwgY29sb3IgPSBOVUxMKSArCiAgZmFjZXRfd3JhcCh2YXJzKGZhY2V0KSkgKwogIHRoZW1lX25nbygpICsKICB0aGVtZShwYW5lbC5ncmlkLm1ham9yLnkgPSBlbGVtZW50X2JsYW5rKCkpCgpwbG90X2luY29tZV9yZWxhdGlvbnNoaXAgPC0gc2ltX2ZpbmFsICU+JSAKICBtdXRhdGUocGVyc29uYV9pbmNvbWUgPSBmY3RfcmVjb2RlKHBlcnNvbmFfaW5jb21lLAogICAgICAgICAgICAgICAgICAgICAgICAgICAgICAgICAgICAgIjwgJDYxLDM3Mi95ZWFyIiA9ICJMb3dlciBpbmNvbWUiLAogICAgICAgICAgICAgICAgICAgICAgICAgICAgICAgICAgICAgIj4gJDYxLDM3Mi95ZWFyIiA9ICJIaWdoZXIgaW5jb21lIikpICU+JSAKICBncm91cF9ieShvcmdfcmVsYXRpb25zaGlwLCBwZXJzb25hX2luY29tZSkgJT4lIAogIHN1bW1hcml6ZShhdmdfc2hhcmUgPSBtZWFuKHNoYXJlKSkgJT4lIAogIG11dGF0ZShmYWNldCA9ICJSZWxhdGlvbnNoaXAgd2l0aCBob3N0IGdvdmVybm1lbnQiKSAlPiUgCiAgZ2dwbG90KGFlcyh5ID0gZmN0X3JldihzdHJfd3JhcF9mYWN0b3Iob3JnX3JlbGF0aW9uc2hpcCwgMTApKSwgCiAgICAgICAgICAgICB4ID0gYXZnX3NoYXJlLCBjb2xvciA9IGZjdF9yZXYocGVyc29uYV9pbmNvbWUpKSkgKwogIGdlb21fcG9pbnRyYW5nZShzaXplID0gMC43NSwgZmF0dGVuID0gMS41LCAKICAgICAgICAgICAgICAgICAgYWVzKHhtaW4gPSAwLCB4bWF4ID0gLi54Li4pLCBwb3NpdGlvbiA9IHBvc2l0aW9uX2RvZGdlKHdpZHRoID0gMC41KSkgKwogIHNjYWxlX3hfY29udGludW91cyhsYWJlbHMgPSBwZXJjZW50X2Zvcm1hdChhY2N1cmFjeSA9IDEpLCBleHBhbmQgPSBleHBhbnNpb24oYWRkID0gYygwLCAwLjAwMykpKSArCiAgY29vcmRfY2FydGVzaWFuKHhsaW0gPSBjKDAsIDAuMSkpICsKICBzY2FsZV9jb2xvcl9tYW51YWwodmFsdWVzID0gY2xyc19uZ29fcGFpcnNbWzFdXSwgCiAgICAgICAgICAgICAgICAgICAgIGd1aWRlID0gZ3VpZGVfbGVnZW5kKHJldmVyc2UgPSBUUlVFLCBucm93ID0gMSwKICAgICAgICAgICAgICAgICAgICAgICAgICAgICAgICAgICAgICAgICAgb3ZlcnJpZGUuYWVzID0gbGlzdChzaXplID0gMC4yNSwKICAgICAgICAgICAgICAgICAgICAgICAgICAgICAgICAgICAgICAgICAgICAgICAgICAgICAgICAgICAgICBsaW5ldHlwZSA9IDApKSkgKwogIGxhYnMoeCA9ICJBdmVyYWdlIGRvbmF0aW9uIHNoYXJlIiwgeSA9IE5VTEwsIGNvbG9yID0gTlVMTCkgKwogIGZhY2V0X3dyYXAodmFycyhzdHJfd3JhcChmYWNldCwgNTApKSkgKwogIHRoZW1lX25nbygpICsKICB0aGVtZShwYW5lbC5ncmlkLm1ham9yLnkgPSBlbGVtZW50X2JsYW5rKCksCiAgICAgICAgbGVnZW5kLmtleS53aWR0aCA9IHVuaXQoMC41LCAibGluZXMiKSkKCnBsb3RfaW5jb21lX3JlbGF0aW9uc2hpcF9leHRyZW1lIDwtIHNpbV9leGNlbF9maW5hbCAlPiUgCiAgbXV0YXRlKHBlcnNvbmFfaW5jb21lID0gZmN0X3JlY29kZShwZXJzb25hX2luY29tZSwKICAgICAgICAgICAgICAgICAgICAgICAgICAgICAgICAgICAgICIkNTAsMDAwL3llYXIiID0gIkxvd2VyIGluY29tZSIsCiAgICAgICAgICAgICAgICAgICAgICAgICAgICAgICAgICAgICAiJDEwMCwwMDAveWVhciIgPSAiSGlnaGVyIGluY29tZSIpLAogICAgICAgICBvcmdfcmVsYXRpb25zaGlwID0gZmN0X3JlY29kZShvcmdfcmVsYXRpb25zaGlwLAogICAgICAgICAgICAgICAgICAgICAgICAgICAgICAgICAgICAgICAiVW5kZXIgY3JhY2tkb3duIiA9ICJDcmFja2Rvd24iKSkgJT4lIAogIGdyb3VwX2J5KG9yZ19yZWxhdGlvbnNoaXAsIHBlcnNvbmFfaW5jb21lKSAlPiUgCiAgc3VtbWFyaXplKGF2Z19zaGFyZSA9IG1lYW4oc2hhcmUpKSAlPiUgCiAgbXV0YXRlKGZhY2V0ID0gIlJlbGF0aW9uc2hpcCB3aXRoIGhvc3QgZ292ZXJubWVudCIpICU+JSAKICBnZ3Bsb3QoYWVzKHkgPSBmY3RfcmV2KHN0cl93cmFwX2ZhY3RvcihvcmdfcmVsYXRpb25zaGlwLCAxMCkpLCAKICAgICAgICAgICAgIHggPSBhdmdfc2hhcmUsIGNvbG9yID0gZmN0X3JldihwZXJzb25hX2luY29tZSkpKSArCiAgZ2VvbV9wb2ludHJhbmdlKHNpemUgPSAwLjc1LCBmYXR0ZW4gPSAxLjUsIGxpbmV0eXBlID0gIjIxIiwgcGNoID0gMiwKICAgICAgICAgICAgICAgICAgYWVzKHhtaW4gPSAwLCB4bWF4ID0gLi54Li4pLCBwb3NpdGlvbiA9IHBvc2l0aW9uX2RvZGdlKHdpZHRoID0gMC41KSkgKyAKICBzY2FsZV94X2NvbnRpbnVvdXMobGFiZWxzID0gcGVyY2VudF9mb3JtYXQoYWNjdXJhY3kgPSAxKSwgZXhwYW5kID0gZXhwYW5zaW9uKGFkZCA9IGMoMCwgMC4wMDIpKSkgKwogIGNvb3JkX2NhcnRlc2lhbih4bGltID0gYygwLCAwLjEpKSArCiAgc2NhbGVfY29sb3JfbWFudWFsKHZhbHVlcyA9IGNscnNfbmdvX3BhaXJzW1sxXV0sIAogICAgICAgICAgICAgICAgICAgICBndWlkZSA9IGd1aWRlX2xlZ2VuZChyZXZlcnNlID0gVFJVRSwgbnJvdyA9IDEsCiAgICAgICAgICAgICAgICAgICAgICAgICAgICAgICAgICAgICAgICAgIG92ZXJyaWRlLmFlcyA9IGxpc3Qoc2l6ZSA9IDAuMjUsIAogICAgICAgICAgICAgICAgICAgICAgICAgICAgICAgICAgICAgICAgICAgICAgICAgICAgICAgICAgICAgIGxpbmV0eXBlID0gMCkpKSArCiAgbGFicyh4ID0gIkF2ZXJhZ2UgZG9uYXRpb24gc2hhcmUiLCB5ID0gTlVMTCwgY29sb3IgPSBOVUxMKSArCiAgZmFjZXRfd3JhcCh2YXJzKHN0cl93cmFwKGZhY2V0LCA1MCkpKSArCiAgdGhlbWVfbmdvKCkgKwogIHRoZW1lKHBhbmVsLmdyaWQubWFqb3IueSA9IGVsZW1lbnRfYmxhbmsoKSwKICAgICAgICBsZWdlbmQua2V5LndpZHRoID0gdW5pdCgwLjUsICJsaW5lcyIpKQoKcGxvdF9pbmNvbWUgPC0gKChwbG90X2luY29tZV9pc3N1ZSArIGxhYnMoeCA9IE5VTEwpKSArIAogIChwbG90X2luY29tZV9mdW5kaW5nICsgbGFicyh4ID0gTlVMTCkpKSAvIAogIChwbG90X2luY29tZV9yZWxhdGlvbnNoaXAgKyBwbG90X2luY29tZV9yZWxhdGlvbnNoaXBfZXh0cmVtZSkKCnBsb3RfaW5jb21lCmBgYAoKIyMgRWR1Y2F0aW9uIGFjcm9zcyBpc3N1ZSBhcmVhLCBmdW5kaW5nLCBhbmQgcmVsYXRpb25zaGlwCgpgYGB7ciBlZHUtaXNzdWUtZnVuZGluZy1yZWxhdGlvbnNoaXAsIGZpZy53aWR0aD04LCBmaWcuaGVpZ2h0PTIuNzUsIGZpZy5hc3A9TlVMTCwgb3V0LndpZHRoPSIxMDAlIn0KcGxvdF9lZHVjYXRpb25faXNzdWUgPC0gc2ltX2ZpbmFsICU+JSAKICBncm91cF9ieShvcmdfaXNzdWUsIHBlcnNvbmFfZWR1Y2F0aW9uKSAlPiUgCiAgc3VtbWFyaXplKGF2Z19zaGFyZSA9IG1lYW4oc2hhcmUpKSAlPiUgCiAgbXV0YXRlKGZhY2V0ID0gIklzc3VlIGFyZWEiKSAlPiUgCiAgZ2dwbG90KGFlcyh5ID0gZmN0X3JldihzdHJfd3JhcF9mYWN0b3Iob3JnX2lzc3VlLCAxNSkpLCAKICAgICAgICAgICAgIHggPSBhdmdfc2hhcmUsIGNvbG9yID0gZmN0X3JldihwZXJzb25hX2VkdWNhdGlvbikpKSArCiAgZ2VvbV9wb2ludHJhbmdlKHNpemUgPSAwLjc1LCBmYXR0ZW4gPSAxLjUsCiAgICAgICAgICAgICAgICAgIGFlcyh4bWluID0gMCwgeG1heCA9IC4ueC4uKSwgcG9zaXRpb24gPSBwb3NpdGlvbl9kb2RnZSh3aWR0aCA9IDAuNSkpICsgCiAgc2NhbGVfeF9jb250aW51b3VzKGxhYmVscyA9IHBlcmNlbnRfZm9ybWF0KGFjY3VyYWN5ID0gMSksIGV4cGFuZCA9IGV4cGFuc2lvbihhZGQgPSBjKDAsIDAuMDAyKSkpICsKICBjb29yZF9jYXJ0ZXNpYW4oeGxpbSA9IGMoMCwgMC4wNikpICsKICBzY2FsZV9jb2xvcl9tYW51YWwodmFsdWVzID0gY2xyc19uZ29fcGFpcnNbWzJdXSwgZ3VpZGUgPSBGQUxTRSkgKwogIGxhYnMoeCA9ICJBdmVyYWdlIGRvbmF0aW9uIHNoYXJlIiwgeSA9IE5VTEwsIGNvbG9yID0gTlVMTCkgKwogIGZhY2V0X3dyYXAodmFycyhmYWNldCkpICsKICB0aGVtZV9uZ28oKSArCiAgdGhlbWUocGFuZWwuZ3JpZC5tYWpvci55ID0gZWxlbWVudF9ibGFuaygpKQoKcGxvdF9lZHVjYXRpb25fZnVuZGluZyA8LSBzaW1fZmluYWwgJT4lIAogIGdyb3VwX2J5KG9yZ19mdW5kaW5nLCBwZXJzb25hX2VkdWNhdGlvbikgJT4lIAogIHN1bW1hcml6ZShhdmdfc2hhcmUgPSBtZWFuKHNoYXJlKSkgJT4lIAogIG11dGF0ZShmYWNldCA9ICJGdW5kaW5nIHNvdXJjZXMiKSAlPiUgCiAgZ2dwbG90KGFlcyh5ID0gZmN0X3JldihzdHJfd3JhcF9mYWN0b3Iob3JnX2Z1bmRpbmcsIDEwKSksIAogICAgICAgICAgICAgeCA9IGF2Z19zaGFyZSwgY29sb3IgPSBmY3RfcmV2KHBlcnNvbmFfZWR1Y2F0aW9uKSkpICsKICBnZW9tX3BvaW50cmFuZ2Uoc2l6ZSA9IDAuNzUsIGZhdHRlbiA9IDEuNSwKICAgICAgICAgICAgICAgICAgYWVzKHhtaW4gPSAwLCB4bWF4ID0gLi54Li4pLCBwb3NpdGlvbiA9IHBvc2l0aW9uX2RvZGdlKHdpZHRoID0gMC41KSkgKyAKICBzY2FsZV94X2NvbnRpbnVvdXMobGFiZWxzID0gcGVyY2VudF9mb3JtYXQoYWNjdXJhY3kgPSAxKSwgZXhwYW5kID0gZXhwYW5zaW9uKGFkZCA9IGMoMCwgMC4wMDIpKSkgKwogIGNvb3JkX2NhcnRlc2lhbih4bGltID0gYygwLCAwLjA2KSkgKwogIHNjYWxlX2NvbG9yX21hbnVhbCh2YWx1ZXMgPSBjbHJzX25nb19wYWlyc1tbMl1dLCBndWlkZSA9IEZBTFNFKSArCiAgbGFicyh4ID0gIkF2ZXJhZ2UgZG9uYXRpb24gc2hhcmUiLCB5ID0gTlVMTCwgY29sb3IgPSBOVUxMKSArCiAgZmFjZXRfd3JhcCh2YXJzKGZhY2V0KSkgKwogIHRoZW1lX25nbygpICsKICB0aGVtZShwYW5lbC5ncmlkLm1ham9yLnkgPSBlbGVtZW50X2JsYW5rKCkpCgpwbG90X2VkdWNhdGlvbl9yZWxhdGlvbnNoaXAgPC0gc2ltX2ZpbmFsICU+JSAKICBncm91cF9ieShvcmdfcmVsYXRpb25zaGlwLCBwZXJzb25hX2VkdWNhdGlvbikgJT4lIAogIHN1bW1hcml6ZShhdmdfc2hhcmUgPSBtZWFuKHNoYXJlKSkgJT4lIAogIG11dGF0ZShmYWNldCA9ICJSZWxhdGlvbnNoaXAgd2l0aCBob3N0IGdvdmVybm1lbnQiKSAlPiUgCiAgZ2dwbG90KGFlcyh5ID0gZmN0X3JldihzdHJfd3JhcF9mYWN0b3Iob3JnX3JlbGF0aW9uc2hpcCwgMTApKSwKICAgICAgICAgICAgIHggPSBhdmdfc2hhcmUsIGNvbG9yID0gZmN0X3JldihwZXJzb25hX2VkdWNhdGlvbikpKSArCiAgZ2VvbV9wb2ludHJhbmdlKHNpemUgPSAwLjc1LCBmYXR0ZW4gPSAxLjUsCiAgICAgICAgICAgICAgICAgIGFlcyh4bWluID0gMCwgeG1heCA9IC4ueC4uKSwgcG9zaXRpb24gPSBwb3NpdGlvbl9kb2RnZSh3aWR0aCA9IDAuNSkpICsgCiAgc2NhbGVfeF9jb250aW51b3VzKGxhYmVscyA9IHBlcmNlbnRfZm9ybWF0KGFjY3VyYWN5ID0gMSksIGV4cGFuZCA9IGV4cGFuc2lvbihhZGQgPSBjKDAsIDAuMDAyKSkpICsKICBjb29yZF9jYXJ0ZXNpYW4oeGxpbSA9IGMoMCwgMC4xKSkgKwogIHNjYWxlX2NvbG9yX21hbnVhbCh2YWx1ZXMgPSBjbHJzX25nb19wYWlyc1tbMl1dLCAKICAgICAgICAgICAgICAgICAgICAgZ3VpZGUgPSBndWlkZV9sZWdlbmQocmV2ZXJzZSA9IFRSVUUsIG5jb2wgPSAxLAogICAgICAgICAgICAgICAgICAgICAgICAgICAgICAgICAgICAgICAgICBvdmVycmlkZS5hZXMgPSBsaXN0KHNpemUgPSAwLjI1LAogICAgICAgICAgICAgICAgICAgICAgICAgICAgICAgICAgICAgICAgICAgICAgICAgICAgICAgICAgICAgIGxpbmV0eXBlID0gMCkpLAogICAgICAgICAgICAgICAgICAgICBsYWJlbHMgPSBsYWJlbF93cmFwKDE1KSkgKwogIGxhYnMoeCA9ICJBdmVyYWdlIGRvbmF0aW9uIHNoYXJlIiwgeSA9IE5VTEwsIGNvbG9yID0gTlVMTCkgKwogIGZhY2V0X3dyYXAodmFycyhzdHJfd3JhcChmYWNldCwgMjApKSkgKwogIHRoZW1lX25nbygpICsKICB0aGVtZShwYW5lbC5ncmlkLm1ham9yLnkgPSBlbGVtZW50X2JsYW5rKCksCiAgICAgICAgbGVnZW5kLmtleS53aWR0aCA9IHVuaXQoMC41LCAibGluZXMiKSkKCnBsb3RfZWR1Y2F0aW9uIDwtIHBsb3RfZWR1Y2F0aW9uX2lzc3VlICsgcGxvdF9lZHVjYXRpb25fZnVuZGluZyArIAogIHBsb3RfZWR1Y2F0aW9uX3JlbGF0aW9uc2hpcCArIGd1aWRlX2FyZWEoKSArCiAgcGxvdF9sYXlvdXQoZ3VpZGVzID0gImNvbGxlY3QiLCBuY29sID0gNCkKcGxvdF9lZHVjYXRpb24KYGBgCgojIyBSZWxpZ2lvc2l0eSBhY3Jvc3MgaXNzdWUgYXJlYSwgZnVuZGluZywgYW5kIHJlbGF0aW9uc2hpcAoKYGBge3IgcmVsaWdpb24taXNzdWUtZnVuZGluZy1yZWxhdGlvbnNoaXAsIGZpZy53aWR0aD04LCBmaWcuaGVpZ2h0PTIuNzUsIGZpZy5hc3A9TlVMTCwgb3V0LndpZHRoPSIxMDAlIn0KcGxvdF9yZWxpZ2lvbl9pc3N1ZSA8LSBzaW1fZmluYWwgJT4lIAogIGdyb3VwX2J5KG9yZ19pc3N1ZSwgcGVyc29uYV9yZWxpZ2lvbikgJT4lIAogIHN1bW1hcml6ZShhdmdfc2hhcmUgPSBtZWFuKHNoYXJlKSkgJT4lIAogIG11dGF0ZShmYWNldCA9ICJJc3N1ZSBhcmVhIikgJT4lIAogIGdncGxvdChhZXMoeSA9IGZjdF9yZXYoc3RyX3dyYXBfZmFjdG9yKG9yZ19pc3N1ZSwgMTUpKSwgCiAgICAgICAgICAgICB4ID0gYXZnX3NoYXJlLCBjb2xvciA9IGZjdF9yZXYocGVyc29uYV9yZWxpZ2lvbikpKSArCiAgZ2VvbV9wb2ludHJhbmdlKHNpemUgPSAwLjc1LCBmYXR0ZW4gPSAxLjUsIHBjaCA9IDE3LAogICAgICAgICAgICAgICAgICBhZXMoeG1pbiA9IDAsIHhtYXggPSAuLnguLiksIHBvc2l0aW9uID0gcG9zaXRpb25fZG9kZ2Uod2lkdGggPSAwLjUpKSArIAogIHNjYWxlX3hfY29udGludW91cyhsYWJlbHMgPSBwZXJjZW50X2Zvcm1hdChhY2N1cmFjeSA9IDEpLCBleHBhbmQgPSBleHBhbnNpb24oYWRkID0gYygwLCAwLjAwMikpKSArCiAgY29vcmRfY2FydGVzaWFuKHhsaW0gPSBjKDAsIDAuMDYpKSArCiAgc2NhbGVfY29sb3JfbWFudWFsKHZhbHVlcyA9IGNscnNfbmdvX3BhaXJzW1s0XV0sIGd1aWRlID0gRkFMU0UpICsKICBsYWJzKHggPSAiQXZlcmFnZSBkb25hdGlvbiBzaGFyZSIsIHkgPSBOVUxMLCBjb2xvciA9IE5VTEwpICsKICBmYWNldF93cmFwKHZhcnMoZmFjZXQpKSArCiAgdGhlbWVfbmdvKCkgKwogIHRoZW1lKHBhbmVsLmdyaWQubWFqb3IueSA9IGVsZW1lbnRfYmxhbmsoKSkKCnBsb3RfcmVsaWdpb25fZnVuZGluZyA8LSBzaW1fZmluYWwgJT4lIAogIGdyb3VwX2J5KG9yZ19mdW5kaW5nLCBwZXJzb25hX3JlbGlnaW9uKSAlPiUgCiAgc3VtbWFyaXplKGF2Z19zaGFyZSA9IG1lYW4oc2hhcmUpKSAlPiUgCiAgbXV0YXRlKGZhY2V0ID0gIkZ1bmRpbmcgc291cmNlcyIpICU+JSAKICBnZ3Bsb3QoYWVzKHkgPSBmY3RfcmV2KHN0cl93cmFwX2ZhY3RvcihvcmdfZnVuZGluZywgMTApKSwgCiAgICAgICAgICAgICB4ID0gYXZnX3NoYXJlLCBjb2xvciA9IGZjdF9yZXYocGVyc29uYV9yZWxpZ2lvbikpKSArCiAgZ2VvbV9wb2ludHJhbmdlKHNpemUgPSAwLjc1LCBmYXR0ZW4gPSAxLjUsIHBjaCA9IDE3LAogICAgICAgICAgICAgICAgICBhZXMoeG1pbiA9IDAsIHhtYXggPSAuLnguLiksIHBvc2l0aW9uID0gcG9zaXRpb25fZG9kZ2Uod2lkdGggPSAwLjUpKSArIAogIHNjYWxlX3hfY29udGludW91cyhsYWJlbHMgPSBwZXJjZW50X2Zvcm1hdChhY2N1cmFjeSA9IDEpLCBleHBhbmQgPSBleHBhbnNpb24oYWRkID0gYygwLCAwLjAwMikpKSArCiAgY29vcmRfY2FydGVzaWFuKHhsaW0gPSBjKDAsIDAuMDYpKSArCiAgc2NhbGVfY29sb3JfbWFudWFsKHZhbHVlcyA9IGNscnNfbmdvX3BhaXJzW1s0XV0sIGd1aWRlID0gRkFMU0UpICsKICBsYWJzKHggPSAiQXZlcmFnZSBkb25hdGlvbiBzaGFyZSIsIHkgPSBOVUxMLCBjb2xvciA9IE5VTEwpICsKICBmYWNldF93cmFwKHZhcnMoZmFjZXQpKSArCiAgdGhlbWVfbmdvKCkgKwogIHRoZW1lKHBhbmVsLmdyaWQubWFqb3IueSA9IGVsZW1lbnRfYmxhbmsoKSkKCnBsb3RfcmVsaWdpb25fcmVsYXRpb25zaGlwIDwtIHNpbV9maW5hbCAlPiUgCiAgZ3JvdXBfYnkob3JnX3JlbGF0aW9uc2hpcCwgcGVyc29uYV9yZWxpZ2lvbikgJT4lIAogIHN1bW1hcml6ZShhdmdfc2hhcmUgPSBtZWFuKHNoYXJlKSkgJT4lIAogIG11dGF0ZShmYWNldCA9ICJSZWxhdGlvbnNoaXAgd2l0aCBob3N0IGdvdmVybm1lbnQiKSAlPiUgCiAgZ2dwbG90KGFlcyh5ID0gZmN0X3JldihzdHJfd3JhcF9mYWN0b3Iob3JnX3JlbGF0aW9uc2hpcCwgMTApKSwgCiAgICAgICAgICAgICB4ID0gYXZnX3NoYXJlLCBjb2xvciA9IGZjdF9yZXYocGVyc29uYV9yZWxpZ2lvbikpKSArCiAgZ2VvbV9wb2ludHJhbmdlKHNpemUgPSAwLjc1LCBmYXR0ZW4gPSAxLjUsIHBjaCA9IDE3LAogICAgICAgICAgICAgICAgICBhZXMoeG1pbiA9IDAsIHhtYXggPSAuLnguLiksIHBvc2l0aW9uID0gcG9zaXRpb25fZG9kZ2Uod2lkdGggPSAwLjUpKSArIAogIHNjYWxlX3hfY29udGludW91cyhsYWJlbHMgPSBwZXJjZW50X2Zvcm1hdChhY2N1cmFjeSA9IDEpLCBleHBhbmQgPSBleHBhbnNpb24oYWRkID0gYygwLCAwLjAwMikpKSArCiAgY29vcmRfY2FydGVzaWFuKHhsaW0gPSBjKDAsIDAuMSkpICsKICBzY2FsZV9jb2xvcl9tYW51YWwodmFsdWVzID0gY2xyc19uZ29fcGFpcnNbWzRdXSwgCiAgICAgICAgICAgICAgICAgICAgIGd1aWRlID0gZ3VpZGVfbGVnZW5kKHJldmVyc2UgPSBUUlVFLCBuY29sID0gMSwKICAgICAgICAgICAgICAgICAgICAgICAgICAgICAgICAgICAgICAgICAgb3ZlcnJpZGUuYWVzID0gbGlzdChzaXplID0gMC4yNSwKICAgICAgICAgICAgICAgICAgICAgICAgICAgICAgICAgICAgICAgICAgICAgICAgICAgICAgICAgICAgICBsaW5ldHlwZSA9IDApKSwKICAgICAgICAgICAgICAgICAgICAgbGFiZWxzID0gbGFiZWxfd3JhcCgyMCkpICsKICBsYWJzKHggPSAiQXZlcmFnZSBkb25hdGlvbiBzaGFyZSIsIHkgPSBOVUxMLCBjb2xvciA9IE5VTEwpICsKICBmYWNldF93cmFwKHZhcnMoc3RyX3dyYXAoZmFjZXQsIDIwKSkpICsKICB0aGVtZV9uZ28oKSArCiAgdGhlbWUocGFuZWwuZ3JpZC5tYWpvci55ID0gZWxlbWVudF9ibGFuaygpLAogICAgICAgIGxlZ2VuZC5rZXkud2lkdGggPSB1bml0KDAuNSwgImxpbmVzIikpCgpwbG90X3JlbGlnaW9uIDwtIHBsb3RfcmVsaWdpb25faXNzdWUgKyBwbG90X3JlbGlnaW9uX2Z1bmRpbmcgKyAKICBwbG90X3JlbGlnaW9uX3JlbGF0aW9uc2hpcCArIGd1aWRlX2FyZWEoKSArCiAgcGxvdF9sYXlvdXQoZ3VpZGVzID0gImNvbGxlY3QiLCBuY29sID0gNCkKcGxvdF9yZWxpZ2lvbgpgYGAKCiMjIEVkdWNhdGlvbiBhbmQgcmVsaWdpb24gYWNyb3NzIGlzc3VlIGFyZWEsIGZ1bmRpbmcsIGFuZCByZWxhdGlvbnNoaXAKCmBgYHtyIGVkdWNhdGlvbi1yZWxpZ2lvbi1pc3N1ZS1mdW5kaW5nLXJlbGF0aW9uc2hpcCwgZmlnLndpZHRoPTYsIGZpZy5oZWlnaHQ9NC41LCBmaWcuYXNwPU5VTEwsIG91dC53aWR0aD0iMTAwJSJ9CnBsb3RfZWR1Y2F0aW9uX3JlbGlnaW9uIDwtIChwbG90X2VkdWNhdGlvbl9pc3N1ZSArIGxhYnMoeCA9IE5VTEwpKSArIAogIChwbG90X2VkdWNhdGlvbl9mdW5kaW5nICsgbGFicyh4ID0gTlVMTCkpICsgCiAgKHBsb3RfZWR1Y2F0aW9uX3JlbGF0aW9uc2hpcCArIGxhYnMoeCA9IE5VTEwpKSArIAogIGd1aWRlX2FyZWEoKSArCiAgcGxvdF9yZWxpZ2lvbl9pc3N1ZSArIAogIHBsb3RfcmVsaWdpb25fZnVuZGluZyArIAogIHBsb3RfcmVsaWdpb25fcmVsYXRpb25zaGlwICsKICBwbG90X2xheW91dChndWlkZXMgPSAiY29sbGVjdCIsIG5jb2wgPSA0KQoKcGxvdF9lZHVjYXRpb25fcmVsaWdpb24KYGBgCgoKIyMgU29jaWFsIHRydXN0IGFjcm9zcyBpc3N1ZSBhcmVhCgpgYGB7ciB0cnVzdC1pc3N1ZXMsIGZpZy53aWR0aD02LCBmaWcuaGVpZ2h0PTQsIGZpZy5hc3A9TlVMTCwgb3V0LndpZHRoPSIxMDAlIn0KcGxvdF9pc3N1ZV9zb2NpYWwgPC0gc2ltX2ZpbmFsICU+JSAKICBncm91cF9ieShvcmdfaXNzdWUsIHBlcnNvbmFfdHJ1c3QsIHBlcnNvbmFfaWRlb2xvZ3ksIHBlcnNvbmFfZXhwZXJpZW5jZSkgJT4lIAogIHN1bW1hcml6ZShhdmdfc2hhcmUgPSBtZWFuKHNoYXJlKSkgJT4lIAogIGdncGxvdChhZXMoeSA9IGZjdF9yZXYoc3RyX3dyYXBfZmFjdG9yKG9yZ19pc3N1ZSwgMTUpKSwgCiAgICAgICAgICAgICB4ID0gYXZnX3NoYXJlLCBjb2xvciA9IHBlcnNvbmFfdHJ1c3QpKSArCiAgZ2VvbV9wb2ludHJhbmdlKHNpemUgPSAwLjc1LCBmYXR0ZW4gPSAxLjUsIAogICAgICAgICAgICAgICAgICBhZXMoeG1pbiA9IDAsIHhtYXggPSAuLnguLiksIHBvc2l0aW9uID0gcG9zaXRpb25fZG9kZ2Uod2lkdGggPSAwLjUpKSArIAogIHNjYWxlX3hfY29udGludW91cyhsYWJlbHMgPSBwZXJjZW50X2Zvcm1hdChhY2N1cmFjeSA9IDEpLCBleHBhbmQgPSBleHBhbnNpb24oYWRkID0gYygwLCAwLjAwMikpKSArCiAgc2NhbGVfY29sb3JfbWFudWFsKHZhbHVlcyA9IGNscnNfbmdvX3BhaXJzW1szXV0sIAogICAgICAgICAgICAgICAgICAgICBndWlkZSA9IGd1aWRlX2xlZ2VuZChyZXZlcnNlID0gVFJVRSwKICAgICAgICAgICAgICAgICAgICAgICAgICAgICAgICAgICAgICAgICAgb3ZlcnJpZGUuYWVzID0gbGlzdChzaXplID0gMC4yNSwKICAgICAgICAgICAgICAgICAgICAgICAgICAgICAgICAgICAgICAgICAgICAgICAgICAgICAgICAgICAgICBsaW5ldHlwZSA9IDApKSkgKwogIGxhYnMoeCA9ICJBdmVyYWdlIHNoYXJlIG9mIGRvbmF0aW9ucyIsIHkgPSBOVUxMLCBjb2xvciA9IE5VTEwpICsKICBmYWNldF9ncmlkKHJvd3MgPSB2YXJzKHBlcnNvbmFfaWRlb2xvZ3kpLCBjb2xzID0gdmFycyhzdHJfd3JhcChwZXJzb25hX2V4cGVyaWVuY2UsIDEwMCkpKSArCiAgdGhlbWVfbmdvKCkgKwogIHRoZW1lKHBhbmVsLmdyaWQubWFqb3IueSA9IGVsZW1lbnRfYmxhbmsoKSwKICAgICAgICBsZWdlbmQua2V5LndpZHRoID0gdW5pdCgwLjUsICJsaW5lcyIpKQoKcGxvdF9pc3N1ZV9zb2NpYWwKYGBgCgojIyBTb2NpYWwgdHJ1c3QgYWNyb3NzIHJlbGF0aW9uc2hpcAoKYGBge3IgdHJ1c3QtcmVsYXRpb25zaGlwLCBmaWcud2lkdGg9NiwgZmlnLmhlaWdodD00LCBmaWcuYXNwPU5VTEwsIG91dC53aWR0aD0iMTAwJSJ9CnBsb3RfcmVsYXRpb25zaGlwX3NvY2lhbCA8LSBzaW1fZmluYWwgJT4lIAogIGdyb3VwX2J5KG9yZ19yZWxhdGlvbnNoaXAsIHBlcnNvbmFfdHJ1c3QsIHBlcnNvbmFfaWRlb2xvZ3ksIHBlcnNvbmFfZXhwZXJpZW5jZSkgJT4lIAogIHN1bW1hcml6ZShhdmdfc2hhcmUgPSBtZWFuKHNoYXJlKSkgJT4lIAogIGdncGxvdChhZXMoeSA9IGZjdF9yZXYoc3RyX3dyYXBfZmFjdG9yKG9yZ19yZWxhdGlvbnNoaXAsIDEwKSksIAogICAgICAgICAgICAgeCA9IGF2Z19zaGFyZSwgY29sb3IgPSBwZXJzb25hX3RydXN0KSkgKwogIGdlb21fcG9pbnRyYW5nZShzaXplID0gMC43NSwgZmF0dGVuID0gMS41LAogICAgICAgICAgICAgICAgICBhZXMoeG1pbiA9IDAsIHhtYXggPSAuLnguLiksIHBvc2l0aW9uID0gcG9zaXRpb25fZG9kZ2Uod2lkdGggPSAwLjUpKSArIAogIHNjYWxlX3hfY29udGludW91cyhsYWJlbHMgPSBwZXJjZW50X2Zvcm1hdChhY2N1cmFjeSA9IDEpLCBleHBhbmQgPSBleHBhbnNpb24oYWRkID0gYygwLCAwLjAwMikpKSArCiAgc2NhbGVfY29sb3JfbWFudWFsKHZhbHVlcyA9IGNscnNfbmdvX3BhaXJzW1szXV0sIAogICAgICAgICAgICAgICAgICAgICBndWlkZSA9IGd1aWRlX2xlZ2VuZChyZXZlcnNlID0gVFJVRSwKICAgICAgICAgICAgICAgICAgICAgICAgICAgICAgICAgICAgICAgICAgb3ZlcnJpZGUuYWVzID0gbGlzdChzaXplID0gMC4yNSwKICAgICAgICAgICAgICAgICAgICAgICAgICAgICAgICAgICAgICAgICAgICAgICAgICAgICAgICAgICAgICBsaW5ldHlwZSA9IDApKSkgKwogIGxhYnMoeCA9ICJBdmVyYWdlIHNoYXJlIG9mIGRvbmF0aW9ucyIsIHkgPSBOVUxMLCBjb2xvciA9IE5VTEwpICsKICBmYWNldF9ncmlkKHJvd3MgPSB2YXJzKHBlcnNvbmFfaWRlb2xvZ3kpLCBjb2xzID0gdmFycyhzdHJfd3JhcChwZXJzb25hX2V4cGVyaWVuY2UsIDEwMCkpKSArCiAgdGhlbWVfbmdvKCkgKwogIHRoZW1lKHBhbmVsLmdyaWQubWFqb3IueSA9IGVsZW1lbnRfYmxhbmsoKSwKICAgICAgICBsZWdlbmQua2V5LndpZHRoID0gdW5pdCgwLjUsICJsaW5lcyIpKQoKcGxvdF9yZWxhdGlvbnNoaXBfc29jaWFsCmBgYAoKIyMgU29jaWFsIHRydXN0IGFjcm9zcyBmdW5kaW5nCgpgYGB7ciB0cnVzdC1mdW5kaW5nLCBmaWcud2lkdGg9NiwgZmlnLmhlaWdodD00LCBmaWcuYXNwPU5VTEwsIG91dC53aWR0aD0iMTAwJSJ9CnBsb3RfZnVuZGluZ19zb2NpYWwgPC0gc2ltX2ZpbmFsICU+JSAKICBncm91cF9ieShvcmdfZnVuZGluZywgcGVyc29uYV90cnVzdCwgcGVyc29uYV9pZGVvbG9neSwgcGVyc29uYV9leHBlcmllbmNlKSAlPiUgCiAgc3VtbWFyaXplKGF2Z19zaGFyZSA9IG1lYW4oc2hhcmUpKSAlPiUgCiAgZ2dwbG90KGFlcyh5ID0gZmN0X3JldihzdHJfd3JhcF9mYWN0b3Iob3JnX2Z1bmRpbmcsIDE1KSksIAogICAgICAgICAgICAgeCA9IGF2Z19zaGFyZSwgY29sb3IgPSBwZXJzb25hX3RydXN0KSkgKwogIGdlb21fcG9pbnRyYW5nZShzaXplID0gMC43NSwgZmF0dGVuID0gMS41LAogICAgICAgICAgICAgICAgICBhZXMoeG1pbiA9IDAsIHhtYXggPSAuLnguLiksIHBvc2l0aW9uID0gcG9zaXRpb25fZG9kZ2Uod2lkdGggPSAwLjUpKSArIAogIHNjYWxlX3hfY29udGludW91cyhsYWJlbHMgPSBwZXJjZW50X2Zvcm1hdChhY2N1cmFjeSA9IDEpLCBleHBhbmQgPSBleHBhbnNpb24oYWRkID0gYygwLCAwLjAwMikpKSArCiAgc2NhbGVfY29sb3JfbWFudWFsKHZhbHVlcyA9IGNscnNfbmdvX3BhaXJzW1szXV0sIAogICAgICAgICAgICAgICAgICAgICBndWlkZSA9IGd1aWRlX2xlZ2VuZChyZXZlcnNlID0gVFJVRSwKICAgICAgICAgICAgICAgICAgICAgICAgICAgICAgICAgICAgICAgICAgb3ZlcnJpZGUuYWVzID0gbGlzdChzaXplID0gMC4yNSwKICAgICAgICAgICAgICAgICAgICAgICAgICAgICAgICAgICAgICAgICAgICAgICAgICAgICAgICAgICAgICBsaW5ldHlwZSA9IDApKSkgKwogIGxhYnMoeCA9ICJBdmVyYWdlIHNoYXJlIG9mIGRvbmF0aW9ucyIsIHkgPSBOVUxMLCBjb2xvciA9IE5VTEwpICsKICBmYWNldF9ncmlkKHJvd3MgPSB2YXJzKHBlcnNvbmFfaWRlb2xvZ3kpLCBjb2xzID0gdmFycyhzdHJfd3JhcChwZXJzb25hX2V4cGVyaWVuY2UsIDEwMCkpKSArCiAgdGhlbWVfbmdvKCkgKwogIHRoZW1lKHBhbmVsLmdyaWQubWFqb3IueSA9IGVsZW1lbnRfYmxhbmsoKSwKICAgICAgICBsZWdlbmQua2V5LndpZHRoID0gdW5pdCgwLjUsICJsaW5lcyIpKQoKcGxvdF9mdW5kaW5nX3NvY2lhbApgYGAKCgpcCgojIE9yaWdpbmFsIGNvbXB1dGluZyBlbnZpcm9ubWVudAoKPGJ1dHRvbiBkYXRhLXRvZ2dsZT0iY29sbGFwc2UiIGRhdGEtdGFyZ2V0PSIjc2Vzc2lvbmluZm8iIGNsYXNzPSJidG4gYnRuLXByaW1hcnkgYnRuLW1kIGJ0bi1pbmZvIj5IZXJlJ3Mgd2hhdCB3ZSB1c2VkIHRoZSBsYXN0IHRpbWUgd2UgYnVpbHQgdGhpcyBwYWdlPC9idXR0b24+Cgo8ZGl2IGlkPSJzZXNzaW9uaW5mbyIgY2xhc3M9ImNvbGxhcHNlIj4KCmBgYHtyIHNob3ctc2Vzc2lvbi1pbmZvLCBlY2hvPVRSVUUsIHdpZHRoPTEwMH0KZGV2dG9vbHM6OnNlc3Npb25faW5mbygpCgp3cml0ZUxpbmVzKHJlYWRMaW5lcyhmaWxlLnBhdGgoU3lzLmdldGVudigiSE9NRSIpLCAiLlIvTWFrZXZhcnMiKSkpCmBgYAoKPC9kaXY+Cg==
Social trust across issue area