library(tidyverse)library(targets)library(scales)tar_config_set(store = here::here('_targets'),script = here::here('_targets.R'))# Load graphics functions from targetsinvisible(list2env(tar_read(graphic_functions), .GlobalEnv))show_nice_pal <-function(pal, nrow =1, show_text =TRUE) { out <-tibble(x =1:length(pal),color = pal) %>%mutate(x_nice = glue::glue("[{x}]")) %>%mutate(across(c(color, x_nice), ~fct_inorder(.))) %>%ggplot(aes(x = color, y =1, fill = color)) +geom_tile() +scale_x_discrete(expand =c(0, 0)) +scale_fill_identity() +facet_wrap(vars(x_nice), scales ="free_x", nrow = nrow) +theme_void(base_family ="Inconsolata") +theme(panel.spacing.x =unit(-1, units ="pt"),panel.spacing.y =unit(-0.5, units ="lines"),strip.text =element_blank())if (show_text) { out <- out +theme(axis.text.x =element_text(margin =margin(b =5)),strip.text =element_text(size =rel(1.1), margin =margin(t =5)),panel.spacing.y =unit(0, units ="lines")) }return(out)}
Fonts
We use Inter (accessible for free from Google Fonts) as the main font in all our plots.
Inter
Whereas recognition of the inherent dignity and of the equal and inalienable rights of all members of the human family is the foundation of freedom, justice and peace in the world…
In the fancy preprint version of our manuscript we use Linux Libertine for the main body font, since it fits with Libertinus Math for fancier math typesetting.
Linux Libertine
Whereas recognition of the inherent dignity and of the equal and inalienable rights of all members of the human family is the foundation of freedom, justice and peace in the world…
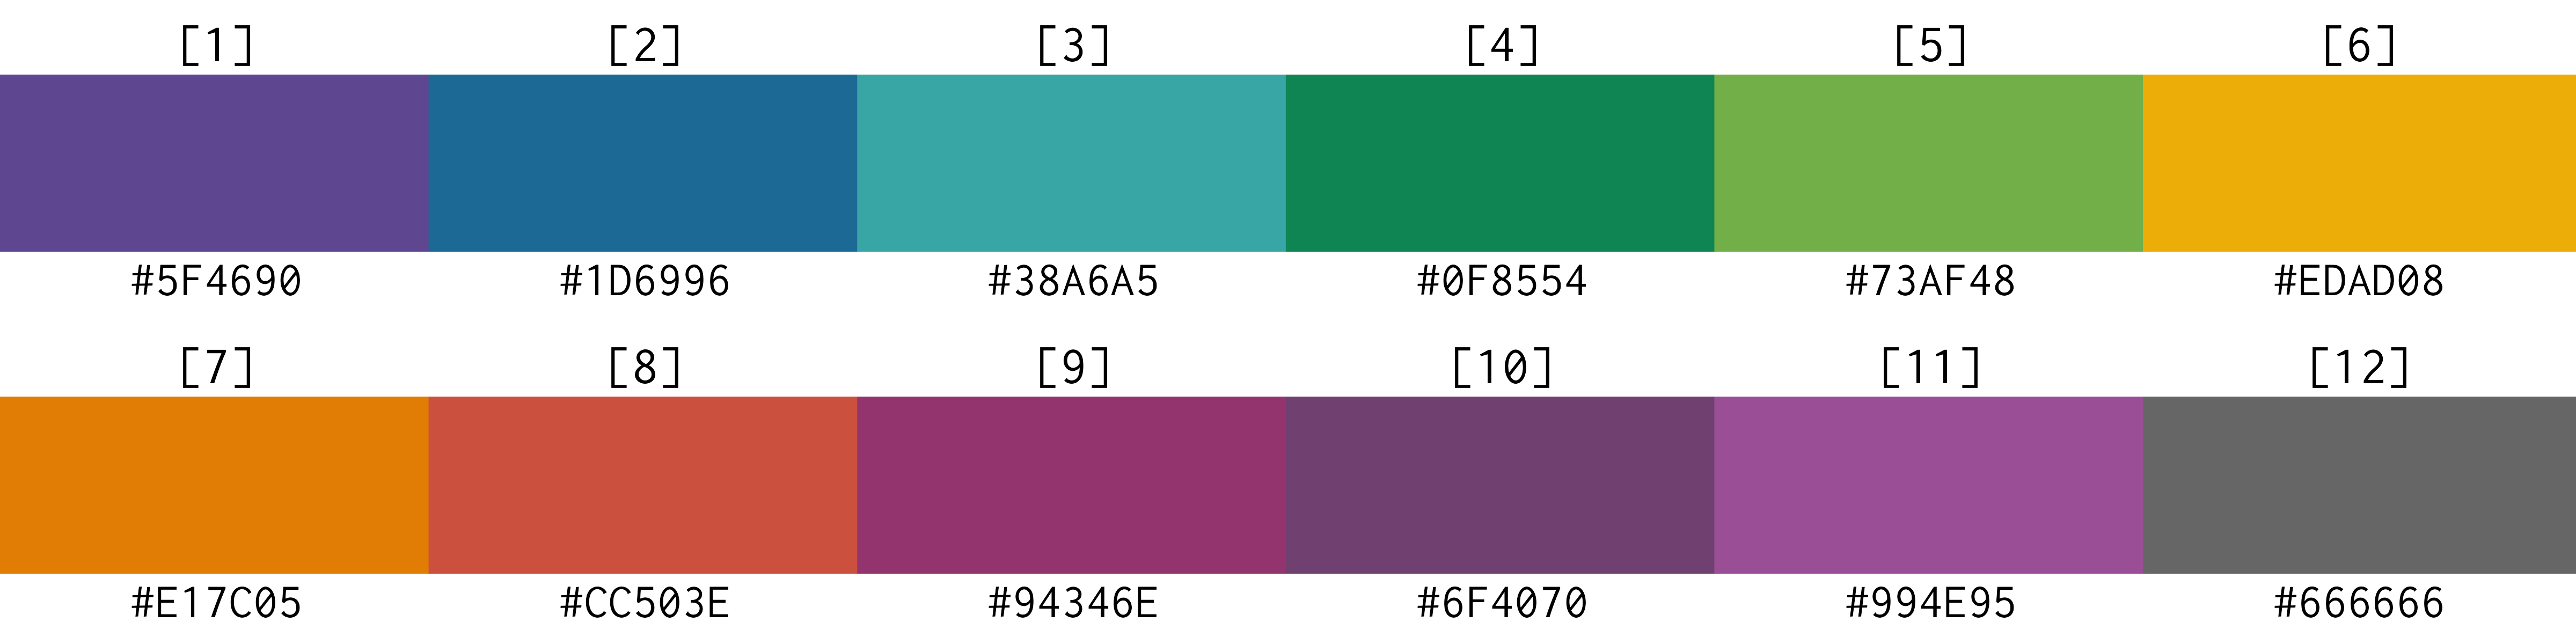
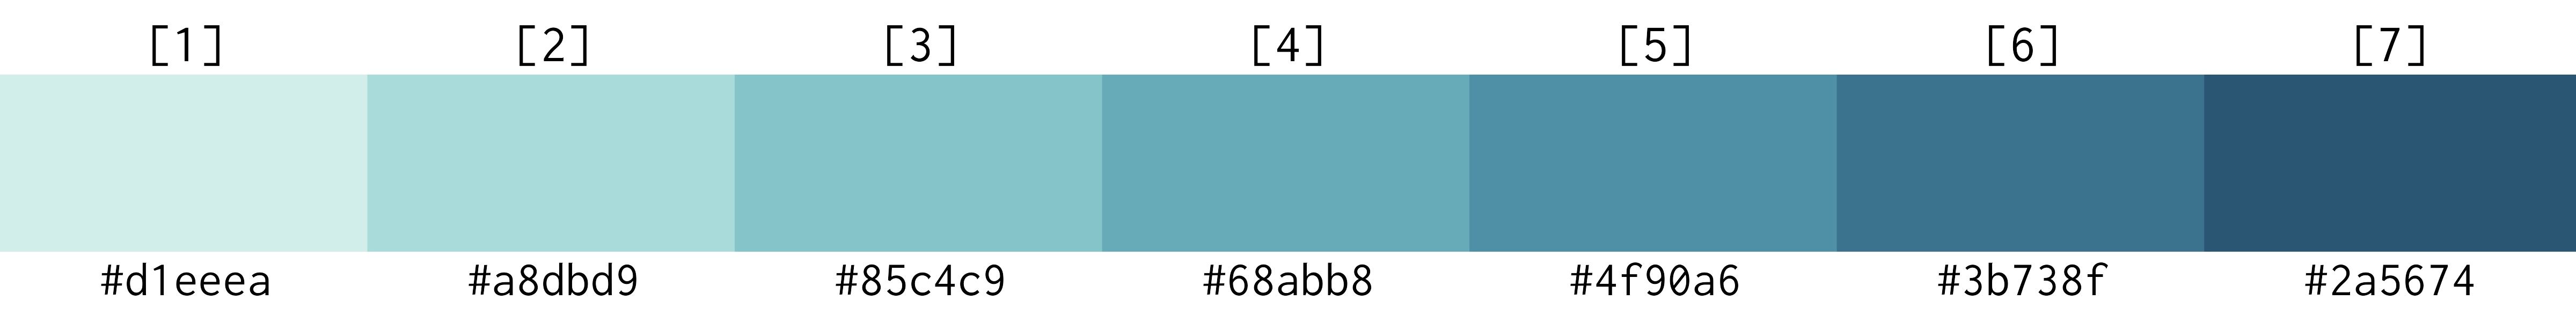
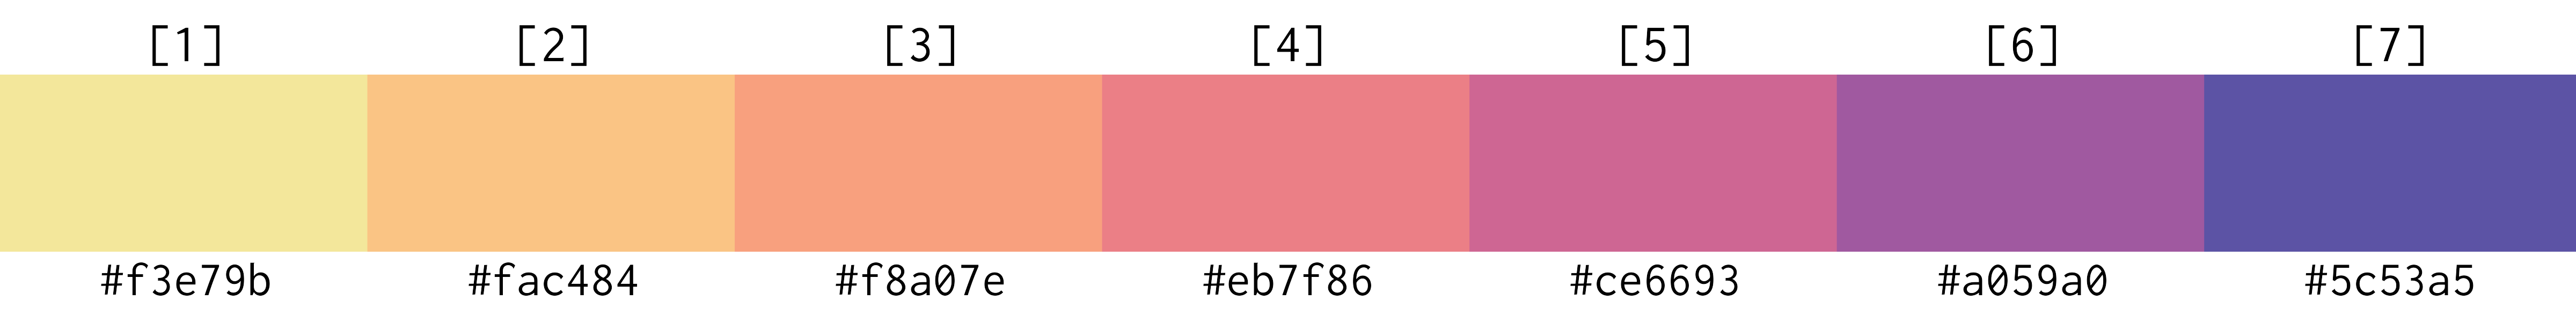
In some cases, like with plots that use geom_lineribbon(), we use a range of sequential colors. For these, we use several different sequential palettes from CARTOColors since they tend to match the color scheme from clrs$prism.
---title: "Fonts, colors, and other design details"author: "Suparna Chaudhry and Andrew Heiss"date: 2022-12-01date-modified: "`r format(Sys.time(), '%F')`"resources: - "html/linux-libertine-woff/*"format: html: toc-depth: 4---```{r load-libraries, warning=FALSE, message=FALSE}library(tidyverse)library(targets)library(scales)tar_config_set(store = here::here('_targets'),script = here::here('_targets.R'))# Load graphics functions from targetsinvisible(list2env(tar_read(graphic_functions), .GlobalEnv))show_nice_pal <-function(pal, nrow =1, show_text =TRUE) { out <-tibble(x =1:length(pal),color = pal) %>%mutate(x_nice = glue::glue("[{x}]")) %>%mutate(across(c(color, x_nice), ~fct_inorder(.))) %>%ggplot(aes(x = color, y =1, fill = color)) +geom_tile() +scale_x_discrete(expand =c(0, 0)) +scale_fill_identity() +facet_wrap(vars(x_nice), scales ="free_x", nrow = nrow) +theme_void(base_family ="Inconsolata") +theme(panel.spacing.x =unit(-1, units ="pt"),panel.spacing.y =unit(-0.5, units ="lines"),strip.text =element_blank())if (show_text) { out <- out +theme(axis.text.x =element_text(margin =margin(b =5)),strip.text =element_text(size =rel(1.1), margin =margin(t =5)),panel.spacing.y =unit(0, units ="lines")) }return(out)}```# Fonts```{scss echo=FALSE}@import url('https://fonts.googleapis.com/css2?family=Inter&display=swap');@font-face { font-family: 'Linux Libertine O'; font-style: normal; font-weight: normal; src: local('Linux Libertine O Regular'), url('/notebook/html/linux-libertine-woff/LinLibertine_R.woff') format('woff');}@font-face { font-family: 'Linux Libertine O'; font-style: italic; font-weight: normal; src: local('Linux Libertine O Italic'), url('/notebook/html/linux-libertine-woff/LinLibertine_RI.woff') format('woff');}@font-face { font-family: 'Linux Libertine O'; font-style: normal; font-weight: bold; src: local('Linux Libertine O Bold'), url('/notebook/html/linux-libertine-woff/LinLibertine_RB.woff') format('woff');}@font-face { font-family: 'Linux Libertine O Bold'; font-style: italic; font-weight: bold; src: local('Linux Libertine O Bold Italic'), url('LinLibertine_RBI.woff') format('woff');}.font-example { background: #ffffff; padding: 1.5em 1.5em 0.75em 1.5em; margin-bottom: 1rem; border-left: 10px solid #68abb8; border-top: 1px solid #68abb8; border-right: 1px solid #68abb8; border-bottom: 1px solid #68abb8; font-size: 1.1em;}.inter { font-family: "Inter";}.libertine { font-family: "Linux Libertine O Regular"; font-size: 1.2em;}```We use [Inter](https://rsms.me/inter/) (accessible for free from [Google Fonts](https://fonts.google.com/specimen/Inter)) as the main font in all our plots. ::: {.font-example .inter}**Inter**Whereas recognition of the *inherent dignity* and of the ***equal and inalienable*** rights of all members of the human family is the foundation of freedom, justice and peace in the world…:::In the fancy preprint version of our manuscript we use [Linux Libertine](https://en.wikipedia.org/wiki/Linux_Libertine) for the main body font, since it fits with [Libertinus Math](https://github.com/alerque/libertinus) for fancier math typesetting.::: {.font-example .libertine}**Linux Libertine**Whereas recognition of the *inherent dignity* and of the ***equal and inalienable*** rights of all members of the human family is the foundation of freedom, justice and peace in the world…:::# Colors## Prism (`clrs$Prism`)```{r show-prism-short, fig.width=8, fig.height=0.2}#| out-width: 100%#| echo: falseclrs$Prism %>%show_nice_pal(show_text =FALSE, nrow =1)```Our main palette is the [qualitative Prism palette from CARTOColors](https://carto.com/carto-colors/). CARTOColors palettes were designed for data-focused map visualizations,but can be used in any kind of visualization, similar to [ColorBrewer](http://colorbrewer2.org/).Access the palette using `clrs$Prism`, and access specific colors with indexes like `clrs$Prism[8]`:```{r show-prism, fig.width=8, fig.height=2}#| out-width: 100%#| echo: falseclrs$Prism %>%show_nice_pal(show_text =TRUE, nrow =2)``````{r hex-prism}#| code-fold: showclrs$Prism %>%set_names(1:length(.))```\ ## Single-ish-color sequential palettesIn some cases, like with plots that use `geom_lineribbon()`, we use a range of sequential colors. For these, we use several different [sequential palettes from CARTOColors](https://carto.com/carto-colors/) since they tend to match the color scheme from `clrs$prism`.### Emerald (`clrs$Emrld`)```{r show-emrld, fig.width=8, fig.height=1}#| out-width: 100%#| echo: falseclrs$Emrld %>%show_nice_pal(show_text =TRUE)``````{r hex-emrld}#| code-fold: showclrs$Emrld %>%set_names(1:length(.))```\ ### Purple orange (`clrs$PurpOr`)```{r show-purpor, fig.width=8, fig.height=1}#| out-width: 100%#| echo: falseclrs$PurpOr %>%show_nice_pal(show_text =TRUE)``````{r hex-purpor}#| code-fold: showclrs$PurpOr %>%set_names(1:length(.))```\ ### Teal (`clrs$Teal`)```{r show-teal, fig.width=8, fig.height=1}#| out-width: 100%#| echo: falseclrs$Teal %>%show_nice_pal(show_text =TRUE)``````{r hex-teal}#| code-fold: showclrs$Teal %>%set_names(1:length(.))```\ ### Peach (`clrs$Peach`)```{r show-peach, fig.width=8, fig.height=1}#| out-width: 100%#| echo: falseclrs$Peach %>%show_nice_pal(show_text =TRUE)``````{r hex-peach}#| code-fold: showclrs$Peach %>%set_names(1:length(.))```\ ### Sunset (`clrs$Sunset`)```{r show-sunset, fig.width=8, fig.height=1}#| out-width: 100%#| echo: falseclrs$Sunset %>%show_nice_pal(show_text =TRUE)``````{r hex-sunset}#| code-fold: showclrs$Sunset %>%set_names(1:length(.))```