ACS master list
The US Census’s American Community Survey (ACS) has a massive wealth of data at a highly granular block group-level, but getting and processing that data can be a pain. The {tidycensus} R package makes it really easy to retrieve data from the Census’s API, but we need to feed it a list of cryptic variable IDs based on specific ACS tables. Additionally, to calculate percentages within each block group, we need to grab a denominator and different components of a numerator for each variable of interest.
This document summarizes all the variables we collect from the ACS and shows each of the components from the different tables, as well as the formulas we use to combine the different components and convert them to percentages. We also include a link to the documentation for each ACS table at Census Reporter.
We built this list by searching through Census Reporter and {tidycensus}’s internal database of ACS variables, accessible with this R code:
acs_possible_vars <- tidycensus::load_variables(2019, "acs5", cache = TRUE)(I borrowed the idea for this master document from Anthony Holmes’s script for creating an Adaptive Capacity Index)
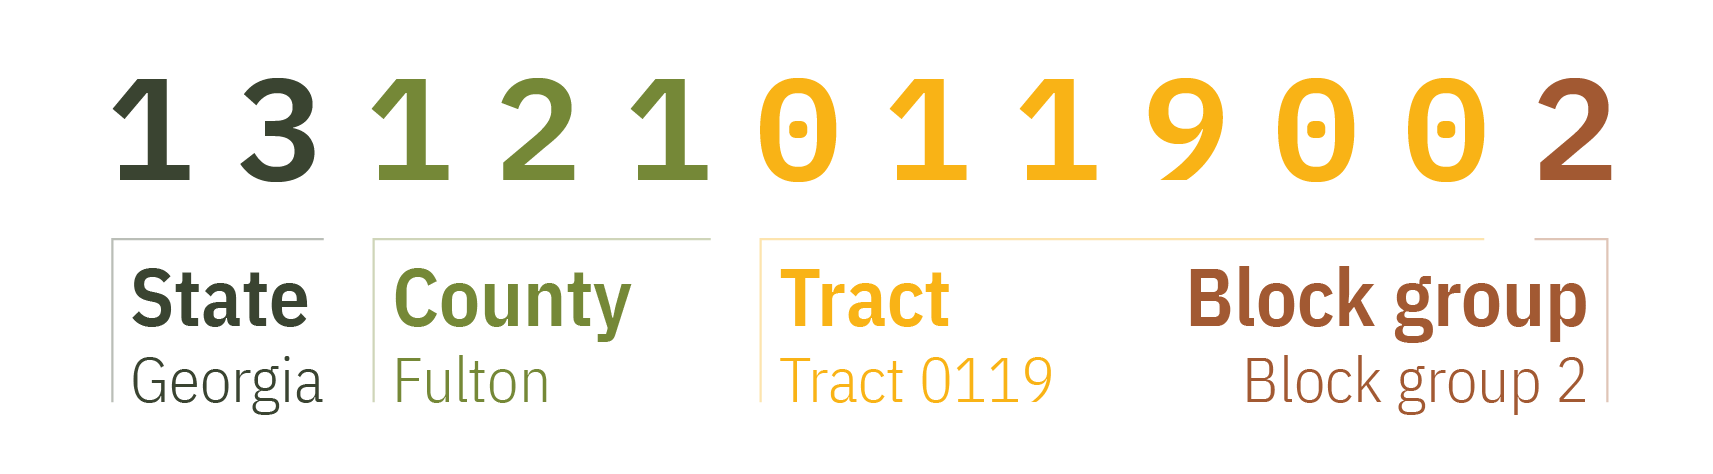
Census geography hierarchy
But first, because I can never remember how tracts and block groups fit within the Census’s hierarchy of geographies, here’s a visual reminder of how the 12-digit FIPS GEOID codes work. Block groups are nested inside tracts, which are nested inside counties, which are nested inside states. (This table is helpful too.)
Data cleaning
The actual data collection and cleaning is coordinated with {targets}, so none of the code runs in this document. For reference, though, here’s the R code that processes everything.
All the variable names are stored in a CSV file at data/manual-data/acs_vars.csv. The data cleaning function uses the list of names from the CSV file to create the Census API call.
Show the first few rows of acs_vars.csv
readr::read_csv(here::here("data", "manual-data", "acs_vars.csv"),
                show_col_types = FALSE)
## # A tibble: 93 × 5
##    type   variable       name       census_description                 geography
##    <chr>  <chr>          <chr>      <chr>                              <chr>
##  1 Social Marital status B12001_001 Estimate!!Total                    block gr…
##  2 Social Marital status B12001_004 Estimate!!Total:!!Male:!!Now marr… block gr…
##  3 Social Marital status B12001_013 Estimate!!Total:!!Female:!!Now ma… block gr…
##  4 Social Children       B11005_001 Estimate!!Total                    block gr…
##  5 Social Children       B11005_002 Estimate!!Total:!!Households with… block gr…
##  6 Social Education      B15003_001 Estimate!!Total                    block gr…
##  7 Social Education      B15003_017 Estimate!!Total:!!Regular high sc… block gr…
##  8 Social Education      B15003_018 Estimate!!Total!!GED or alternati… block gr…
##  9 Social Education      B15003_019 Estimate!!Total!!Some college, le… block gr…
## 10 Social Education      B15003_020 Estimate!!Total!!Some college, 1 … block gr…
## # ℹ 83 more rows
The actual data collection and processing happens in R/funs_acs_data.R:
Show the R code for accessing and cleaning the ACS data
clean_acs_data <- function(acs_vars_file) {
  library(tidycensus)

  acs_vars <- read_csv(acs_vars_file, show_col_types = FALSE)

  acs_raw_bg <- get_acs(
    geography = "block group",
    variables = filter(acs_vars, geography == "block group")$name,
    state = 53, year = 2019, survey = "acs5"
  )

  acs_raw_tract <- get_acs(
    geography = "tract",
    variables = filter(acs_vars, geography == "tract")$name,
    state = 53, year = 2019, survey = "acs5"
  )

  acs_bg <- acs_raw_bg %>%
    select(-NAME, -moe) %>%
    pivot_wider(names_from = "variable", values_from = "estimate") %>%
    mutate(
      bg_pct_married = (B12001_004 + B12001_013) / B12001_001,
      bg_pct_kids = B11005_002 / B11005_001,
      bg_pct_hs_plus = (B15003_017 + B15003_018 + B15003_019 + B15003_020 + B15003_021 +
                          B15003_022 + B15003_023 + B15003_024 + B15003_025) / B15003_001,
      bg_pct_enrolled_college = (B14002_019 + B14002_022 + B14002_043 + B14002_046) / B14002_001,
      bg_pct_veteran = B21001_002 / B21001_001,
      bg_pct_computer_internet = B28003_004 / B28003_001,
      bg_income_percapita = B19301_001,
      bg_pct_employed = B23025_002 / B23025_001,
      bg_pct_commute_public = B08301_010 / B08301_001,
      bg_pct_work_home = B08301_021 / B08301_001,
      bg_pct_ind_construction = (C24030_006 + C24030_033) / C24030_001,
      bg_pct_ind_manufacturing = (C24030_007 + C24030_034) / C24030_001,
      bg_pct_ind_retail = (C24030_009 + C24030_036) / C24030_001,
      bg_pct_ind_edu_health_social = (C24030_021 + C24030_048) / C24030_001,
      bg_pct_ind_acc_food = (C24030_026 + C24030_053) / C24030_001,
      bg_pct_ind_covid = (C24030_006 + C24030_033 + C24030_007 + C24030_034 +
                            C24030_009 + C24030_036 + C24030_021 + C24030_048 +
                            C24030_026 + C24030_053) / C24030_001,
      bg_pct_uninsured = (B27010_017 + B27010_033 + B27010_050 + B27010_066) / B27010_001,
      bg_pct_poverty100 = (C17002_002 + C17002_003) / C17002_001,
      bg_pct_poverty200 = 1 - (C17002_008 / C17002_001),
      bg_high_rent = (B25070_008 + B25070_009 + B25070_010) / B25070_001,
      bg_population = B01003_001,
      bg_pct_female = B01001_026 / B01001_001,
      bg_pct_working_age = (B01001_007 + B01001_008 + B01001_009 + B01001_010 + B01001_011 +
                              B01001_012 + B01001_013 + B01001_014 + B01001_015 + B01001_016 +
                              B01001_017 + B01001_018 + B01001_019 + B01001_020 +
                              B01001_031 + B01001_032 + B01001_033 + B01001_034 + B01001_035 +
                              B01001_036 + B01001_037 + B01001_038 + B01001_039 + B01001_040 +
                              B01001_041 + B01001_042 + B01001_043 + B01001_044) / B01001_001,
      bg_pct_nonwhite = 1 - (B03002_003 / B03002_001)
    ) %>%
    mutate(tract = str_sub(GEOID, start = 1, end = -2)) %>%
    select(GEOID, tract, starts_with("bg_")) %>%
    mutate(across(starts_with("bg_"), ~ifelse(is.nan(.), 0, .)))

  acs_tract <- acs_raw_tract %>%
    select(-NAME, -moe) %>%
    pivot_wider(names_from = "variable", values_from = "estimate") %>%
    mutate(
      tr_pct_snap = B22003_002 / B22003_001,
      tr_pct_no_car = B08014_002 / B08014_001
    ) %>%
    select(GEOID, starts_with("tr_")) %>%
    mutate(across(starts_with("tr_"), ~ifelse(is.nan(.), 0, .)))

  # This joins the tract-level values to the block group-level rows, which isn't
  # ideal, but it'll have to do for these two tract-level variables
  acs_clean <- acs_bg %>%
    left_join(acs_tract, by = join_by(tract == GEOID))

  return(acs_clean)
}
Block group-level variables
Economic variables
Per capita income
Table B19301: Per Capita Income Census Reporter
Formula:
B19301_001Components:
B19301_001: Estimate!!Per capita income in the past 12 months (in 2020 inflation-adjusted dollars)
Employment status
Table B23025: Employment Status Census Reporter
Formula:
B23025_002 / B23025_001Components:
B23025_001: Estimate!!TotalB23025_002: Estimate!!Total:!!In labor force
Commuting with public transportation
Table C08301: Means of Transportation to Work Census Reporter
Formula:
B08301_010 / B08301_001Components:
B08301_001: Estimate!!TotalB08301_010: Estimate!!Total:!!Public transportation (excluding taxicab)
Working from home
Table C08301: Means of Transportation to Work Census Reporter
Formula:
B08301_021 / B08301_001Components:
B08301_001: Estimate!!TotalB08301_021: Estimate!!Total:!!Worked from home
Working in construction
Table C24030: Sex by Industry for the Civilian Population Census Reporter
Formula:
(C24030_006 + C24030_033) / C24030_001Components:
C24030_001: Estimate!!TotalC24030_006: Estimate!!Total:!!Male:!!ConstructionC24030_033: Estimate!!Total:!!Female:!!Construction
Working in manufacturing
Table C24030: Sex by Industry for the Civilian Population Census Reporter
Formula:
(C24030_007 + C24030_034) / C24030_001Components:
C24030_001: Estimate!!TotalC24030_007: Estimate!!Total:!!Male:!!ManufacturingC24030_034: Estimate!!Total:!!Female:!!Manufacturing
Working in retail trade
Table C24030: Sex by Industry for the Civilian Population Census Reporter
Formula:
(C24030_009 + C24030_036) / C24030_001Components:
C24030_001: Estimate!!TotalC24030_009: Estimate!!Total:!!Male:!!Retail tradeC24030_036: Estimate!!Total:!!Female:!!Retail trade
Working in accommodation and food services
Table C24030: Sex by Industry for the Civilian Population Census Reporter
Formula:
(C24030_026 + C24030_053) / C24030_001Components:
C24030_001: Estimate!!TotalC24030_026: Estimate!!Total:!!Male:!!Arts, entertainment, and recreation, and accommodation and food services:!!Accommodation and food servicesC24030_053: Estimate!!Total:!!Female:!!Arts, entertainment, and recreation, and accommodation and food services:!!Accommodation and food services
Working in high-COVID-risk industries
Table C24030: Sex by Industry for the Civilian Population Census Reporter
Formula:
(C24030_006 + C24030_033 + C24030_007 + C24030_034 +
 C24030_009 + C24030_036 + C24030_021 + C24030_048 +
 C24030_026 + C24030_053) / C24030_001
Components:
C24030_001: Estimate!!TotalC24030_006: Estimate!!Total:!!Male:!!ConstructionC24030_033: Estimate!!Total:!!Female:!!ConstructionC24030_007: Estimate!!Total:!!Male:!!ManufacturingC24030_034: Estimate!!Total:!!Female:!!ManufacturingC24030_009: Estimate!!Total:!!Male:!!Retail tradeC24030_036: Estimate!!Total:!!Female:!!Retail tradeC24030_021: Estimate!!Total:!!Male:!!Educational services, and health care and social assistanceC24030_048: Estimate!!Total:!!Female:!!Educational services, and health care and social assistanceC24030_026: Estimate!!Total:!!Male:!!Arts, entertainment, and recreation, and accommodation and food services:!!Accommodation and food servicesC24030_053: Estimate!!Total:!!Female:!!Arts, entertainment, and recreation, and accommodation and food services:!!Accommodation and food services
Uninsured
Table B27010: Types of Health Insurance Coverage by Age Census Reporter
Formula:
(B27010_017 + B27010_033 + B27010_050 + B27010_066) / B27010_001Components:
B27010_001: Estimate!!TotalB27010_017: Estimate!!Total:!!Under 19 years:!!No health insurance coverageB27010_033: Estimate!!Total:!!19 to 34 years:!!No health insurance coverageB27010_050: Estimate!!Total:!!35 to 64 years:!!No health insurance coverageB27010_066: Estimate!!Total:!!65 years and over:!!No health insurance coverage
Population below poverty level
Table C17002: Ratio of Income to Poverty Level Census Reporter
Formula:
(C17002_002 + C17002_003) / C17002_001Components:
C17002_001: Estimate!!Total - Ratio of Income to Poverty in the Last 12 MonthsC17002_002: Estimate!!Total!!Under .50C17002_003: Estimate!!Total!!.50 to .99
Population below 200% of the poverty level
Table C17002: Ratio of Income to Poverty Level Census Reporter
Formula:
1 - (C17002_008 / C17002_001)Components:
C17002_001: Estimate!!Total - Ratio of Income to Poverty in the Last 12 MonthsC17002_008: Estimate!!Total:!!2.00 and over
Housing variables
Rent higher than average
Table B25070: Gross Rent as a Percentage of Household Income Census Reporter
Formula:
(B25070_008 + B25070_009 + B25070_010) / B25070_001Components:
B25070_001: Estimate!!TotalB25070_008: Estimate!!Total:!!35.0 to 39.9 percentB25070_009: Estimate!!Total:!!40.0 to 49.9 percentB25070_010: Estimate!!Total:!!50.0 percent or more
Demographic variables
Total population
Table B01003: Total Population Census Reporter
Formula:
B01003_001Components:
B01003_001: Estimate!!Total
Female
Table B01001: Sex by Age Census Reporter
Formula:
B01001_026 / B01001_001Components:
B01001_001: Estimate!!TotalB01001_026: Estimate!!Total:!!Female
Age 18–66
Table B01001: Sex by Age Census Reporter
Formula:
(B01001_007 + B01001_008 + B01001_009 + B01001_010 + B01001_011 +
 B01001_012 + B01001_013 + B01001_014 + B01001_015 + B01001_016 +
 B01001_017 + B01001_018 + B01001_019 + B01001_020 +
 B01001_031 + B01001_032 + B01001_033 + B01001_034 + B01001_035 +
 B01001_036 + B01001_037 + B01001_038 + B01001_039 + B01001_040 +
 B01001_041 + B01001_042 + B01001_043 + B01001_044) / B01001_001
Components:
B01001_001: Estimate!!TotalB01001_007: Estimate!!Total:!!Male:!!18 and 19 yearsB01001_008: Estimate!!Total:!!Male:!!20 yearsB01001_009: Estimate!!Total:!!Male:!!21 yearsB01001_010: Estimate!!Total:!!Male:!!22 to 24 yearsB01001_011: Estimate!!Total:!!Male:!!25 to 29 yearsB01001_012: Estimate!!Total:!!Male:!!30 to 34 yearsB01001_013: Estimate!!Total:!!Male:!!35 to 39 yearsB01001_014: Estimate!!Total:!!Male:!!40 to 44 yearsB01001_015: Estimate!!Total:!!Male:!!45 to 49 yearsB01001_016: Estimate!!Total:!!Male:!!50 to 54 yearsB01001_017: Estimate!!Total:!!Male:!!55 to 59 yearsB01001_018: Estimate!!Total:!!Male:!!60 and 61 yearsB01001_019: Estimate!!Total:!!Male:!!62 to 64 yearsB01001_020: Estimate!!Total:!!Male:!!65 and 66 yearsB01001_031: Estimate!!Total:!!Female:!!18 and 19 yearsB01001_032: Estimate!!Total:!!Female:!!20 yearsB01001_033: Estimate!!Total:!!Female:!!21 yearsB01001_034: Estimate!!Total:!!Female:!!22 to 24 yearsB01001_035: Estimate!!Total:!!Female:!!25 to 29 yearsB01001_036: Estimate!!Total:!!Female:!!30 to 34 yearsB01001_037: Estimate!!Total:!!Female:!!35 to 39 yearsB01001_038: Estimate!!Total:!!Female:!!40 to 44 yearsB01001_039: Estimate!!Total:!!Female:!!45 to 49 yearsB01001_040: Estimate!!Total:!!Female:!!50 to 54 yearsB01001_041: Estimate!!Total:!!Female:!!55 to 59 yearsB01001_042: Estimate!!Total:!!Female:!!60 and 61 yearsB01001_043: Estimate!!Total:!!Female:!!62 to 64 yearsB01001_044: Estimate!!Total:!!Female:!!65 and 66 years
Non-white
Table B03002: Hispanic or Latino Origin by Race Census Reporter
The Census Bureau suggests using Table B03002 if you want to treat “Hispanic” as a “race-like” category (see this too).
Formula:
1 - (B03002_003 / B03002_001)Components:
B03002_001: Estimate!!TotalB03002_003: Estimate!!Total:!!Not Hispanic or Latino:!!White alone
Tract-level variables
Economic variables
Households receiving food stamps/SNAP
Table B22003: Receipt of Food Stamps/SNAP by Poverty Status for Households Census Reporter
Formula:
B22003_002 / B22003_001Components:
B22003_001: Estimate!!TotalB22003_002: Estimate!!Total:!!Household received Food Stamps/SNAP in the past 12 months
Housing variables
No vehicle available
Table B08014: Sex of Workers by Vehicles Available Census Reporter
Formula:
B08014_002 / B08014_001Components:
B08014_001: Estimate!!TotalB08014_002: Estimate!!Total:!!No vehicle available
Social variables
Married population
Table B12001: Sex by Marital Status Census Reporter
Formula:
Components:
B12001_001: Estimate!!TotalB12001_004: Estimate!!Total:!!Male:!!Now marriedB12001_013: Estimate!!Total:!!Female:!!Now marriedHouseholds with kids
Table B11005: Households by Presence of People Under 18 Years by Household Type Census Reporter
Formula:
Components:
B11005_001: Estimate!!TotalB11005_002: Estimate!!Total:!!Households with one or more people under 18 yearsHigh school education
Table B15003: Educational Attainment Census Reporter
Formula:
Components:
B15003_001: Estimate!!TotalB15003_017: Estimate!!Total:!!Regular high school diplomaB15003_018: Estimate!!Total!!GED or alternative credentialB15003_019: Estimate!!Total!!Some college, less than 1 yearB15003_020: Estimate!!Total!!Some college, 1 or more years, no degreeB15003_021: Estimate!!Total!!Associate’s degreeB15003_022: Estimate!!Total!!Bachelor’s degreeB15003_023: Estimate!!Total!!Master’s degreeB15003_024: Estimate!!Total!!Professional school degreeB15003_025: Estimate!!Total!!Doctorate degreeEnrolled in higher education
Table B14002: Sex by School Enrollment by Level of School by Type of School Census Reporter
Formula:
Components:
B14002_001: Estimate!!TotalB14002_002: Estimate!!Total:!!MaleB14002_019: Estimate!!Total:!!Male:!!Enrolled in school:!!Enrolled in college undergraduate yearsB14002_022: Estimate!!Total:!!Male:!!Enrolled in school:!!Enrolled in graduate or professional schoolB14002_026: Estimate!!Total:!!FemaleB14002_043: Estimate!!Total:!!Female:!!Enrolled in school:!!Enrolled in college undergraduate yearsB14002_046: Estimate!!Total:!!Female:!!Enrolled in school:!!Enrolled in graduate or professional schoolVeteran status
Table B21001: Sex by Age by Veteran Status for the Civilian Population 18 Years and Over Census Reporter
Formula:
Components:
B21001_001: Estimate!!TotalB21001_002: Estimate!!Total:!!VeteranHas computer with internet
Table B28003: Presence of a Computer and Type of Internet Subscription in Household Census Reporter
Formula:
Components:
B28003_001: Estimate!!TotalB28003_004: Estimate!!Total:!!Has a computer:!!With a broadband Internet subscription