
Ticket to Opportunity
How Incentives Shape Access and Equity in Public Transit for Under-Represented Riders in King County
1 Introduction
Equitable access to transportation constitutes a pivotal element in the matrix of social and economic mobility, serving as an indispensable channel for individuals from economically disadvantaged and under-represented communities to access vital services, employment opportunities, and educational facilities. The quest for transportation equity is imperative in cultivating a just and inclusive society, ensuring that every individual, irrespective of their socioeconomic standing, is afforded the opportunity to realize their full potential.
Despite widespread acknowledgment of its importance, a significant gap persists in our understanding of how various incentive structures within public transit systems impact ridership among socially and economically vulnerable populations. This gap is especially noticeable when examining the long-term effects of subsidized and fare-free transit programs on the travel behavior of low-income individuals. Bridging this gap is crucial for informing public policy, optimizing resource allocation, and ensuring equitable distribution of public transit benefits.
In pursuit of narrowing this knowledge gap, our study delves into the ramifications of diverse degrees of subsidized and fare-free transit in Seattle, Washington, with a specific focus on the One Regional Card for All (ORCA) LIFT discounted fare program. Employing an extensive dataset from the King County Metro Transit agency, we scrutinize the effects of varied levels and durations of incentives on sustained ridership behavior. This examination is further enriched by data emanating from a randomized controlled trial, conducted in collaboration with the Lab for Economic Opportunities (“LEO”) at the University of Notre Dame in 2019 and 2020, evaluating the influence of extended-duration fare-free transit passes on individuals with low income. By amalgamating census tract-level data with the American Community Survey (ACS) 5-Year Data (2009–2021), we ensure a comprehensive understanding of the under-represented populations within the community.
Our inquiry is steered by two core research questions: Firstly, in what ways do different levels and durations of incentives within the ORCA LIFT program affect the long-term ridership behavior of individuals with low income? Secondly, what impact do extended-duration fare-free transit passes exert on the ridership behavior of this demographic? Addressing these research questions is crucial for the development of an exhaustive understanding of the role of incentives in influencing transit use among low-income populations.
In this paper, we begin by exploring the demographic and geographic characteristics of King County and the King County Metro (KCM), providing essential background information. This section looks at how mobility patterns have changed due to the COVID-19 pandemic and outlines KCM’s initiatives for low-income individuals. Subsequently, we present a theoretical framework of transportation equity, exploring various dimensions of transportation equity and subsequently narrow the focus to distributional equity. A literature review then examines existing research on the impacts of transportation equity on economic mobility, social capital, and its specific implications for low-income demographics. We then go on to detail the data analysis strategy and data cleaning procedures, before presenting the main empirical analyses aimed at addressing the research questions. In the final sections of the paper we discuss the findings and outline the policy implications arising from the study.
The implications of this study are multifaceted, providing insights that are pertinent for policymakers and urban planners working towards equitable and sustainable urban development. The analysis of diverse incentive structures within public transit programs enriches the ongoing discourse on social equity and access to opportunities. Additionally, the research underscores the significance of adopting evidence-based approaches in policymaking, highlighting the need for rigor and transparency in causal inference research designs. In an era of constrained resources and rising inequality, this study lays the groundwork for future initiatives aimed at enhancing the accessibility of public transit benefits, especially for communities that are currently under-represented.
2 The Landscape of King County and King County Metro
2.1 Demographic and Geographic Context of King County
With a population surpassing 2.2 million individuals, King County is distinguished as the most populous county within the state of Washington, and it holds the 13th position in terms of population size across the United States. The county incorporates the dynamic urban center of Seattle, in addition to 38 other cities, presenting a varied landscape that encompasses urban, rural, and forested areas. The demographic profile of King County is marked by its diversity, with the majority of the population under the age of 18 being people of color, and a linguistic diversity that spans over 200 languages. King County plays a pivotal role in the socioeconomic fabric of Washington, housing approximately 30% of the state’s population, 40% of its employment opportunities, and 50% of its payroll (Brough et al., 2022). The narrative surrounding King County Metro is intricately tied to the socioeconomic disparities within the region, highlighting the indispensable role of public transit in fostering equitable access to transportation.
2.2 King County Metro Transit and RCT Data Collection
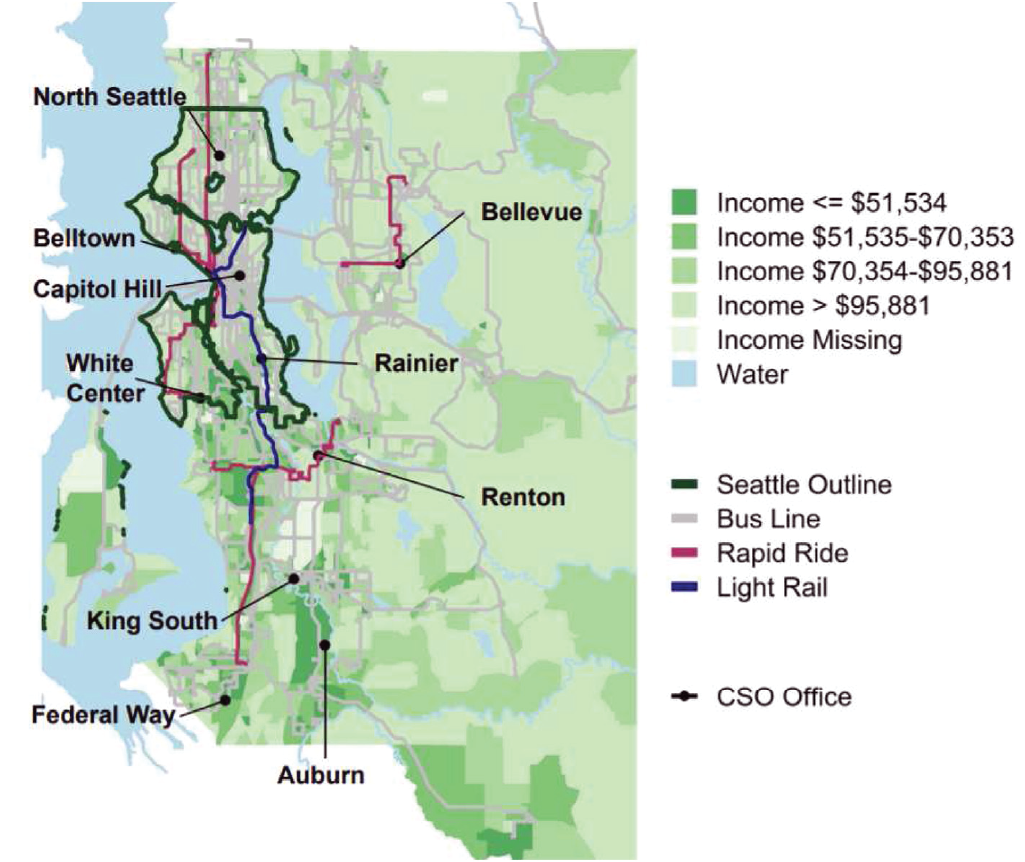
King County Metro Transit (Metro) plays a pivotal role in the transportation network of the region, catering to the diverse transit needs of the county’s residents. Prior to the onset of the pandemic, Metro was facilitating approximately 400,000 trips on an average weekday, underscoring its vital function in the daily commutes of the community (Causal Inference for Social Impact Lab (CISIL), 2021). Figure 1 provides a comprehensive visual representation of the western part of King County, served by Metro. It categorizes neighborhoods1 based on quartiles of median household income and delineates the existing transit system, including bus routes, RapidRide routes, and the light rail. This illustration serves to highlight the socioeconomic diversity of the region and the extensive reach of Metro’s services, emphasizing the reliance on public transit for commuting, especially among the working population aged 18–64 and those with income at or below 200% of the federal poverty level.
Figure 1 additionally marks the locations of the Community Service Offices (CSOs) of the Department of Social and Health Services (DSHS) in the region. The paper utilizes data gathered through a randomized controlled trial (RCT) conducted by Brough et al. (2022). This trial provided up to six months of complimentary public transit access to low-income residents of King County, targeting individuals frequenting the DSHS CSOs. DSHS in Washington administers a variety of public assistance programs, including the Supplemental Nutrition Assistance Program (SNAP) and Temporary Assistance for Needy Families (TANF). Since 2015, DSHS offices in King County have also played a role in enrolling individuals in the LIFT program. However, it is predominantly for the enrollment or renewal of food and cash benefits that DSHS clients visit the CSOs. The inclusion of CSO locations in Figure 1 offers a holistic view of the infrastructure pertinent to this study, integrating the elements of public transit and social services within King County.
2.3 The COVID-19 Pandemic: Changes in Transit and Mobility
The onset of the COVID-19 pandemic precipitated profound changes in travel behaviors globally, with King County emerging as one of the initial regions in the U.S. to bear the brunt of its impacts. The county witnessed a marked reduction in mobility, as evidenced by a 57% decrease in the average number of census block groups visited by residents between February and April 2020 (Brough et al., 2021). The utilization of public transit was subject to an even more drastic decline, plummeting by 74%. These alterations in mobility patterns were not uniformly distributed across socioeconomic groups, engendering significant concerns regarding equitable access to transportation (Brough et al., 2021). More affluent neighborhoods and individuals exhibited a more pronounced and enduring reduction in travel, prompting critical examinations of the availability of remote work options and the reliance on public transit across varied socioeconomic strata.
2.4 Metro’s Fare Policies and Commitment to Equity
In a bid to mitigate the challenges posed by the pandemic, Metro instituted a temporary suspension of all fares across its array of services, encompassing buses, water taxis, and Access paratransit, from March 21, 2020, to October 1, 2020. This strategic measure played a pivotal role in bolstering community support during these tumultuous times. Nevertheless, fare collection resumed on October 1, 2020, a period that also saw Sound Transit, another prominent transit provider in the county, suspend and subsequently reinstate fare collection (Causal Inference for Social Impact Lab (CISIL), 2021).
Metro has demonstrated an unwavering commitment to advancing transportation equity, particularly through the ORCA LIFT program, which extends discounted fares to eligible low-income riders. The program has explored a variety of incentive structures for participants, ranging from no initial load to amounts up to $50, or even several free months of transit. These incentives are instrumental as they exert a direct influence on long-term participation and engagement with low-income transit programs. In October 2020, Metro introduced a subsidized annual transit pass for residents earning at or below 80% of the Federal Poverty Level and enrolled in certain State cash benefit programs, amplifying its efforts to enhance transit accessibility for all (Causal Inference for Social Impact Lab (CISIL), 2021). The fare suspension and reinstatement period, in tandem with Metro’s initiatives to bolster support for low-income riders, provides a comprehensive backdrop for the analysis of these policies’ impacts on ridership and the broader implications for transportation equity within the region.
3 Theoretical Background
Transportation equity stands as a pivotal element in urban development, ensuring equitable access to transportation facilities for all societal segments, irrespective of socioeconomic status. This concept intertwines with various normative theories of justice and equity, such as egalitarianism, libertarianism, utilitarianism, and the capabilities approach, offering a robust framework to scrutinize and mitigate disparities in transportation access and its extensive implications on society (Lewis et al., 2021).
In the ensuing sections, this paper delves into the dimensions of transportation equity, shedding light on the integral roles of horizontal and vertical equity. Horizontal equity underscores the importance of equal treatment for individuals in analogous situations, championing consistent accessibility to transportation services. Conversely, vertical equity acknowledges the heterogeneity in individual needs and capacities, necessitating policies that extend additional support to those in less advantaged positions or with heightened needs. The discourse also encompasses distributional equity, underscoring the imperative for a balanced distribution of the benefits and burdens of transportation systems across diverse demographic groups. This nuanced examination of transportation equity serves as a foundation, facilitating a comprehensive understanding of the challenges and prospects in cultivating a just and inclusive urban mobility landscape.
3.1 Horizontal vs. Vertical Equity in Transportation
Transportation equity is manifested in both horizontal and vertical dimensions, each playing a crucial role in ensuring fair access and distribution of transportation resources (see Figure 2). Horizontal equity emphasizes the equal treatment of individuals in similar situations, advocating for uniform accessibility to transportation services (Litman, 2022). This principle is vital in transportation, as it ensures an equitable distribution of resources and opportunities, enabling access to transportation services for all individuals. Horizontal equity manifests in the equitable allocation of resources, adhering to the principle that individuals should receive benefits proportional to their contributions and bear costs commensurate with their usage (Litman, 2023). This is particularly relevant in discussions about the collection and distribution of road user taxes, as well as the equitable assignment of different vehicles to roadway costs. Additionally, horizontal equity addresses external costs, including the delays, risks, and pollution generated by travel activities, emphasizing the need to minimize or compensate for these impacts to prevent disproportionate burdens on specific population segments (Litman, 2023).
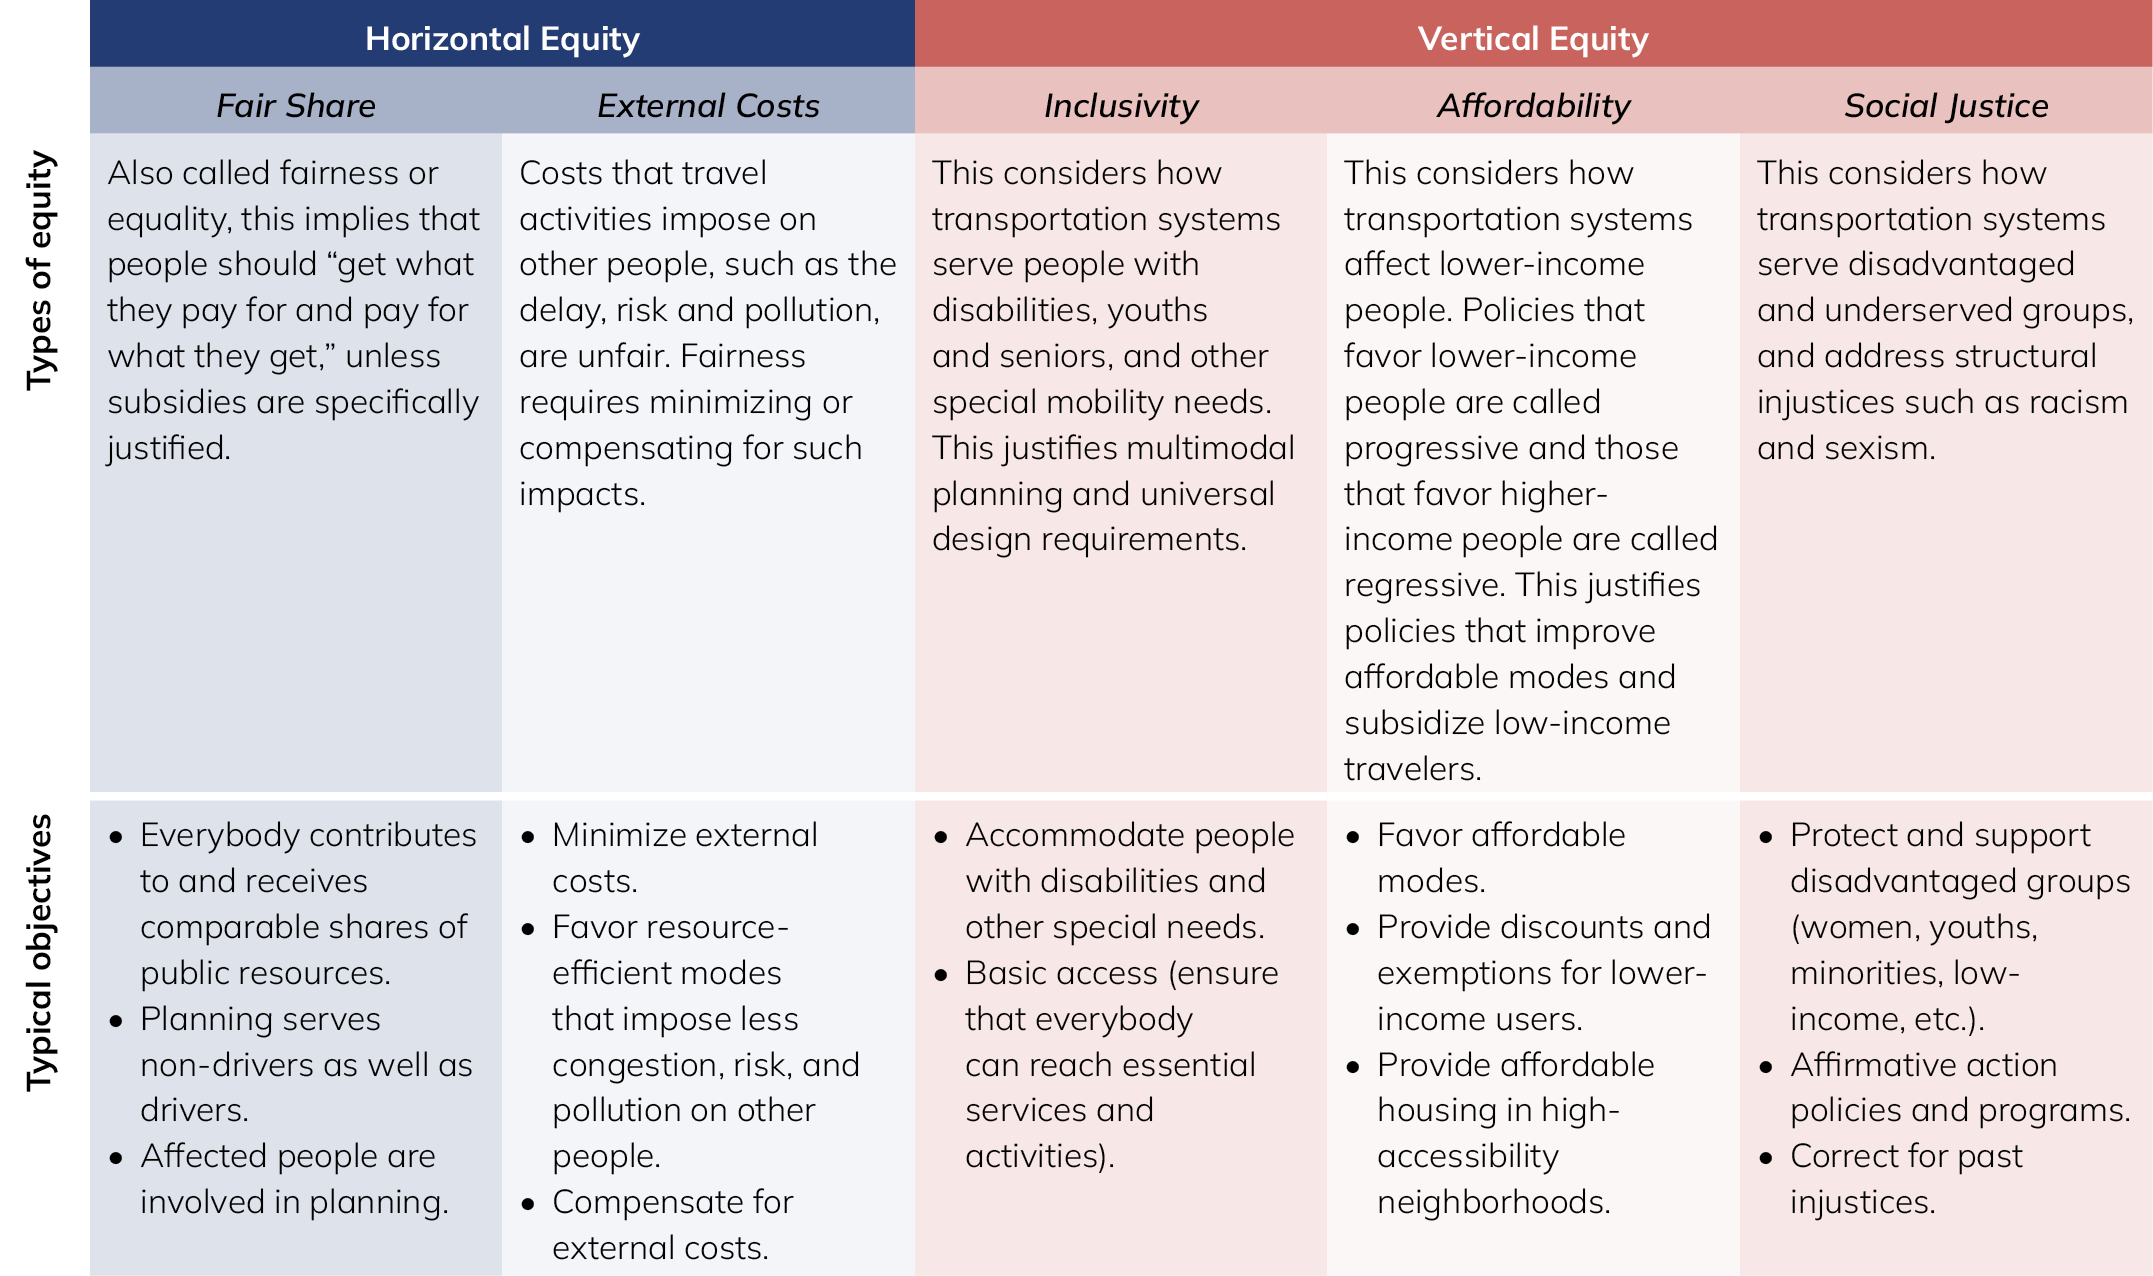
On the other hand, vertical equity recognizes the diversity in individual needs and capabilities, calling for policies that offer additional support to those in disadvantaged positions or with greater needs (Bruzzone et al., 2023). This includes considerations for low-income individuals, minority communities, and persons with disabilities, ensuring that transportation policies are inclusive and cater to the diverse needs of the urban population. Vertical equity is expressed through its focus on inclusivity, highlighting the imperative of accommodating individuals with disabilities, youths, seniors, and other groups with specialized mobility needs (Litman, 2022). It underscores the significance of multimodal planning and universal design requirements, striving for accessible transportation for all. Furthermore, vertical equity addresses affordability, scrutinizing the impacts of transportation on lower-income communities and advocating for policies that enhance affordability and provide subsidies to low-income travelers (Litman, 2023). Lastly, social justice is a central aspect of vertical equity, examining how transportation systems serve disadvantaged and underserved groups, and addressing structural injustices such as racism and sexism. It calls for a transportation system that is accessible, affordable, just, and inclusive, ensuring equal access to transportation opportunities for all individuals, irrespective of their socioeconomic status or demographic characteristics (Litman, 2023).
3.2 Distributional Equity in Transportation
Distributional equity in transportation is a crucial aspect of this study’s theoretical framework, highlighting the need for a balanced distribution of transportation-related benefits and burdens across various demographic groups. The goal is to prevent marginalized or disadvantaged groups from experiencing a disproportionate amount of negative impacts or from being excluded from the benefits provided by transportation systems (Boyd et al., 2022).
This aspect of equity requires a careful analysis of how transportation services are spatially distributed, how access to opportunities is facilitated, and how transportation policies affect different demographic groups (Boyd et al., 2022). To effectively address distributional equity, it is necessary to identify and engage with communities that have historically been underserved, understand their specific mobility needs, and include their input in transportation planning and decision-making processes (Boyd et al., 2022; Shi, 2021). This approach ensures that resources are allocated fairly, contributing to the overall well-being of the community (Boyd et al., 2022; Shi, 2021).
Additionally, distributional equity in transportation requires the integration of equity assessments into transportation decision-making processes. It calls for the inclusion of equity metrics and indicators in transportation analyses to critically evaluate the impacts of transportation initiatives on underserved communities (Boyd et al., 2022). This ensures that decision-making processes are informed and equitable, leading to a better understanding of transportation equity and its connections to various sectors, including housing, community development, governance, economic development, labor markets, food systems, and tourism (Boyd et al., 2022).
Furthermore, distributional equity emphasizes the importance of using equity analysis tools to examine the distributional effects of transportation projects (Boyd et al., 2022). These tools help identify and address potential disparities, ensuring that transportation investments benefit all community members, regardless of their socioeconomic status (Boyd et al., 2022). Through this approach, distributional equity in transportation not only addresses the immediate needs of underserved communities but also contributes to the broader goal of creating inclusive and equitable urban environments (Boyd et al., 2022; Shi, 2021).
4 Literature Review
4.2 Transportation Equity on Economic Mobility
Accessible and affordable public transit systems hold significant importance for low-income individuals, who predominantly depend on these services for their daily travel and access to employment opportunities. Several studies highlight the challenges posed by inadequate transportation, pointing out the necessity of well-connected regions to enhance economic mobility levels (Oregon Metro, 2018). The spatial distribution and accessibility of transportation services are crucial, as they link residents to a wider range of job opportunities and essential services, fostering equitable growth across different regions (Bruzzone et al., 2023).
Moreover, transportation plays a crucial role in connecting individuals to economic opportunities, with extensive transportation networks having the potential to facilitate social and economic progress (Shi, 2021). Regions with robust connectivity are instrumental in promoting higher levels of economic mobility, ensuring that the benefits of economic development are not confined to specific areas or demographic groups. This approach contributes to a more balanced and inclusive economic landscape, promoting equitable growth and development across various regions.
4.3 Transportation Equity for Minority and Low-Income Communities
Transportation inequities disproportionately affect minority and low-income communities, subjecting them to longer commute times, higher transportation costs, and reduced access to opportunities. Carter et al. (2013) provides a comprehensive analysis of these challenges, calling for targeted interventions and policies to mitigate these issues. Litman (2023) further emphasizes the need for a holistic approach to address transportation challenges, integrating equity considerations into transportation planning and policy-making. This involves a concerted effort from various stakeholders to implement targeted interventions, improve transportation accessibility, and foster a more inclusive urban environment.
5 Hypotheses and data
Draft in progress!
This section is incredibly draft-y still—apologies!
Over the past couple decades, King County Metro has worked to improve transportation access throughout its service area and to address transportation equity by increasing the accessibility and affordability of its services. In March 2017, Metro began collecting transit use data for lower income individuals that the agency planned on studying. In March 2019, the agency randomly assigned residents who had used transit services during the preceding two years to receive a special ORCA LIFT half-price fare card. For two-thirds of card recipients (the control group), the card also came preloaded with $10 of free trips. For the remaining one-third (the treatment group), the card came preloaded with one of several possible larger incentives: $15, $20, $30, $50, $70, a monthly pass, or a subsidized annual pass for unlimited fare-free transportation on the Metro bus and light rail system. A second wave of the experiment was launched in December 2019 and ended in April 2020, but was interrupted by the COVID-19 pandemic, since Metro temporarily suspended all transportation fares in response to pandemic-related social lockdowns.
King County Metro’s unique circumstances—a researcher-run experiment interrupted by a pandemic—provides us with a novel opportunity to measure the causal effect of policies designed to enhance transportation equity. Do government subsidies increase overall usage of the public transportation system in the future? Does this encourage further participation in transit-oriented social programs? In this paper, we interested in the effect of different levels of incentives and subsidized passes on overall Metro usage and enrollment in Metro’s equity-focused subsidized LIFT program. Using data collected by King County, we test four hypotheses related to two different policy treatments and two different outcomes (see Table 1).
| Hypothesis | Treatments | Outcomes | |
|---|---|---|---|
| H1 | If transit agencies provide larger incentives, riders will reload passes with higher values and with greater frequency in the future. | Four levels of incentives: (1) $10, (2) >$10, (3) shorter pass, (4) subsidized annual pass | Three measures of future use after six months: (1) binary pass reloading, (2) total value of reloadings, (3) total count of reloadings |
| H2 | If transit agencies provide larger incentives, lower-income riders will re-enroll in specially designed programs like ORCA LIFT. | Four levels of incentives: (1) $10, (2) >$10, (3) shorter pass, (4) subsidized annual pass | Binary reenrollment in ORCA LIFT |
| H3 | If transit agencies provide subsidized passes, riders will reload passes with higher values and with greater frequency in the future. | Subsidized annual pass | Three measures of future use after six months: (1) binary pass reloading, (2) total value of reloadings, (3) total count of reloadings |
| H4 | If transit agencies provide subsidized passes, lower-income riders will re-enroll in specially designed programs like ORCA LIFT. | Subsidized annual pass | Binary reenrollment in ORCA LIFT |
All our treatment variables and our outcome variables come from King County Metro’s two experimental waves. As seen in Table 1, we analyze incentive treatments in two ways: (1) the increase in intensity of incentives, ranging from $10 to a subsidized annual pass, and (2) the offering of a subsidized annual pass, the most intense incentive possible. Similarly, we measure the outcome of transit use six months after the experiment in two ways: (1) a binary indicator of whether the pass was reloaded, the total value of pass reloadings, and the total count of pass reloadings, and (2) a binary indicator of whether the rider reenrolled in the subsidized ORCA LIFT program.
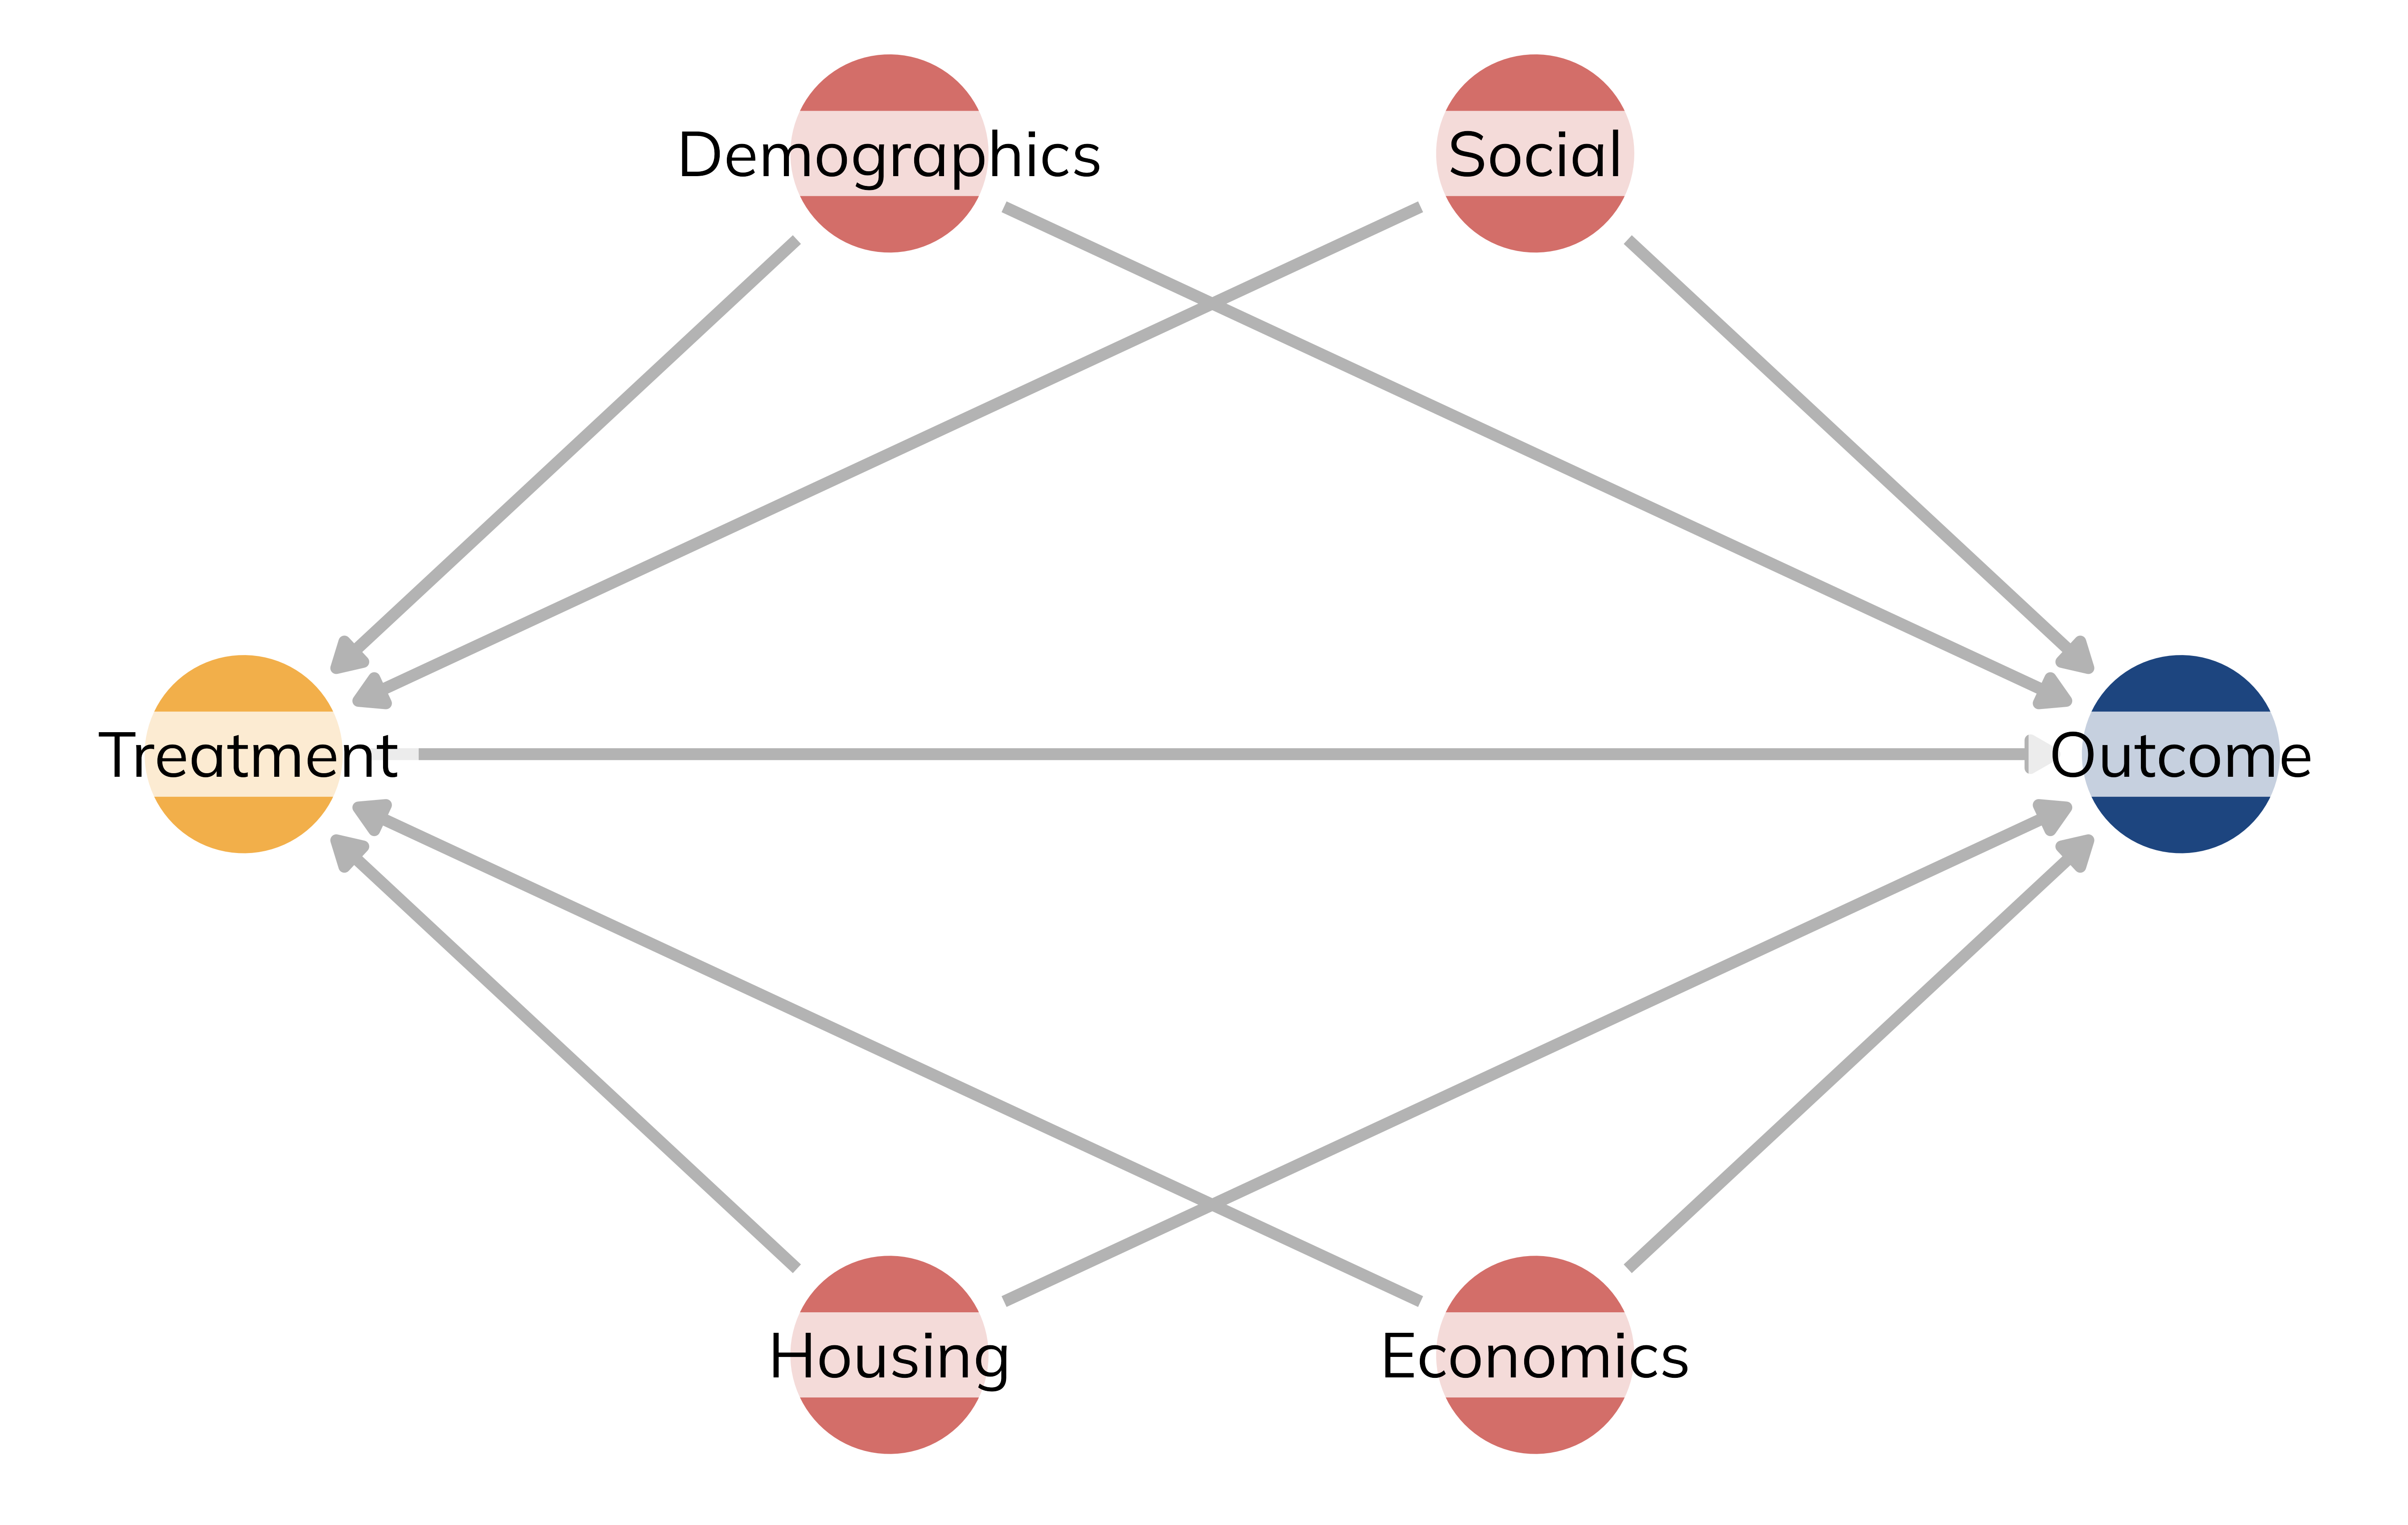
The King County experiment was not a clean randomized control trial (RCT) due to the interruption of COVID-19 pandemic and due self-selection bias—only those who were already enrolled in a subsidized program in 2017 and tracked by the agency were eligible for either the control or treatment condition. Accordingly, we cannot analyze the data as an RCT and must instead take account of statistical confounding. To help isolate the causal effect of the different treatments on our two outcomes, we first created a directed acyclic graph (DAG) to map out the relationship between treatment, outcome, and general phenomena that jointly cause—and therefore confound—both selection into the treatment condition and outcomes like pass reloading and program reenrollment (see Figure 3). We then collected data to serve as proxies of these different categories of demographic, social, economic, and housing-related confounders from both King County’s internal administrative data and the US Census’s American Community Survey (ACS) (see Table 2).
| Variable | Source | Level |
|---|---|---|
| Demographics | ||
| Age | King County | Individual |
| Race | King County | Individual |
| Language | King County | Individual |
| Population | ACS | Block group |
| % female | ACS | Block group |
| % nonwhite | ACS | Block group |
| % working age | ACS | Block group |
| Social | ||
| % married | ACS | Block group |
| % with kids | ACS | Block group |
| % with high school education | ACS | Block group |
| % enrolled in college | ACS | Block group |
| % veterans | ACS | Block group |
| % with access to the internet | ACS | Block group |
| Housing | ||
| % with high rent | ACS | Block group |
| % with no car | ACS | Tract |
| Economic | ||
| % employed | ACS | Block group |
| % uninsured | ACS | Block group |
| % per capita | ACS | Block group |
| % commuting using public transportation | ACS | Block group |
| % working from home | ACS | Block group |
| % working in an industry heavily affected by COVID* | ACS | Block group |
| % below 200% of the poverty line | ACS | Block group |
| % below 100% of the poverty line | ACS | Block group |
| % using SNAP | ACS | Tract |
| * This includes the proportion of the block group working in construction; manufacturing; retail trade; education, health care, and social assistance; and accommodation and food services. | ||
We then used the rules of do-calculus (Heiss, 2021; Pearl & Mackenzie, 2020) to identify sets of variables that would, following statistical adjustment, remove the confounding caused by these additional variables in the causal system. After statistical adjustment, the pathway between the treatment and outcome nodes should be isolated, yielding an identified causal effect.
We undertake this statistical adjustment through inverse probability weighting (IPW), following a three stage process:
- Use each of the confounders to estimate the probability of selection into the treatment using a multinomial logistic regression model (McCaffrey et al., 2013) for the intensity-of-incentives treatment for H1 and H2 and using a logistic regression model for the subsidized annual pass treatment for H3 and H4.
- Use each individual propensity score to calculate inverse probability weights. This creates a balanced pseduo-population where people in the treatment and control groups are statistically comparable and unconfounded.
- Estimate a weighted regression model of the effect of the treatment on the outcome using the inverse probability weights. The marginal effect of the treatment variable represents the unconfounded causal effect of the treatment.
6 Results and discussion
Not finished
This section not yet complete. We show main results below, but that’s all—there’s no discussion of the IPW pseudo populations, covariate/confounder balance, treatment model results, or any robustness checks. Just pictures for now.
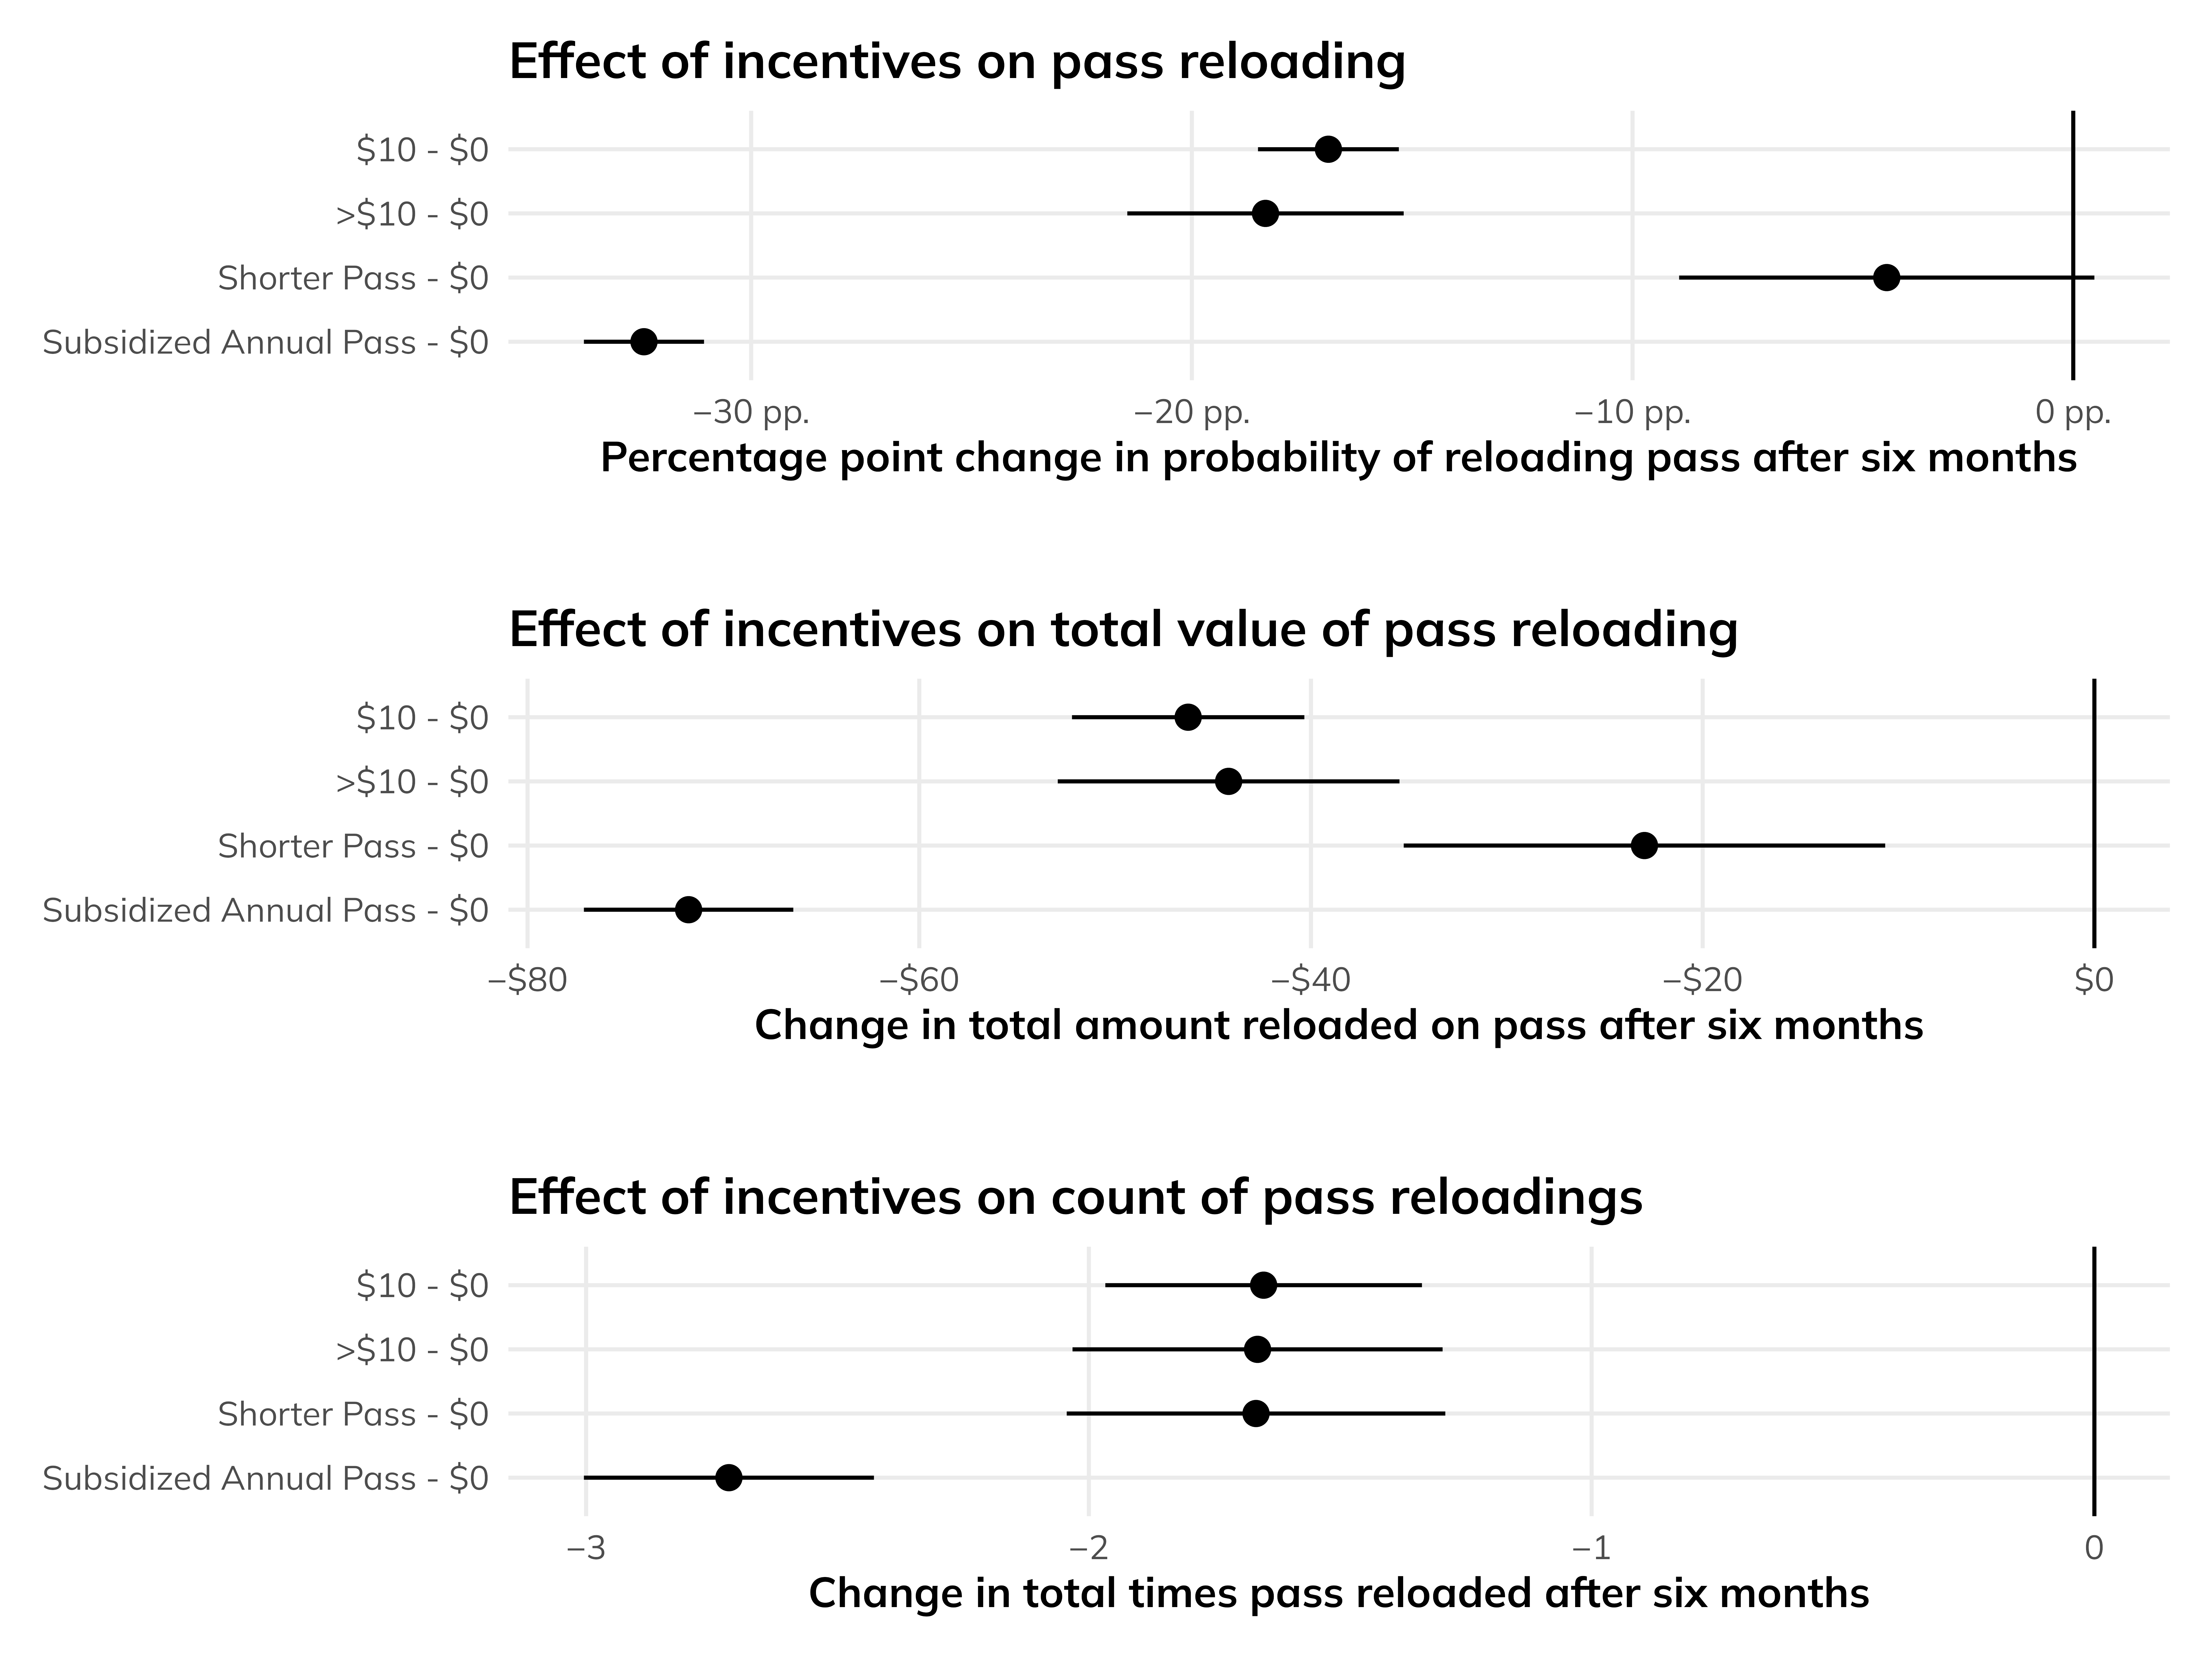
6.1 H1: Incentives and reloading
Puzzling result in Figure 4! Treatment effect is consistently negative! Time frame might be too short? COVID distorting things? People really don’t use transit as much after the treatment?
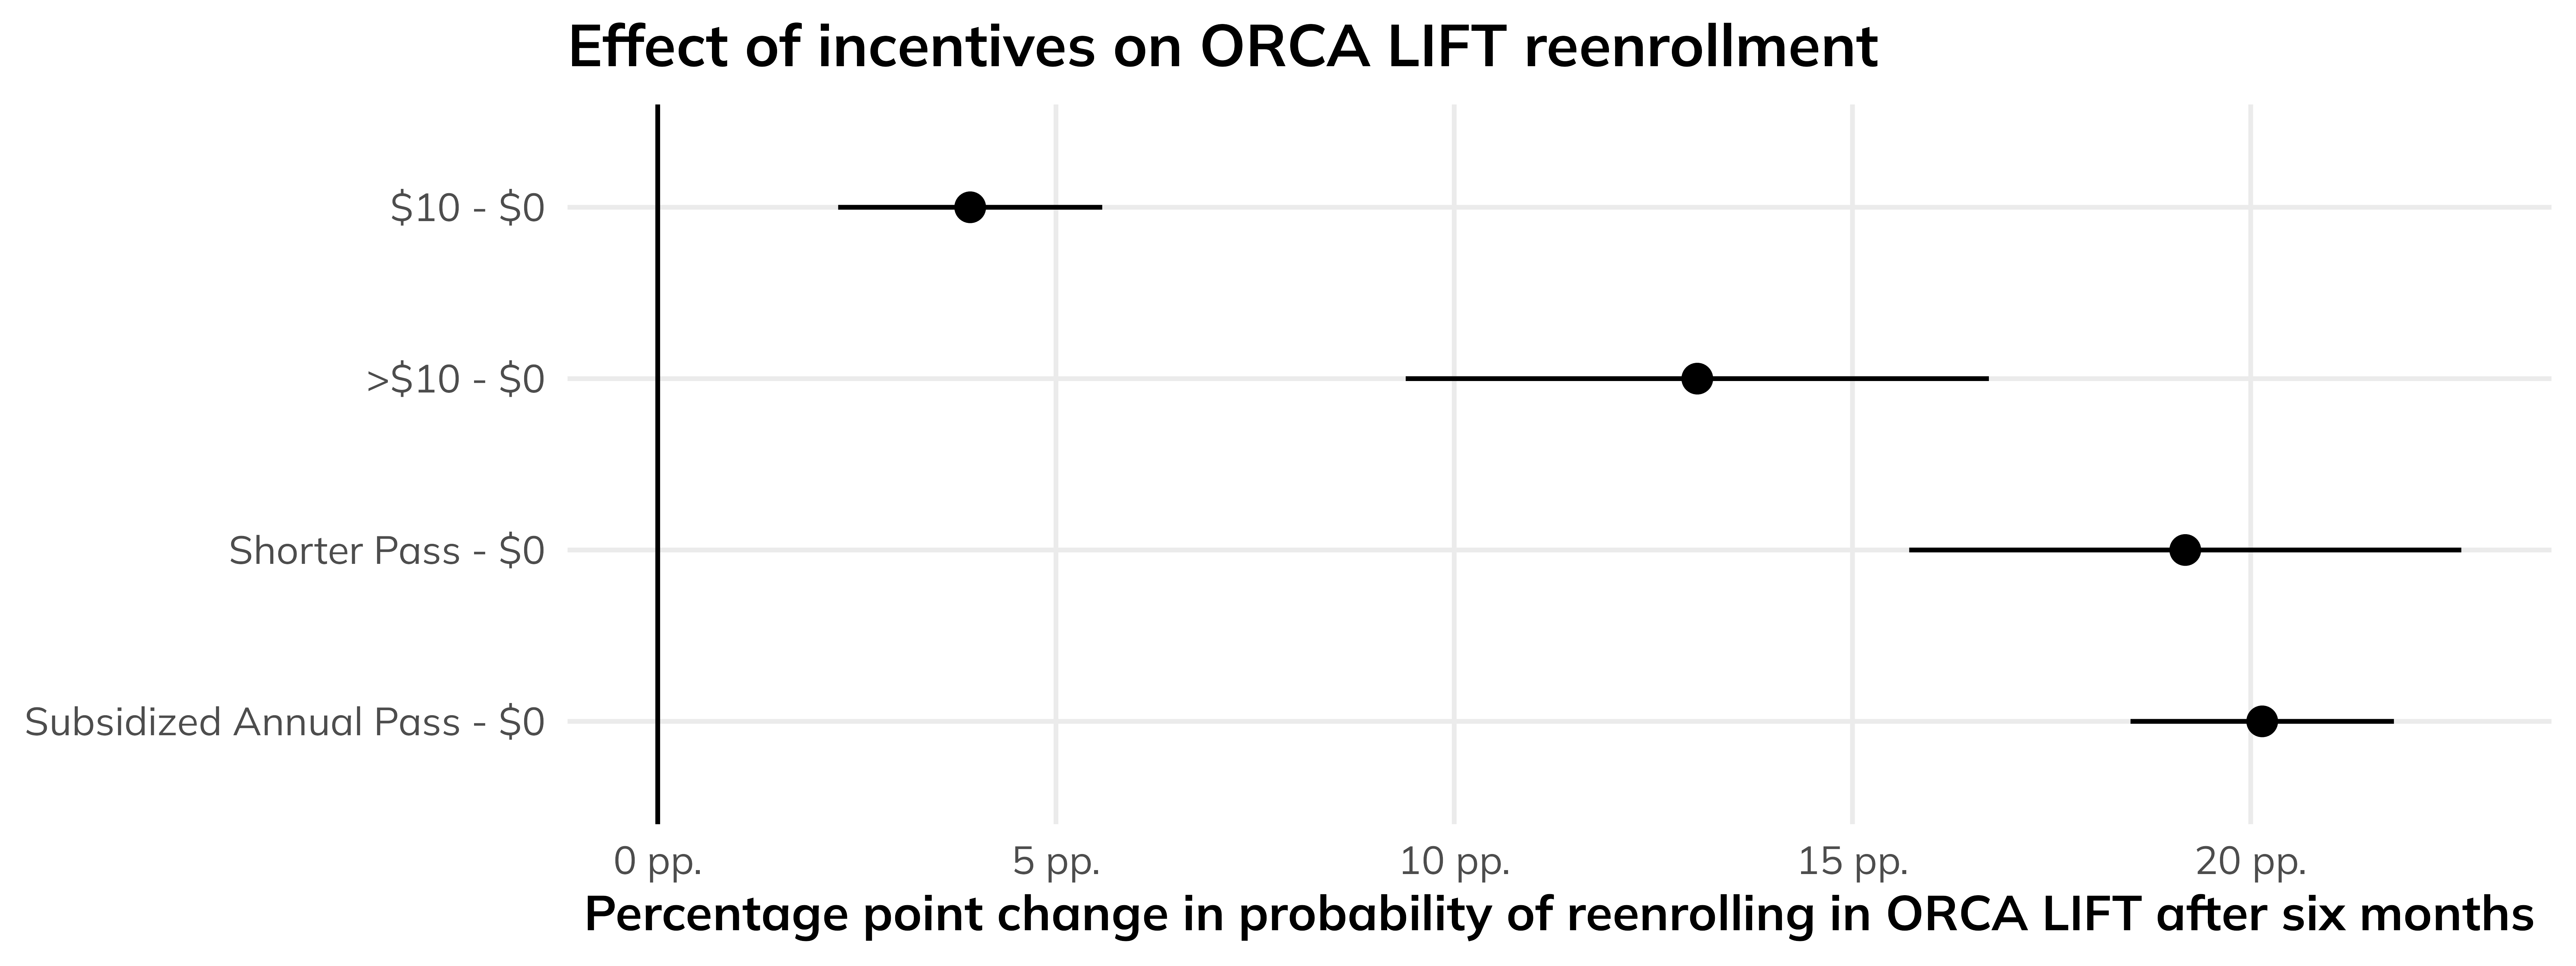
6.2 H2: Incentives and reenrollment
Expected result in Figure 5. More incentives cause an increase in the probability of reenrolling in the subsidized ORCA LIFT program, since the population of treated individuals already uses or wants to use the program.
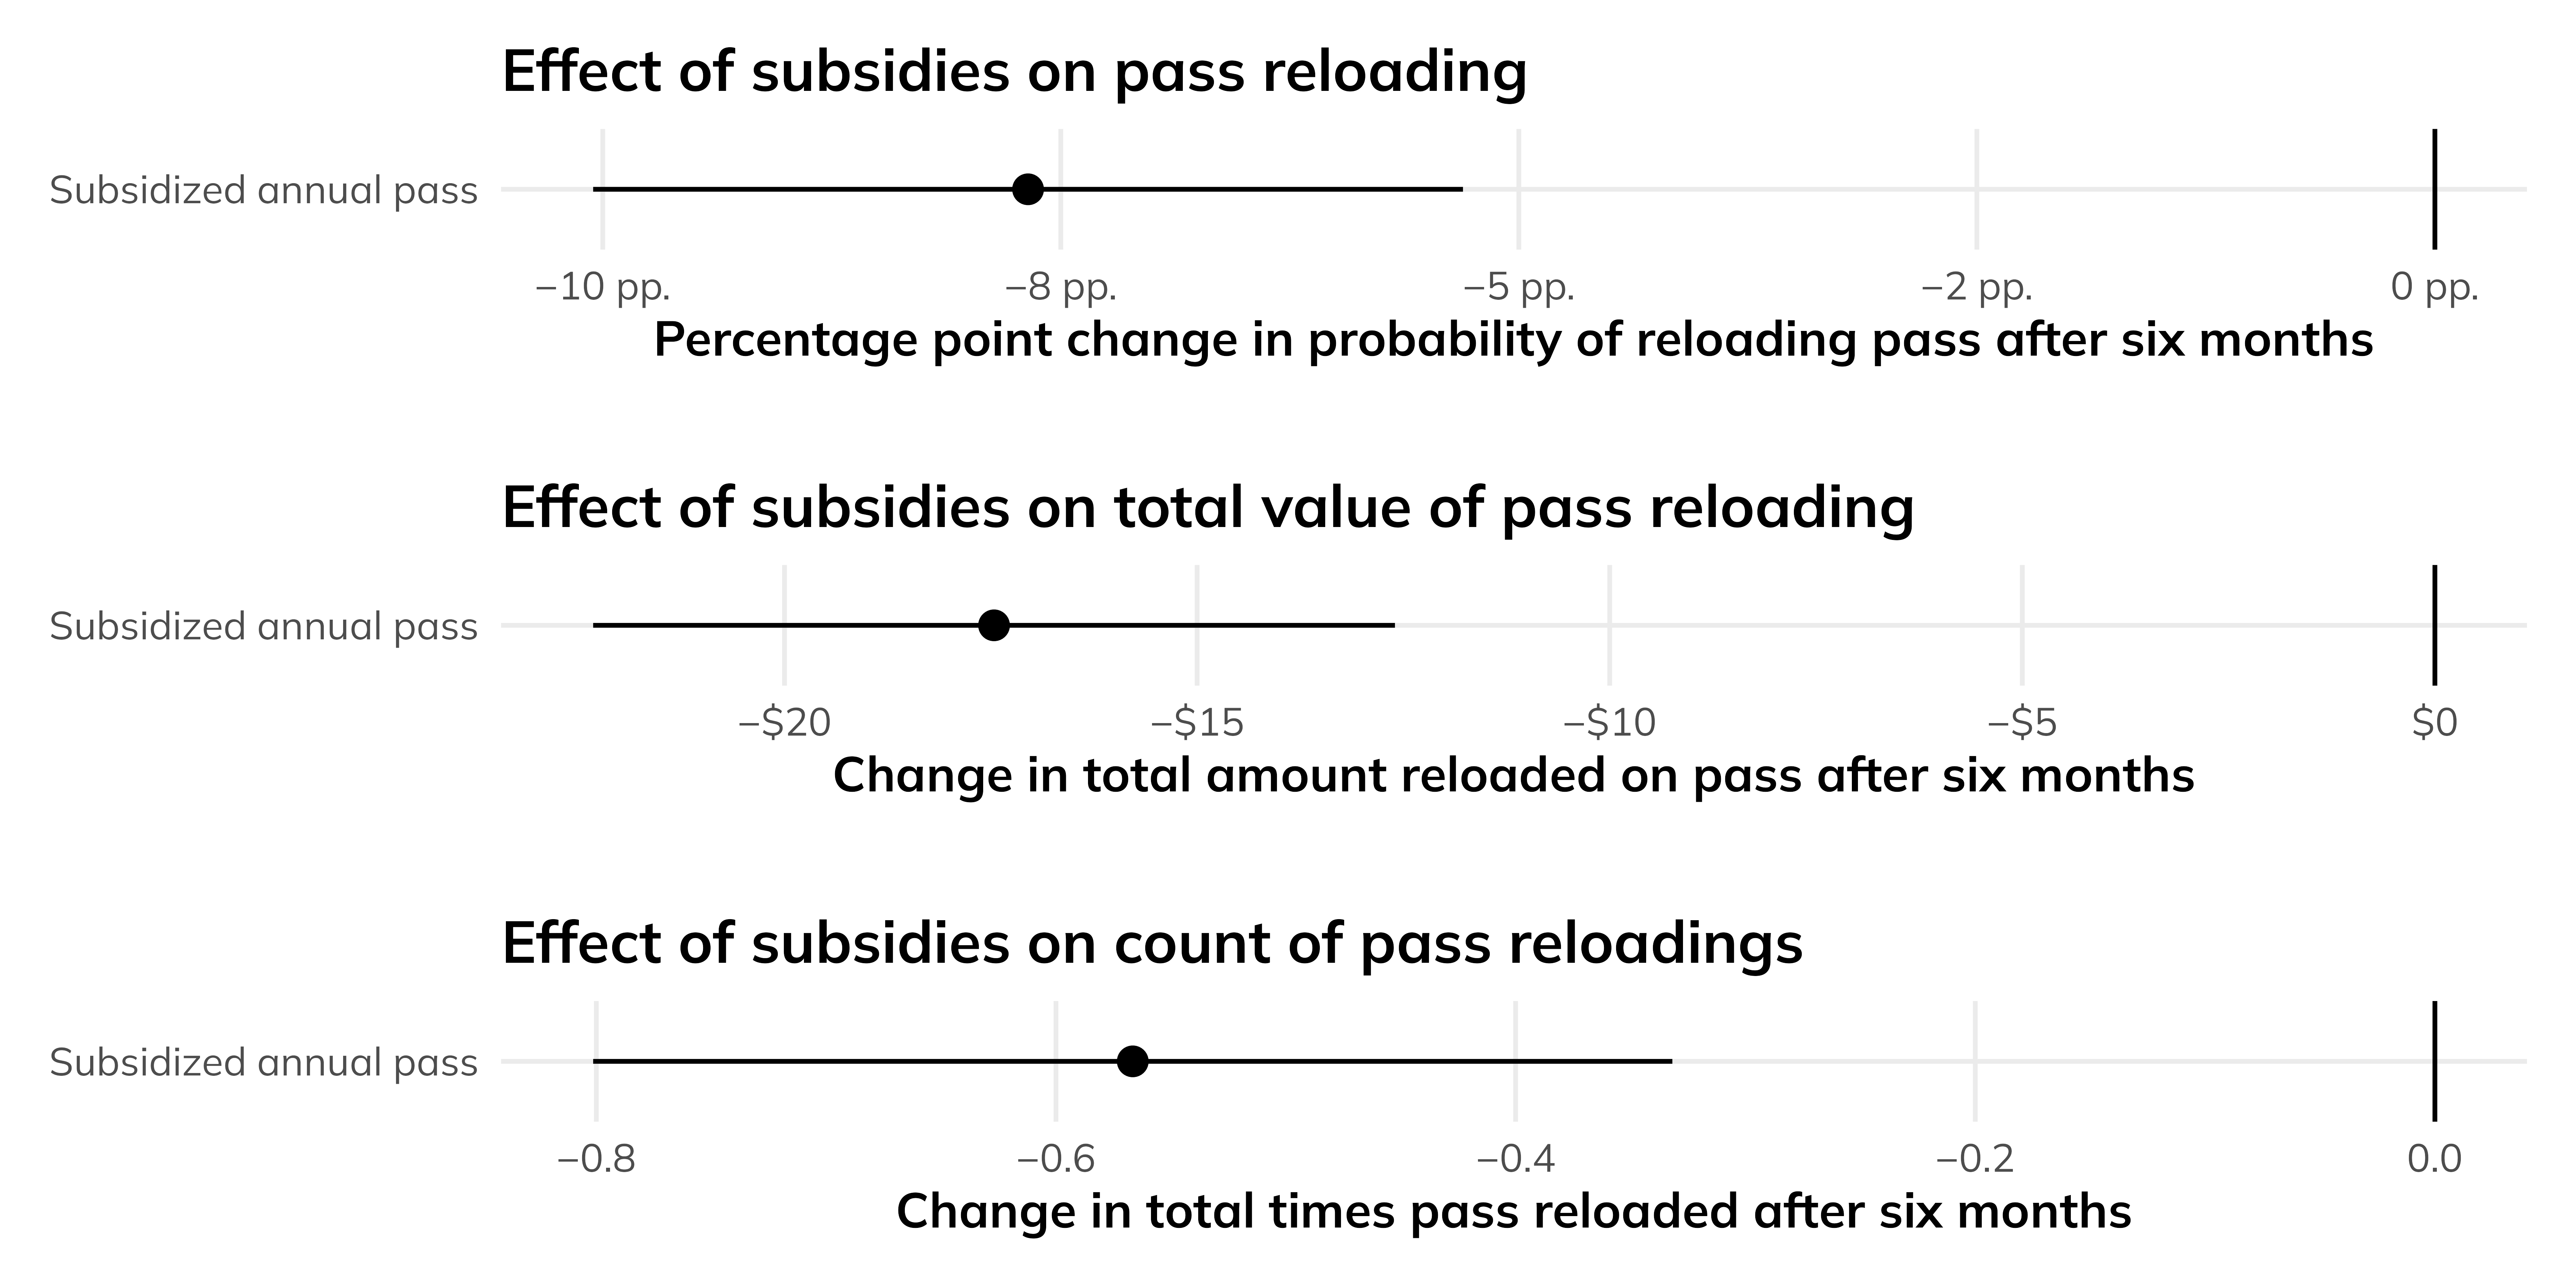
6.3 H3: Subsidized pass and reloading
Puzzling result in Figure 6, similar to H1. Getting a pass reduces probability, amount, and count. Perhaps a data issue; perhaps too short of a time frame.
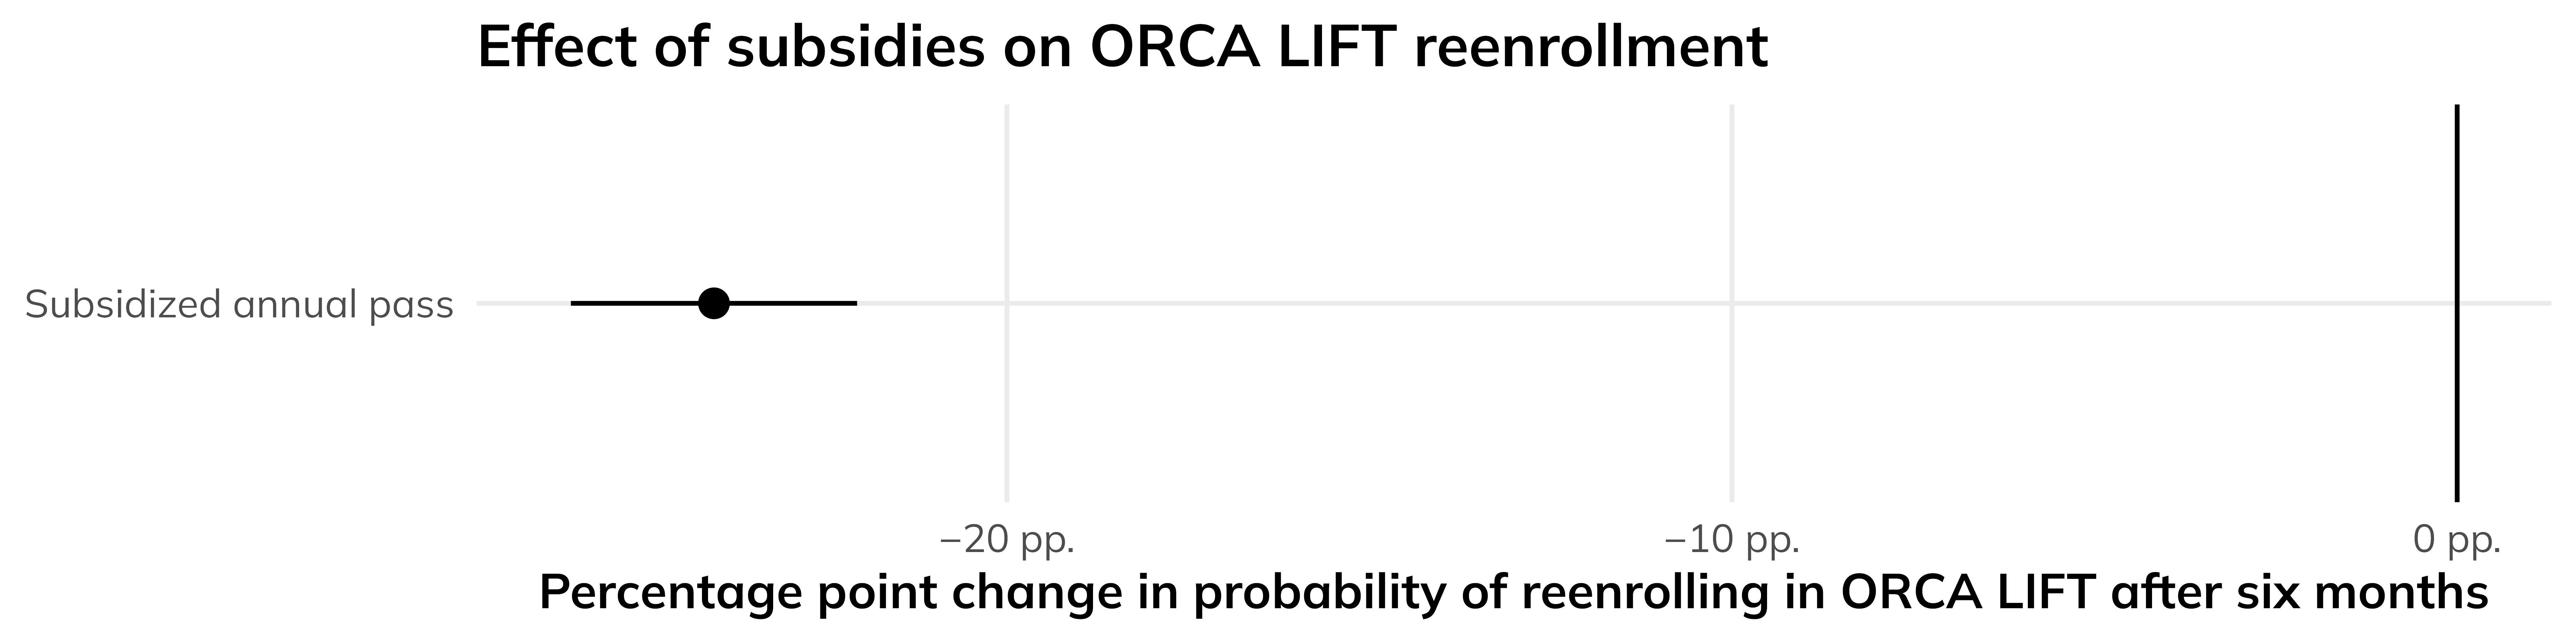
6.4 H4: Subsidized pass and reenrollment
Puzzling result here in Figure 7 too. People less likely to sign up for ORCA LIFT when getting a pass—but that’s unexpected given the findings in H2.
7 Conclusion
Not finished
This section not yet complete.
References
Boyd, T., Williams, K. M., McAndrews, C., Yang, Y., Pande, A., & Tanvir, S. (2022). Transportation equity curriculum: guidance document (Technical Report No. 46; Transportation Planning, Policy, and Processes (TP3) Final Reports). https://digitalcommons.usf.edu/cutr_tpppfr/46
Brough, R., Freedman, M., & Phillips, D. C. (2021). Understanding socioeconomic disparities in travel behavior during the COVID‐19 pandemic. Journal of Regional Science, 61(4), 753–774. https://doi.org/10.1111/jors.12527
Brough, R., Freedman, M., & Phillips, D. C. (2022). Experimental evidence on the effects of means-tested public transportation subsidies on travel behavior. Regional Science and Urban Economics, 96, 103803. https://doi.org/10.1016/j.regsciurbeco.2022.103803
Bruzzone, F., Cavallaro, F., & Nocera, S. (2023). The definition of equity in transport. Transportation Research Procedia, 69, 440–447. https://doi.org/10.1016/j.trpro.2023.02.193
Carter, V., Pastor, M., & Wander, M. (2013). An agenda for equity: A framework for building a just transportation system in Los Angeles County. USC Program for Environmental and Regional Equity. https://dornsife.usc.edu/eri/publications/agenda-for-equity-just-transportation-system/
Causal Inference for Social Impact Lab (CISIL). (2021). Stanford-King County Metro data challenge: data challenge questions [information package]. Unpublished material.
Heiss, A. (2021). Causal Inference. In F. Urdinez & A. Cruz (Eds.), R for Political Data Science: A Practical Guide (1st ed., pp. 235–274). Chapman and Hall/CRC. https://doi.org/10.1201/9781003010623
Lewis, E. O., MacKenzie, D., & Kaminsky, J. (2021). Exploring equity: How equity norms have been applied implicitly and explicitly in transportation research and practice. Transportation Research Interdisciplinary Perspectives, 9, 100332. https://doi.org/10.1016/j.trip.2021.100332
Litman, T. (2022). Evaluating transportation equity: Guidance for incorporating distributional impacts in transport planning. ITE Journal, 92(4), 43–49. https://vtpi.org/Litman_ITEJ_Equity_Apr2022.pdf
Litman, T. (2023). Evaluating transportation equity: Guidance for incorporating distributional impacts in transport planning. Victoria Transport Policy Institute. https://www.vtpi.org/equity.pdf
McCaffrey, D. F., Griffin, B. A., Almirall, D., Slaughter, M. E., Ramchand, R., & Burgette, L. F. (2013). A tutorial on propensity score estimation for multiple treatments using generalized boosted models. Statistics in Medicine, 32(19), 3388–3414. https://doi.org/10.1002/sim.5753
Oregon Metro. (2018). Transportation equity evaluation: an evaluation of equity, environmental justice, and Title VI outcomes (Public Review Draft Appendix E; 2018 Regional Transportation Plan). https://www.oregonmetro.gov/sites/default/files/2018/06/29/RTP-Appendix_E_2018_RTP_Transportation_Equity_Evaluation_with_attachments.pdf
Pearl, J., & Mackenzie, D. (2020). The book of why: the new science of cause and effect. Basic Books.
Shi, F. (2021). Research on accessibility and equity of urban transport based on multisource big data. Journal of Advanced Transportation, 2021, 1–18. https://doi.org/10.1155/2021/1103331