Code
library(tidyverse)
library(ggdag)
library(dagitty)

clrs <- PNWColors::pnw_palette("Sunset2", n = 6)Analysis stuff here.
| Hypothesis | Treatments | Outcomes | |
|---|---|---|---|
| H1 | If transit agencies provide larger incentives, riders will reload passes with higher values and with greater frequency in the future. | Four levels of incentives: (1) $10, (2) >$10, (3) shorter pass, (4) subsidized annual pass | Three measures of future use after six months: (1) binary pass reloading, (2) total value of reloadings, (3) total count of reloadings |
| H2 | If transit agencies provide larger incentives, lower-income riders will re-enroll in specially designed programs like ORCA LIFT. | Four levels of incentives: (1) $10, (2) >$10, (3) shorter pass, (4) subsidized annual pass | Binary reenrollment in ORCA LIFT |
| H3 | If transit agencies provide subsidized passes, riders will reload passes with higher values and with greater frequency in the future. | Subsidized annual pass | Three measures of future use after six months: (1) binary pass reloading, (2) total value of reloadings, (3) total count of reloadings |
| H4 | If transit agencies provide subsidized passes, lower-income riders will re-enroll in specially designed programs like ORCA LIFT. | Subsidized annual pass | Binary reenrollment in ORCA LIFT |
| Category | Variable | Source | Level |
|---|---|---|---|
| Demographics | Age | King County | Individual |
| Demographics | Race | King County | Individual |
| Demographics | Language | King County | Individual |
| Demographics | Population | ACS | Block group |
| Demographics | % female | ACS | Block group |
| Demographics | % nonwhite | ACS | Block group |
| Demographics | % working age | ACS | Block group |
| Social | % married | ACS | Block group |
| Social | % with kids | ACS | Block group |
| Social | % with high school education | ACS | Block group |
| Social | % enrolled in college | ACS | Block group |
| Social | % veterans | ACS | Block group |
| Social | % with access to the internet | ACS | Block group |
| Housing | % with high rent | ACS | Block group |
| Housing | % with no car | ACS | Tract |
| Economic | % employed | ACS | Block group |
| Economic | % uninsured | ACS | Block group |
| Economic | % per capita | ACS | Block group |
| Economic | % commuting using public transportation | ACS | Block group |
| Economic | % working from home | ACS | Block group |
| Economic | % working in an industry heavily affected by COVID | ACS | Block group |
| Economic | % below 200% of the poverty line | ACS | Block group |
| Economic | % below 100% of the poverty line | ACS | Block group |
| Economic | % using SNAP | ACS | Tract |
library(tidyverse)
library(ggdag)
library(dagitty)
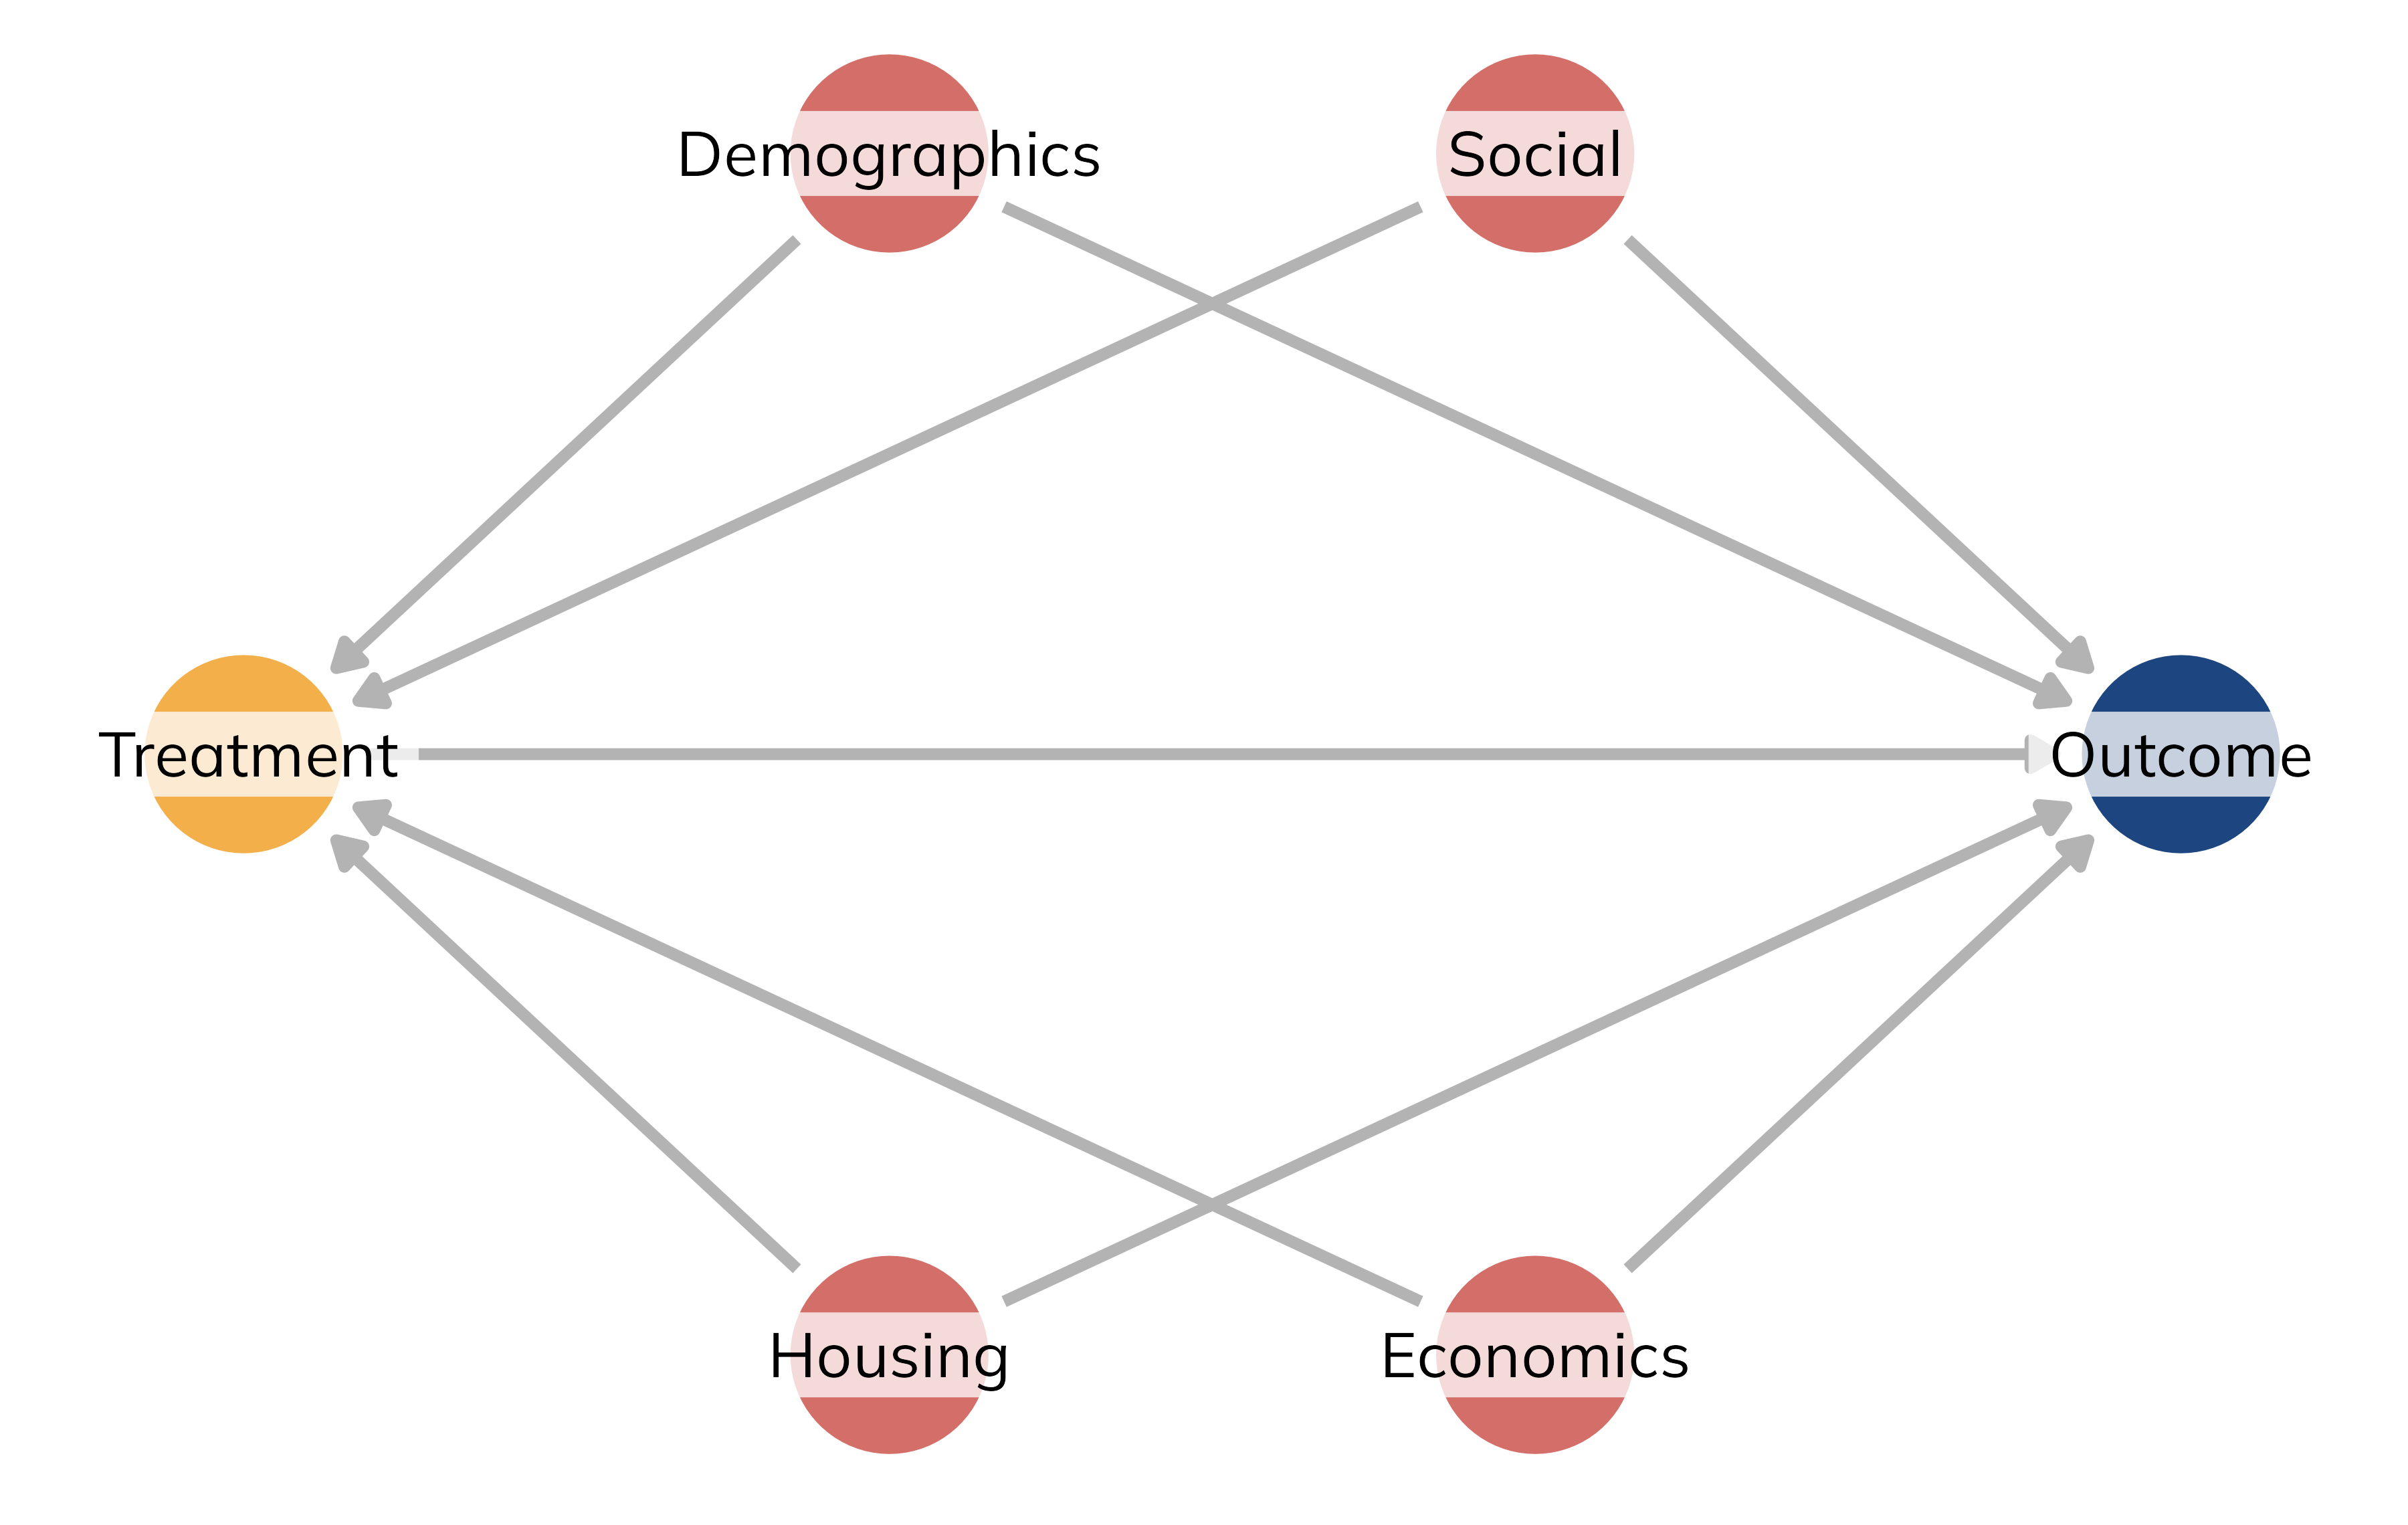
clrs <- PNWColors::pnw_palette("Sunset2", n = 6)simplified_dag <- dagitty('
dag {
Demographics [adjusted,pos="0.400,0.600"]
Economics [adjusted,pos="0.500,0.400"]
Housing [adjusted,pos="0.400,0.400"]
Outcome [outcome,pos="0.600,0.500"]
Social [adjusted,pos="0.500,0.600"]
Treatment [exposure,pos="0.300,0.500"]
Demographics -> Outcome
Demographics -> Treatment
Economics -> Outcome
Economics -> Treatment
Housing -> Outcome
Housing -> Treatment
Social -> Outcome
Social -> Treatment
Treatment -> Outcome
}
') %>%
tidy_dagitty() %>%
node_status() %>%
dag_adjustment_sets() %>%
mutate(highlight = coalesce(status, adjusted))
simplified_dag %>%
ggplot(aes(x = x, y = y, xend = xend, yend = yend)) +
geom_dag_edges(edge_color = "grey70", edge_width = 1) +
geom_dag_point(aes(color = highlight)) +
geom_dag_label_repel(
aes(label = name), force = 0,
family = "Mulish", size = 4, color = "black",
fill = scales::alpha("white", 0.75), label.size = 0
) +
scale_color_manual(values = clrs[c(4, 6, 1)], guide = "none") +
theme_dag()