Replication and extension report
Andrew Heiss
April 25, 2016
- 1 Replication results
- 2 Replication issues
- 3 Extension and new findings
- 3.1 Extension strategy
- 3.2 Variable selection process
- 3.3 Effects of new variables on being included in the TIP report
- 3.4 The effect of TIP-specific funding on criminalization
- 3.5 The effect of US engagement on criminalization
- 3.6 The effect of reactions + new variables on criminalization (logistic regression)
- 3.7
Effects of new variables on criminalization(old, without standardized controls) - 3.8 Predicting time to ratification of 2000 TIP protocol
- 3.9 The relationship between media coverage of TIP issues and presence in the TIP report
- 3.10 Determinants of having a reaction
- 3.11 Updated number of human trafficking NGOs
- 3.12 The effect of democracy on criminalization
- 3.13 Extension conclusions
- 4 Final tables to be included in the chapter or appendix
- 5 To do
1 Replication results
Before merging in the new funding, engagement, and NGO data, I wanted to ensure that the models from the original AJPS article were correct and that they replicated in R instead of just Stata. Beyond some minor issues (discussed in the next section) and some slight differences in R and Stata’s robust standard errors algorithms, the AJPS article is 100% reproducible.
1.1 AJPS table 1
| Time to Inclusion in Report | |||
| Model 1.1 | Model 1.2 | Model 1.3 | |
| Total population (logged) | 1.172** | 1.076 | 1.011 |
| (0.076) | (0.071) | (0.056) | |
| Missing information | 0.736*** | 0.738*** | 0.831*** |
| (0.037) | (0.038) | (0.059) | |
| NGO density | 1.086* | 1.064 | |
| (0.048) | (0.044) | ||
| Worse civil liberties | 1.096** | 1.103* | |
| (0.050) | (0.056) | ||
| Regional density of criminalization | 2.101 | 1.359 | |
| (1.023) | (0.639) | ||
| 2000 TIP protocol ratification | 0.944 | 1.064 | |
| (0.177) | (0.206) | ||
| Trafficking intensity in countries of origin | 1.100* | ||
| (0.059) | |||
| Trafficking intensity in transit countries | 1.133*** | ||
| (0.054) | |||
| Trafficking intensity in destination countries | 1.184*** | ||
| (0.074) | |||
| Number of countries | 179 | 162 | 146 |
| Number of inclusions | 169 | 161 | 145 |
| Observations | 663 | 493 | 384 |
| Log Likelihood | -735.457 | -683.319 | -607.615 |
| Note: | p<0.1; p<0.05; p<0.01 | ||
| Robust standard errors in parentheses; values differ from published article because of differences in the robustness algorithms Stata and R use. All explanatory variables are lagged one period unless otherwise noted. | |||
1.2 AJPS table 2
| US Pressure | ||
| Model 2.1 | Model 2.2 | |
| Worse civil liberties | 1.720*** | 1.766*** |
| (0.094) | (0.102) | |
| US aid (logged) | 1.063*** | 1.069*** |
| (0.017) | (0.017) | |
| GDP (logged) | 1.637*** | 1.540*** |
| (0.117) | (0.109) | |
| Total population (logged) | 0.607*** | 0.643*** |
| (0.050) | (0.053) | |
| 2000 TIP protocol ratification | 2.606*** | 2.636*** |
| (0.353) | (0.359) | |
| NGO density | 1.188*** | 1.194*** |
| (0.058) | (0.059) | |
| Corruption | 0.568*** | |
| (0.081) | ||
| Rule of law | 0.698** | |
| (0.099) | ||
| Constant | 0.0001*** | 0.0002*** |
| (0.0001) | (0.0002) | |
| Pseudo R-squared | 0.1641 | 0.1591 |
| Observations | 1,846 | 1,846 |
| Log Likelihood | -813.963 | -818.894 |
| Note: | p<0.1; p<0.05; p<0.01 | |
| Logit model; odds ratios reported. Non-robust standard errors in parentheses. All explanatory variables are lagged one period. | ||
1.3 AJPS table 3
| Time to Criminalization | |||||
| Model 3.1 | Model 3.2 | Model 3.3 | Model 3.4 | Model 3.5 | |
| In report | 5.706*** | 3.609*** | 3.897*** | 2.208* | 3.437*** |
| (3.375) | (1.214) | (1.285) | (1.048) | (1.201) | |
| Share of women in parliament | 1.019** | 1.020** | 1.016** | 1.015** | 1.016** |
| (0.008) | (0.008) | (0.007) | (0.007) | (0.008) | |
| Worse civil liberties | 0.888 | 0.900 | 0.867** | 0.864** | 0.843*** |
| (0.080) | (0.082) | (0.052) | (0.053) | (0.049) | |
| Regional density of criminalization | 4.576*** | 3.110** | 4.048*** | 4.399*** | 4.453*** |
| (2.478) | (1.596) | (1.880) | (2.089) | (2.047) | |
| 2000 TIP protocol ratification | 1.872** | 1.787** | 1.927*** | 1.888*** | 1.810*** |
| (0.458) | (0.441) | (0.437) | (0.431) | (0.397) | |
| Missing information (t−2) | 1.192 | 1.154 | 1.192** | 1.202** | 1.212** |
| (0.143) | (0.115) | (0.091) | (0.092) | (0.093) | |
| Trafficking intensity in countries of origin | 0.956 | ||||
| (0.084) | |||||
| Trafficking intensity in transit countries | 1.146 | ||||
| (0.123) | |||||
| Trafficking intensity in destination countries | 0.964 | ||||
| (0.104) | |||||
| Total population (logged) | 0.951 | ||||
| (0.076) | |||||
| NGO density | 1.116 | ||||
| (0.082) | |||||
| GDP per capita (logged) | 1.105 | ||||
| (0.118) | |||||
| Corruption | 1.008 | ||||
| (0.202) | |||||
| US aid (logged) | 0.978 | 0.937** | |||
| (0.015) | (0.029) | ||||
| US aid × In report | 1.057 | ||||
| (0.036) | |||||
| US aid as share of GDP | 0.988 | ||||
| (0.012) | |||||
| US aid as share of GDP × In report | 1.012 | ||||
| (0.013) | |||||
| Number of countries | 136 | 149 | 152 | 152 | 150 |
| Number of criminalizations | 95 | 99 | 107 | 107 | 105 |
| Observations | 1,251 | 1,307 | 1,392 | 1,392 | 1,373 |
| Log Likelihood | -400.527 | -433.611 | -467.354 | -466.288 | -457.699 |
| Note: | p<0.1; p<0.05; p<0.01 | ||||
| Robust standard errors in parentheses; values differ from published article because of differences in the robustness algorithms Stata and R use. All explanatory variables are lagged one period unless otherwise noted. | |||||
1.4 AJPS table 4
| Time to Criminalization | ||||
| Model 4.1 | Model 4.2 | Model 4.3 | Model 4.4 | |
| Tier 1 | 4.575** | 2.628** | 3.420*** | |
| (2.704) | (1.151) | (1.344) | ||
| Tier 2 | 2.517* | 1.654 | 1.884* | |
| (1.221) | (0.564) | (0.611) | ||
| Watch list | 7.324*** | 4.587*** | 4.870*** | |
| (3.575) | (1.610) | (1.625) | ||
| Tier 3 | 10.575*** | 8.235*** | 7.211*** | |
| (5.281) | (2.858) | (2.447) | ||
| In report | 3.331*** | |||
| (1.136) | ||||
| First demotion (t−3) | 2.127** | |||
| (0.638) | ||||
| First demotion (t−2) | 1.676* | |||
| (0.476) | ||||
| First demotion (t−1) | 1.259 | |||
| (0.333) | ||||
| Share of women in parliament | 1.022** | 1.022*** | 1.020** | 1.021*** |
| (0.009) | (0.009) | (0.008) | (0.008) | |
| Worse civil liberties | 0.795** | 0.814** | 0.796*** | 0.820*** |
| (0.075) | (0.077) | (0.052) | (0.048) | |
| Regional density of criminalization | 4.318*** | 3.742** | 4.110*** | 4.756*** |
| (2.311) | (2.012) | (1.962) | (2.124) | |
| 2000 TIP protocol ratification | 1.848** | 1.965*** | 1.859*** | 1.643** |
| (0.482) | (0.489) | (0.420) | (0.369) | |
| Missing information | 1.143 | 1.044 | 1.141* | 1.194** |
| (0.130) | (0.104) | (0.084) | (0.091) | |
| Trafficking intensity in countries of origin | 1.029 | |||
| (0.092) | ||||
| Trafficking intensity in transit countries | 1.116 | |||
| (0.119) | ||||
| Trafficking intensity in destination countries | 0.924 | |||
| (0.098) | ||||
| Total population (logged) | 0.961 | |||
| (0.084) | ||||
| NGO density | 1.082 | |||
| (0.077) | ||||
| US aid (logged) | 0.969 | |||
| (0.023) | ||||
| GDP per capita (logged) | 0.905 | |||
| (0.108) | ||||
| Corruption | 1.101 | |||
| (0.246) | ||||
| Number of countries | 136 | 149 | 152 | 152 |
| Number of criminalizations | 95 | 99 | 107 | 107 |
| Observations | 1,251 | 1,307 | 1,392 | 1,392 |
| Log Likelihood | -391.505 | -422.898 | -458.845 | -464.907 |
| Note: | p<0.1; p<0.05; p<0.01 | |||
| Robust standard errors in parentheses; values differ from published article because of differences in the robustness algorithms Stata and R use. All explanatory variables are lagged one period unless otherwise noted. | ||||
1.5 Chapter 5 table A5.1
The current draft of the chapter uses descriptive statistics to show that countries with documented reactions to the TIP report are more likely to follow up with legislative action in the following year. This conclusion is borne out with multivariate statistical analysis. As seen in the models below, countries with a recorded non-media reaction are 77–88% more likely to criminalize human trafficking (model 5.1: z = 2.05, p = 0.040; model 5.2: z = 1.80, p = 0.072). The intensity of reactions to the report also has an effect—for every additional type of reaction, countries are approximately 20% more likely to criminalize trafficking (z = 2.32, p = 0.020).
These results differ slightly from what is currently in the chapter draft because the models use cleaner and ostensibly more accurate data (the same data used for replicating the AJPS models).
| Criminalization | ||||
| Model 5.1 | Model 5.2 | Model 5.3 | Model 5.4 | |
| Reactions (no media) | 1.851** | 1.729* | ||
| (0.555) | (0.526) | |||
| Total reactions (no media) | 1.208** | 1.197** | ||
| (0.099) | (0.099) | |||
| Share of women in parliament | 1.030*** | 1.029** | 1.031*** | 1.030** |
| (0.012) | (0.012) | (0.012) | (0.012) | |
| Worse total freedom (political rights + civil liberties) | 0.901*** | 0.943 | 0.904*** | 0.944 |
| (0.031) | (0.034) | (0.031) | (0.034) | |
| 2000 TIP protocol ratification | 1.340 | 1.371 | 1.332 | 1.365 |
| (0.354) | (0.366) | (0.351) | (0.363) | |
| Big aid | 0.901 | 1.274 | 0.925 | 1.307 |
| (0.256) | (0.384) | (0.264) | (0.396) | |
| Regional density of criminalization | 8.373*** | 8.527*** | ||
| (4.984) | (5.054) | |||
| Constant | 0.177*** | 0.097*** | 0.170*** | 0.093*** |
| (0.083) | (0.049) | (0.079) | (0.046) | |
| Year fixed effects | Yes | Yes | Yes | Yes |
| Pseudo R-squared | 0.0673 | 0.0912 | 0.0687 | 0.0934 |
| Observations | 689 | 689 | 689 | 689 |
| Log Likelihood | -240.085 | -233.911 | -239.711 | -233.362 |
| Note: | p<0.1; p<0.05; p<0.01 | |||
| Standard errors in parentheses. All explanatory variables are lagged one period unless otherwise noted. | ||||
2 Replication issues
While doing this, I discovered a couple minor issues with the data and the modeling methods.
2.1 Bleeding lags
In the original AJPS article, lagged variables were not calculated by country, so values at the boundaries between countries incorrectly bleed over into adjacent countries. For example, here’s an excerpt from the US-Canadian border (note: not the actual international border), where the logged population for the US in 2011 gets put into Canada 1991:
name    year    logpop    logpop_1
US      2010    19.54998  19.54161
US      2011    19.55720  19.54998
Canada  1991    NA        19.55720
Canada  1992    NA        NA
This doesn’t cause any problems for the TIP report models in Table 1, since those models are limited to observations after 2000—the incorrect rows are dropped. However, the models for the correlates of shaming and time to criminalization are affected, since they include all post-1991 observations. Models 2.1, 2.2, 3.2, 3.5, 4.2, and 4.4 are all affected by this issue.
2.1.1 Differences in lagging—models 2.1 and 2.2
| US Pressure | ||||
|
Model 2.1 (original; bleeding lags) |
Model 2.1 (corrected lags) |
Model 2.2 (original; bleeding lags) |
Model 2.2 (corrected lags) |
|
| Worse civil liberties | 1.720*** | 1.720*** | 1.766*** | 1.766*** |
| (0.094) | (0.094) | (0.102) | (0.102) | |
| US aid (logged) | 1.063*** | 1.063*** | 1.069*** | 1.069*** |
| (0.017) | (0.017) | (0.017) | (0.017) | |
| GDP (logged) | 1.637*** | 1.637*** | 1.540*** | 1.540*** |
| (0.117) | (0.117) | (0.109) | (0.109) | |
| Total population (logged) | 0.607*** | 0.607*** | 0.643*** | 0.643*** |
| (0.050) | (0.050) | (0.053) | (0.053) | |
| 2000 TIP protocol ratification | 2.606*** | 2.606*** | 2.636*** | 2.636*** |
| (0.353) | (0.353) | (0.359) | (0.359) | |
| NGO density | 1.188*** | 1.188*** | 1.194*** | 1.194*** |
| (0.058) | (0.058) | (0.059) | (0.059) | |
| Corruption | 0.568*** | 0.568*** | ||
| (0.081) | (0.081) | |||
| Rule of law | 0.698** | 0.698** | ||
| (0.099) | (0.099) | |||
| Constant | 0.0001*** | 0.0001*** | 0.0002*** | 0.0002*** |
| (0.0001) | (0.0001) | (0.0002) | (0.0002) | |
| Observations | 1,846 | 1,846 | 1,846 | 1,846 |
| Note: | p<0.1; p<0.05; p<0.01 | |||
| Logit model; odds ratios reported. Non-robust standard errors in parentheses. All explanatory variables are lagged one period. | ||||
2.1.2 Differences in lagging—models 3.2 and 3.5
| Time to Criminalization | ||||
|
Model 3.2 (original; bleeding lags) |
Model 3.2 (corrected lags) |
Model 3.5 (original; bleeding lags) |
Model 3.5 (corrected lags) |
|
| In report | 3.609*** | 3.609*** | 3.437*** | 3.437*** |
| (1.214) | (1.214) | (1.201) | (1.201) | |
| Share of women in parliament | 1.020** | 1.020** | 1.016** | 1.016** |
| (0.008) | (0.008) | (0.008) | (0.008) | |
| Worse civil liberties | 0.900 | 0.900 | 0.843*** | 0.843*** |
| (0.082) | (0.082) | (0.049) | (0.049) | |
| Regional density of criminalization | 3.110** | 3.110** | 4.453*** | 4.453*** |
| (1.596) | (1.596) | (2.047) | (2.047) | |
| 2000 TIP protocol ratification | 1.787** | 1.787** | 1.810*** | 1.810*** |
| (0.441) | (0.441) | (0.397) | (0.397) | |
| Missing information (t−2) | 1.154 | 1.154 | 1.212** | 1.212** |
| (0.115) | (0.115) | (0.093) | (0.093) | |
| Total population (logged) | 0.951 | 0.951 | ||
| (0.076) | (0.076) | |||
| NGO density | 1.116 | 1.116 | ||
| (0.082) | (0.082) | |||
| GDP per capita (logged) | 1.105 | 1.105 | ||
| (0.118) | (0.118) | |||
| Corruption | 1.008 | 1.008 | ||
| (0.202) | (0.202) | |||
| US aid as share of GDP | 0.988 | 0.988 | ||
| (0.012) | (0.012) | |||
| US aid as share of GDP × In report | 1.012 | 1.012 | ||
| (0.013) | (0.013) | |||
| Number of countries | 149 | 149 | 150 | 150 |
| Number of criminalizations | 99 | 99 | 105 | 105 |
| Observations | 1,307 | 1,307 | 1,373 | 1,373 |
| Log Likelihood | -433.611 | -433.611 | -457.699 | -457.699 |
| Note: | p<0.1; p<0.05; p<0.01 | |||
| Robust standard errors in parentheses; values differ from published article because of differences in the robustness algorithms Stata and R use. All explanatory variables are lagged one period unless otherwise noted. | ||||
2.1.3 Differences in lagging—models 4.2 and 4.4
| Time to Criminalization | ||||
|
Model 4.2 (original; bleeding lags) |
Model 4.2 (corrected lags) |
Model 4.4 (original; bleeding lags) |
Model 4.4 (corrected lags) |
|
| Tier 1 | 2.628** | 2.628** | ||
| (1.151) | (1.151) | |||
| Tier 2 | 1.654 | 1.654 | ||
| (0.564) | (0.564) | |||
| Watch list | 4.587*** | 4.587*** | ||
| (1.610) | (1.610) | |||
| Tier 3 | 8.235*** | 8.235*** | ||
| (2.858) | (2.858) | |||
| In report | 3.331*** | 3.331*** | ||
| (1.136) | (1.136) | |||
| First demotion (t−3) | 2.127** | 2.127** | ||
| (0.638) | (0.638) | |||
| First demotion (t−2) | 1.676* | 1.676* | ||
| (0.476) | (0.476) | |||
| First demotion (t−1) | 1.259 | 1.259 | ||
| (0.333) | (0.333) | |||
| Share of women in parliament | 1.022*** | 1.022*** | 1.021*** | 1.021*** |
| (0.009) | (0.009) | (0.008) | (0.008) | |
| Worse civil liberties | 0.814** | 0.814** | 0.820*** | 0.820*** |
| (0.077) | (0.077) | (0.048) | (0.048) | |
| Regional density of criminalization | 3.742** | 3.742** | 4.756*** | 4.756*** |
| (2.012) | (2.012) | (2.124) | (2.124) | |
| 2000 TIP protocol ratification | 1.965*** | 1.965*** | 1.643** | 1.643** |
| (0.489) | (0.489) | (0.369) | (0.369) | |
| Missing information | 1.044 | 1.044 | 1.194** | 1.194** |
| (0.104) | (0.104) | (0.091) | (0.091) | |
| Total population (logged) | 0.961 | 0.961 | ||
| (0.084) | (0.084) | |||
| NGO density | 1.082 | 1.082 | ||
| (0.077) | (0.077) | |||
| US aid (logged) | 0.969 | 0.969 | ||
| (0.023) | (0.023) | |||
| GDP per capita (logged) | 0.905 | 0.905 | ||
| (0.108) | (0.108) | |||
| Corruption | 1.101 | 1.101 | ||
| (0.246) | (0.246) | |||
| Number of countries | 149 | 149 | 152 | 152 |
| Number of criminalizations | 99 | 99 | 107 | 107 |
| Observations | 1,307 | 1,307 | 1,392 | 1,392 |
| Log Likelihood | -422.898 | -422.898 | -464.907 | -464.907 |
| Note: | p<0.1; p<0.05; p<0.01 | |||
| Robust standard errors in parentheses; values differ from published article because of differences in the robustness algorithms Stata and R use. All explanatory variables are lagged one period unless otherwise noted. | ||||
2.2 Under-the-hood improvements
By default, Stata and most other statistical packages use the Breslow approximation for handling tied event times. This is because it is the easiest to program and because it works well on older computers. However, according to Terry Therneau,1 one of the main inventors of Cox modeling, it is less accurate. With gains in computing power and theoretical statistical work, the Efron approximation is more accurate and more computationally efficient, so in the extensions of the models I use it instead of Breslow. Here’s an example of the (fairly minor) differences in the results:
2.2.1 Differences in tie algorithms—model 1.2
| Time to Inclusion in Report | ||
|
Model 1.2 (original; Breslow ties) |
Model 1.2 (Efron ties) |
|
| Total population (logged) | 1.076 | 1.088 |
| (0.071) | (0.088) | |
| Missing information | 0.738*** | 0.669*** |
| (0.038) | (0.043) | |
| NGO density | 1.086* | 1.118** |
| (0.048) | (0.064) | |
| Worse civil liberties | 1.096** | 1.131** |
| (0.050) | (0.065) | |
| Regional density of criminalization | 2.101 | 2.470 |
| (1.023) | (1.421) | |
| 2000 TIP protocol ratification | 0.944 | 0.902 |
| (0.177) | (0.211) | |
| Number of countries | 162 | 162 |
| Number of inclusions | 161 | 161 |
| Observations | 493 | 493 |
| Log Likelihood | -683.319 | -631.650 |
| Note: | p<0.1; p<0.05; p<0.01 | |
| Robust standard errors in parentheses; values differ from published article because of differences in the robustness algorithms Stata and R use. All explanatory variables are lagged one period unless otherwise noted. | ||
3 Extension and new findings
3.1 Extension strategy
The chapter tests the effect of several explanatory variables on the probability of criminalization, as stated by these propositions:
- Countries included in the report should criminalize faster (models 3.1–3.5 in AJPS)
- Countries with harsher tiers should criminalize faster (models 4.1–4.3 in AJPS)
- Demoted countries should criminalize faster (model 4.4 in AJPS)
- Countries with a documented reaction are more likely to be concerned and therefore more likely to criminalize trafficking in the following year (models 1 and 2 in Table A5.1 in chapter)
- Countries with more types of documented reactions in general have a greater intensity of interaction with the embassy and thus are more likely to criminalize trafficking in the following year (models 3 and 4 in Table A5.1 in chapter)
For the extension of the chapter, I test the following additional propositions:
- Countries with more TIP-specific funding from the US will criminalize faster
- Countries where the US is more diplomatically involved in anti-TIP discussions with senior officials (as measured by Wikileaks cables) will criminalize faster
- Countries where there are more human trafficking NGOs (as measured by our own database of TIP NGOs) will criminalize faster
- The relationship between inclusion in the report and time to criminalization will be stronger for less democratic countries
3.2 Variable selection process
To test the effect of these new explanatory variables on criminalization, I had to determine the most theoretically sound set of explanatory and control variables. The models in the article and the book chapter use slight variations of combinations of controls. The chapter draft, for example, tests the effect of reactions to the TIP report on criminalization and includes these variables:
- Percent of women in parliament
- Total freedom (the sum of Freedom House’s political rights and civil liberties; higher values are worse)
- 2000 TIP protocol ratification
- Big aid (1 if aid > $100,000,000)
- Regional density of criminalization
Table 3 of the article tests the effect of scrutiny (presence of the country in the TIP report) and US aid on criminalization. It uses “Percent of women in parliament”, “Regional density of criminalization” and “2000 TIP protocol ratification” just like the chapter, but it also uses some slightly different controls:
- Worse civil liberties (just Freedom House’s civil liberties score)
- Missing information (lagged two periods)
- Total population (logged)
- NGO density
- GDP per capita (logged)
- Corruption
- Various measures of trafficking intensity
Table 4 tests the effect of different tier assignments and demotions on criminalization and keeps all the same control variables as Table 3. In both Tables 3 and 4, trafficking intensity is never used at the same time as the population + NGO density + GDP/capita + corruption controls.
Thus, for the extension, I use the following combinations of controls to test the relationship between the new explanatory variables and TIP criminalization. In every model, I include the following:
- Percent of women in parliament
- Total freedom (the sum of Freedom House’s political rights and civil liberties)
- 2000 TIP protocol ratification
- Regional density of criminalization
- Missing information (lagged two periods)
Mimicking the pattern of the AJPS articles, I also run models using measures of trafficking intensity or this set of general controls:
- Total population (logged)
- GDP per capita (logged)
- Corruption
- NGO density or number of NGOs (survey database)
In some models I also include the key explanatory variables from previous propositions, such as presence in the TIP report, tier ranking, and reactions to the report.
3.3 Effects of new variables on being included in the TIP report
Before looking at the determinants of criminalization, it might be useulf to see if these new variables help explain the process of being included in the TIP report. According to the original article, missing information and trafficking intensity lead to inclusion in the TIP report—countries with more missing information are less likely to appear in the report since the State Department cannot know about the severity of trafficking, while countries with worse and more intense visible trafficking are more likely to be included.
The new variables add some additional nuance to the selection process, but not much. Funding from the United States (logged) appears to have a slightly negative—but statistically insignificant—effect (z = -0.26, p = 0.798).
More engagement from the State Department has a significant and substantive positive effect on inclusion in the report, but again, with many caveats. If we measure engagement with the proportion of observed TIP-related cables in the Wikileaks dump, for every percent increase in State Department back chatter on trafficking, a country is 17 times more likely to enter the report (z = 3.06, p = 0.002). However, if we measure engagement with the estimated proportion of TIP-related cables, the effect disappears entirely (z = 0.55, p = 0.583). Additionally, models using cable data are noticeably smaller than other models, with roughly 100 observations in only 24 countries, and the number of inclusions inexplicably exceeds the number of countries—there might be too much missing data. Also, the coefficient for the estimated number of TIP cables is ridiculously huge and most likely wrong.
Replacing the NGO density variable with our own NGO measure—the number of NGOs in each country from the database of human trafficking NGOs we used for the survey—yields a significant but probably non-substantive negative effect of being included in the report. For each additional anti-TIP NGO, a country is 1% less likely to enter the report in a given year (z = -3.19, p = 0.001), which is hardly a noticeable effect. Moreover, the count of NGOs is not entirely accurate—it is based on the home location of the NGO, not the location(s) where the NGO actually works. We could use data from the survey to get information about where these NGOs work, but we would have an even smaller set of data to work with.
| Time to Inclusion in Report | |||||
|
Model 1.3 (from AJPS) |
Model 1.4 | Model 1.5 | Model 1.6 | Model 1.7 | |
| Total population (logged) | 1.011 | 0.935 | 0.998 | 0.971 | 1.156* |
| (0.056) | (0.121) | (0.141) | (0.136) | (0.086) | |
| Missing information | 0.831*** | 0.727*** | 0.786* | 0.775* | 0.909 |
| (0.059) | (0.086) | (0.114) | (0.115) | (0.084) | |
| NGO density | 1.064 | 1.099 | 1.113 | 1.081 | |
| (0.044) | (0.113) | (0.090) | (0.086) | ||
| Worse civil liberties | 1.103* | ||||
| (0.056) | |||||
| Worse total freedom | 1.039 | 1.025 | 1.011 | 1.006 | |
| (0.044) | (0.053) | (0.049) | (0.026) | ||
| Regional density of criminalization | 1.359 | 1.563 | 0.375 | 0.498 | 4.012** |
| (0.639) | (0.994) | (0.287) | (0.333) | (2.554) | |
| 2000 TIP protocol ratification | 1.064 | 1.094 | 1.265 | 1.114 | 1.209 |
| (0.206) | (0.334) | (0.597) | (0.502) | (0.303) | |
| Trafficking intensity in countries of origin | 1.100* | 1.256* | 1.139 | 1.187 | 1.274*** |
| (0.059) | (0.164) | (0.163) | (0.168) | (0.082) | |
| Trafficking intensity in transit countries | 1.133*** | 1.066 | 1.034 | 1.006 | 1.189*** |
| (0.054) | (0.099) | (0.122) | (0.111) | (0.069) | |
| Trafficking intensity in destination countries | 1.184*** | 1.123 | 1.400*** | 1.405*** | 1.297*** |
| (0.074) | (0.125) | (0.168) | (0.174) | (0.092) | |
| Total US funding for TIP (logged) | 0.989 | ||||
| (0.041) | |||||
| Proportion of TIP-related cables (observed in Wikileaks) | 17.798*** | ||||
| (16.754) | |||||
| Proportion of TIP-related cables (estimated) | 206,068,847,578,176.000 | ||||
| (12,386,094,739,537,906.000) | |||||
| Number of NGOs (survey database) | 0.986*** | ||||
| (0.004) | |||||
| Number of countries | 146 | 66 | 24 | 24 | 127 |
| Number of inclusions | 145 | 66 | 42 | 42 | 126 |
| Observations | 384 | 236 | 103 | 103 | 290 |
| Log Likelihood | -607.615 | -210.658 | -86.370 | -87.835 | -461.027 |
| Note: | p<0.1; p<0.05; p<0.01 | ||||
| Robust standard errors in parentheses. All explanatory variables are lagged one period unless otherwise noted. | |||||
3.4 The effect of TIP-specific funding on criminalization
TIP-specific funding generally has a positive effect on the time to criminalization, increasing the probability of criminalization by 3–4% for each increase in logged funding in a given year (Extension 1.1: z = 2.08, p = 0.038). This finding is not necessarily robust to other specifications of the model, though, and weakens or disappears when using our own measure of NGOs, including incidence data, or controlling for tier ratings and demotions.
| Time to Criminalization | ||||
| Extension 1.0 | Extension 1.1 | Extension 1.2 | Extension 1.3 | |
| Total US funding for TIP (logged) | 1.040** | 1.044** | 1.032 | 1.036* |
| (0.020) | (0.022) | (0.023) | (0.022) | |
| Share of women in parliament | 1.024*** | 1.024*** | 1.027*** | 1.027*** |
| (0.009) | (0.009) | (0.010) | (0.009) | |
| Worse total freedom (political rights + civil liberties) | 0.936** | 1.000 | 1.004 | 0.969 |
| (0.026) | (0.042) | (0.043) | (0.042) | |
| 2000 TIP protocol ratification | 2.370*** | 2.559*** | 2.498*** | 2.178*** |
| (0.567) | (0.682) | (0.748) | (0.578) | |
| Regional density of criminalization | 6.565*** | 4.288*** | 8.063*** | 5.826*** |
| (3.115) | (2.384) | (4.324) | (3.279) | |
| Missing information | 1.163* | 1.096 | 1.153 | 1.144 |
| (0.092) | (0.115) | (0.133) | (0.154) | |
| Total population (logged) | 0.959 | 0.917 | ||
| (0.083) | (0.098) | |||
| GDP per capita (logged) | 1.069 | 0.972 | ||
| (0.133) | (0.131) | |||
| Corruption | 1.261 | 1.200 | ||
| (0.287) | (0.302) | |||
| NGO density | 1.151* | |||
| (0.093) | ||||
| Number of NGOs (survey database) | 1.023* | |||
| (0.012) | ||||
| Trafficking intensity in countries of origin | 0.904 | |||
| (0.098) | ||||
| Trafficking intensity in transit countries | 1.205 | |||
| (0.138) | ||||
| Trafficking intensity in destination countries | 1.004 | |||
| (0.117) | ||||
| Number of countries | 149 | 147 | 124 | 133 |
| Number of inclusions | 103 | 95 | 85 | 91 |
| Observations | 1,085 | 1,009 | 822 | 976 |
| Log Likelihood | -443.518 | -408.242 | -348.230 | -380.017 |
| Note: | p<0.1; p<0.05; p<0.01 | |||
| Robust standard errors in parentheses. All explanatory variables are lagged one period unless otherwise noted. | ||||
| Time to Criminalization | |||
| Extension 1.4 | Extension 1.5 | Extension 1.6 | |
| Total US funding for TIP (logged) | 1.033* | 1.035* | 1.026 |
| (0.019) | (0.019) | (0.019) | |
| In report | 3.495*** | 2.994*** | |
| (1.057) | (0.931) | ||
| Tier 1 | 3.886*** | ||
| (1.632) | |||
| Tier 2 | 1.782* | ||
| (0.596) | |||
| Watch list | 4.497*** | ||
| (1.578) | |||
| Tier 3 | 7.336*** | ||
| (2.622) | |||
| First demotion (t−3) | 2.061** | ||
| (0.701) | |||
| First demotion (t−2) | 1.811** | ||
| (0.543) | |||
| First demotion (t−1) | 1.209 | ||
| (0.358) | |||
| Share of women in parliament | 1.022*** | 1.025*** | 1.025*** |
| (0.008) | (0.009) | (0.009) | |
| Worse total freedom (political rights + civil liberties) | 0.926*** | 0.905*** | 0.918*** |
| (0.025) | (0.027) | (0.025) | |
| 2000 TIP protocol ratification | 2.238*** | 2.319*** | 2.110*** |
| (0.533) | (0.571) | (0.516) | |
| Regional density of criminalization | 5.943*** | 5.108*** | 6.415*** |
| (2.785) | (2.498) | (2.978) | |
| Missing information | 1.292*** | 1.216** | 1.260*** |
| (0.107) | (0.102) | (0.107) | |
| Number of countries | 149 | 149 | 149 |
| Number of inclusions | 103 | 103 | 103 |
| Observations | 1,085 | 1,085 | 1,085 |
| Log Likelihood | -436.055 | -424.694 | -432.967 |
| Note: | p<0.1; p<0.05; p<0.01 | ||
| Robust standard errors in parentheses. All explanatory variables are lagged one period unless otherwise noted. | |||
3.5 The effect of US engagement on criminalization
State Department cable discussions about host country TIP efforts have no effect on the time to criminalization, looking at both the observed (z = 1.30, p = 0.192) and the estimated (z = -1.45, p = 0.147) number of cables.
| Time to Criminalization | ||||||||
| Ext. 2.0 | Ext. 2.00 | Ext. 2.1 | Ext. 2.2 | Ext. 2.3 | Ext. 2.4 | Ext. 2.5 | Ext. 2.6 | |
| Proportion of TIP-related cables (observed in Wikileaks) | 3.451 | 5.401* | 4.583 | 4.329 | ||||
| (3.276) | (5.386) | (4.354) | (4.420) | |||||
| Proportion of TIP-related cables (estimated) | 0.762 | 0.771 | 0.550 | 0.718 | ||||
| (0.143) | (0.128) | (0.452) | (0.202) | |||||
| Share of women in parliament | 1.018** | 1.019** | 1.021** | 1.022** | 1.023** | 1.024** | 1.018* | 1.020* |
| (0.009) | (0.010) | (0.010) | (0.010) | (0.012) | (0.012) | (0.011) | (0.010) | |
| Worse total freedom (political rights + civil liberties) | 0.939* | 0.937* | 0.999 | 0.998 | 0.994 | 0.993 | 0.960 | 0.962 |
| (0.032) | (0.031) | (0.055) | (0.055) | (0.060) | (0.060) | (0.047) | (0.047) | |
| 2000 TIP protocol ratification | 1.946** | 1.958** | 2.372** | 2.395** | 2.071* | 2.079* | 1.696 | 1.752* |
| (0.585) | (0.583) | (0.864) | (0.876) | (0.795) | (0.799) | (0.545) | (0.556) | |
| Regional density of criminalization | 4.246*** | 4.139*** | 2.634 | 2.570 | 6.098*** | 5.882*** | 3.719** | 3.657** |
| (2.174) | (2.124) | (1.697) | (1.646) | (4.066) | (3.962) | (2.391) | (2.346) | |
| Missing information | 1.219** | 1.211** | 1.223 | 1.195 | 1.253 | 1.222 | 1.271 | 1.240 |
| (0.109) | (0.109) | (0.157) | (0.151) | (0.174) | (0.168) | (0.194) | (0.186) | |
| Total population (logged) | 1.035 | 1.015 | 1.029 | 1.011 | ||||
| (0.110) | (0.105) | (0.127) | (0.123) | |||||
| GDP per capita (logged) | 1.062 | 1.059 | 0.957 | 0.960 | ||||
| (0.157) | (0.154) | (0.163) | (0.161) | |||||
| Corruption | 1.289 | 1.267 | 1.243 | 1.221 | ||||
| (0.351) | (0.344) | (0.415) | (0.403) | |||||
| NGO density | 1.255** | 1.255** | ||||||
| (0.135) | (0.135) | |||||||
| Number of NGOs (survey database) | 1.019 | 1.019 | ||||||
| (0.013) | (0.013) | |||||||
| Trafficking intensity in countries of origin | 0.936 | 0.921 | ||||||
| (0.116) | (0.113) | |||||||
| Trafficking intensity in transit countries | 1.135 | 1.143 | ||||||
| (0.153) | (0.154) | |||||||
| Trafficking intensity in destination countries | 1.091 | 1.080 | ||||||
| (0.155) | (0.152) | |||||||
| Number of countries | 95 | 95 | 94 | 94 | 78 | 78 | 89 | 89 |
| Number of inclusions | 67 | 67 | 60 | 60 | 53 | 53 | 61 | 61 |
| Observations | 658 | 658 | 599 | 599 | 505 | 505 | 628 | 628 |
| Log Likelihood | -266.249 | -266.599 | -235.540 | -236.280 | -199.036 | -199.449 | -238.017 | -238.562 |
| Note: | p<0.1; p<0.05; p<0.01 | |||||||
| Robust standard errors in parentheses. All explanatory variables are lagged one period unless otherwise noted. | ||||||||
| Time to Criminalization | ||||||
| Extension 2.7 | Extension 2.8 | Extension 2.9 | Extension 2.10 | Extension 2.11 | Extension 2.12 | |
| Proportion of TIP-related cables (observed in Wikileaks) | 2.724 | 3.012 | 2.461 | |||
| (2.678) | (3.045) | (2.483) | ||||
| Proportion of TIP-related cables (estimated) | 0.730 | 0.646 | 0.684 | |||
| (0.177) | (0.269) | (0.210) | ||||
| In report | 6.817*** | 6.948*** | 5.397** | 5.465** | ||
| (4.471) | (4.563) | (3.600) | (3.651) | |||
| Tier 1 | 7.176*** | 7.068*** | ||||
| (5.247) | (5.193) | |||||
| Tier 2 | 3.160* | 3.264* | ||||
| (2.105) | (2.171) | |||||
| Watch list | 10.207*** | 10.443*** | ||||
| (6.664) | (6.824) | |||||
| Tier 3 | 14.607*** | 15.307*** | ||||
| (9.956) | (10.456) | |||||
| First demotion (t−3) | 1.624 | 1.641 | ||||
| (0.597) | (0.601) | |||||
| First demotion (t−2) | 1.550 | 1.584 | ||||
| (0.538) | (0.544) | |||||
| First demotion (t−1) | 1.414 | 1.411 | ||||
| (0.491) | (0.488) | |||||
| Share of women in parliament | 1.016* | 1.016* | 1.023** | 1.023** | 1.020** | 1.020** |
| (0.009) | (0.009) | (0.010) | (0.010) | (0.010) | (0.010) | |
| Worse total freedom (political rights + civil liberties) | 0.931** | 0.929** | 0.888*** | 0.886*** | 0.922** | 0.920** |
| (0.033) | (0.033) | (0.037) | (0.037) | (0.033) | (0.033) | |
| 2000 TIP protocol ratification | 1.942** | 1.953** | 2.093** | 2.104** | 1.798* | 1.806* |
| (0.598) | (0.596) | (0.692) | (0.689) | (0.565) | (0.561) | |
| Regional density of criminalization | 3.936** | 3.834** | 3.239** | 3.214** | 4.254*** | 4.186*** |
| (2.116) | (2.069) | (1.917) | (1.903) | (2.227) | (2.180) | |
| Missing information | 1.336*** | 1.330*** | 1.283** | 1.280** | 1.297*** | 1.291*** |
| (0.123) | (0.123) | (0.125) | (0.125) | (0.121) | (0.121) | |
| Number of countries | 95 | 95 | 95 | 95 | 95 | 95 |
| Number of inclusions | 67 | 67 | 67 | 67 | 67 | 67 |
| Observations | 658 | 658 | 658 | 658 | 658 | 658 |
| Log Likelihood | -260.188 | -260.347 | -250.201 | -250.378 | -258.742 | -258.820 |
| Note: | p<0.1; p<0.05; p<0.01 | |||||
| Robust standard errors in parentheses. All explanatory variables are lagged one period unless otherwise noted. | ||||||
3.6 The effect of reactions + new variables on criminalization (logistic regression)
When combined with the reactions data, none of the additional variables help explain the variance in time to criminalization. US TIP funding has no effect, as expected. Observed (z = 1.08, p = 0.281) and estimated (z = -0.22, p = 0.823) State Department cables on TIP-related matters have no effect, and more human trafficking NGOs in a country does little to influence the passage of criminalization legislation (z = 0.24, p = 0.809).
3.6.1 Table: The effect of reactions to the TIP report and funding, engagement, and NGO density on criminalization
| Criminalization | ||||
| Model 5.5 | Model 5.6 | Model 5.7 | Model 5.8 | |
| Total reactions (no media) | 1.196** | 1.252** | 1.266*** | 1.163 |
| (0.099) | (0.110) | (0.110) | (0.109) | |
| Share of women in parliament | 1.030** | 1.030** | 1.030** | 1.036*** |
| (0.012) | (0.014) | (0.014) | (0.013) | |
| Worse total freedom (political rights + civil liberties) | 0.944 | 0.911** | 0.910** | 0.968 |
| (0.034) | (0.040) | (0.040) | (0.040) | |
| 2000 TIP protocol ratification | 1.363 | 1.042 | 1.071 | 1.299 |
| (0.364) | (0.323) | (0.330) | (0.384) | |
| Big aid | 1.312 | 1.267 | 1.238 | 1.364 |
| (0.407) | (0.455) | (0.441) | (0.459) | |
| Regional density of criminalization | 8.469*** | 4.746** | 4.429** | 13.218*** |
| (5.018) | (3.335) | (3.088) | (8.491) | |
| Total US funding for TIP (logged) | 1.000 | |||
| (0.00000) | ||||
| Proportion of TIP-related cables (observed in Wikileaks) | 6.245 | |||
| (10.619) | ||||
| Proportion of TIP-related cables (estimated) | 0.520 | |||
| (1.523) | ||||
| Number of NGOs (survey database) | 1.003 | |||
| (0.011) | ||||
| Constant | 0.094*** | 0.108*** | 0.111** | 0.068*** |
| (0.048) | (0.092) | (0.095) | (0.039) | |
| Year fixed effects | Yes | Yes | Yes | Yes |
| Pseudo R-squared | 0.093 | 0.1026 | 0.1012 | 0.1005 |
| Observations | 687 | 480 | 480 | 597 |
| Log Likelihood | -233.208 | -162.289 | -162.540 | -204.718 |
| Note: | p<0.1; p<0.05; p<0.01 | |||
| Standard errors in parentheses. All explanatory variables are lagged one period unless otherwise noted. | ||||
3.7 Effects of new variables on criminalization (old, without standardized controls)
The original article showed that a number of factors increased the probability that a country criminalized human trafficking in a given year, with inclusion in the TIP report the most potent. The proportion of women in parliament, the respect of civil liberties, the presence of criminalization in neighboring countries, and other variables also had an effect on the likelihood of criminalization.
Again, the new variables show some promise in explaining the criminalization process, but not much. US TIP funding again has some wonky math issues that I need to look into (with a hazard ratio of 1 and a standard error of 0).
While State Department chatter about TIP issues did influence the decision to include a country in the TIP report (assuming the math is right), it doesn’t seem that US engagement in TIP advocacy has an effect on a country’s decision to criminalize human trafficking, either measured with observed Wikileaks cables (z = 1.28, p = 0.199) or estimated cables (z = -1.54, p = 0.123).
The presence of more human trafficking NGOs does appear to influence the decision to criminalize though—for each additional NGO with headquarters in a country, the chance that that country will criminalize trafficking increases by 2% (z = 3.36, p < 0.001).
3.7.1 Table: The effect of funding, engagement, and NGO density on criminalization
| Time to Criminalization | |||||
|
Model 3.2 (from AJPS) |
Model 3.6 | Model 3.7 | Model 3.8 | Model 3.9 | |
| In report | 3.609*** | 3.461*** | 6.427*** | 6.672*** | 2.667*** |
| (1.214) | (1.086) | (4.315) | (4.478) | (0.912) | |
| Share of women in parliament | 1.020** | 1.024*** | 1.019** | 1.020** | 1.027*** |
| (0.008) | (0.009) | (0.010) | (0.010) | (0.010) | |
| Worse civil liberties | 0.900 | 0.916 | 0.937 | 0.935 | 0.938 |
| (0.082) | (0.090) | (0.124) | (0.124) | (0.098) | |
| Regional density of criminalization | 3.110** | 3.944** | 2.316 | 2.253 | 6.754*** |
| (1.596) | (2.210) | (1.503) | (1.449) | (3.773) | |
| 2000 TIP protocol ratification | 1.787** | 1.870** | 1.824* | 1.852* | 1.642* |
| (0.441) | (0.502) | (0.650) | (0.657) | (0.492) | |
| Missing information (t−2) | 1.154 | 1.186 | 1.276** | 1.257* | 1.142 |
| (0.115) | (0.124) | (0.154) | (0.151) | (0.125) | |
| Total population (logged) | 0.951 | 0.911 | 0.960 | 0.945 | 0.882 |
| (0.076) | (0.078) | (0.101) | (0.097) | (0.089) | |
| NGO density | 1.116 | 1.101 | 1.231* | 1.234* | |
| (0.082) | (0.092) | (0.133) | (0.133) | ||
| GDP per capita (logged) | 1.105 | 1.085 | 1.066 | 1.065 | 1.006 |
| (0.118) | (0.129) | (0.150) | (0.148) | (0.128) | |
| Corruption | 1.008 | 1.099 | 1.198 | 1.185 | 0.995 |
| (0.202) | (0.250) | (0.336) | (0.333) | (0.243) | |
| Total US funding for TIP (logged) | 1.039* | ||||
| (0.021) | |||||
| Proportion of TIP-related cables (observed in Wikileaks) | 3.695 | ||||
| (3.760) | |||||
| Proportion of TIP-related cables (estimated) | 0.760 | ||||
| (0.135) | |||||
| Number of NGOs (survey database) | 1.020*** | ||||
| (0.006) | |||||
| Number of countries | 149 | 147 | 94 | 94 | 127 |
| Number of criminalizations | 99 | 95 | 60 | 60 | 89 |
| Observations | 1,307 | 1,009 | 599 | 599 | 1,076 |
| Log Likelihood | -433.611 | -404.258 | -231.089 | -231.457 | -364.966 |
| Note: | p<0.1; p<0.05; p<0.01 | ||||
| Robust standard errors in parentheses. All explanatory variables are lagged one period unless otherwise noted. | |||||
3.8 Predicting time to ratification of 2000 TIP protocol
We can use a similar set of survival models to see which factors influence a country’s decision to ratify the UN’s 2000 anti-TIP protocol. As seen in extensions 4.0–4.3, worse democracies are 5–10% less likely to ratify in a given year (Extension 4.1: z = -2.87, p = 0.004), while countries with more corruption more than 30% less likely to do so (Extension 4.1). Having more NGOs in the country also decreases the likelihood of criminalization (by 17%; Extension 4.1: z = -2.11, p = 0.035), but only when measured using the original variable from AJPS and not using our own database of NGOs. Human trafficking incidence generally does little to affect the decision, except for increased trafficking intensity in destination countries, which decreases the probability of ratification. Notably, peer pressure from neighboring countries has a powerful effect on the decision to ratify. The regional density of criminalization in neighboring countries increases the likelihood of protocol ratification by 3–6 times (Extension 4.0: z = 2.50, p = 0.013; Extension 4.1: z = 2.95, p = 0.003).
Scorecard diplomacy does not appear to have an effect on the decision to ratify the protocol—neither presence in the TIP report nor the assignment of any specific tier rating changes the likelihood of adopting the protocol (see Extensions 4.4–4.6). However, the initial placement on the watchlist does appear to have some impact, as a country is almost 70% more likely to ratify in the year following the assignment (z = 1.93, p = 0.053).
| Time to Ratification | ||||
| Extension 4.0 | Extension 4.1 | Extension 4.2 | Extension 4.3 | |
| Share of women in parliament | 1.008 | 1.017 | 1.030** | 1.007 |
| (0.009) | (0.011) | (0.012) | (0.010) | |
| Worse total freedom (political rights + civil liberties) | 0.950** | 0.900*** | 0.944 | 0.930** |
| (0.025) | (0.033) | (0.036) | (0.031) | |
| Regional density of criminalization | 3.391** | 5.892*** | 3.668** | 3.382** |
| (1.659) | (3.542) | (2.064) | (1.893) | |
| Missing information | 0.887* | 0.876* | 0.886 | 0.889 |
| (0.055) | (0.063) | (0.072) | (0.099) | |
| Total population (logged) | 0.981 | 0.906 | ||
| (0.054) | (0.059) | |||
| GDP per capita (logged) | 1.061 | 1.161 | ||
| (0.139) | (0.168) | |||
| Corruption | 0.661** | 0.605** | ||
| (0.136) | (0.143) | |||
| NGO density | 0.842** | |||
| (0.069) | ||||
| Number of NGOs (survey database) | 1.002 | |||
| (0.005) | ||||
| Trafficking intensity in countries of origin | 0.996 | |||
| (0.087) | ||||
| Trafficking intensity in transit countries | 1.059 | |||
| (0.088) | ||||
| Trafficking intensity in destination countries | 0.865** | |||
| (0.064) | ||||
| Number of countries | 157 | 157 | 132 | 141 |
| Number of inclusions | 129 | 129 | 108 | 117 |
| Observations | 1,001 | 940 | 785 | 889 |
| Log Likelihood | -567.818 | -542.226 | -454.789 | -500.210 |
| Note: | p<0.1; p<0.05; p<0.01 | |||
| Robust standard errors in parentheses. All explanatory variables are lagged one period unless otherwise noted. | ||||
| Time to Ratification | |||
| Extension 4.4 | Extension 4.5 | Extension 4.6 | |
| In report | 1.039 | 0.992 | |
| (0.270) | (0.261) | ||
| Tier 1 | 0.834 | ||
| (0.293) | |||
| Tier 2 | 0.939 | ||
| (0.265) | |||
| Watch list | 1.603 | ||
| (0.622) | |||
| Tier 3 | 1.352 | ||
| (0.523) | |||
| First demotion (t−3) | 0.856 | ||
| (0.361) | |||
| First demotion (t−2) | 0.747 | ||
| (0.312) | |||
| First demotion (t−1) | 1.705* | ||
| (0.471) | |||
| Share of women in parliament | 1.008 | 1.010 | 1.009 |
| (0.009) | (0.009) | (0.009) | |
| Worse total freedom (political rights + civil liberties) | 0.949** | 0.938** | 0.947** |
| (0.025) | (0.025) | (0.026) | |
| Regional density of criminalization | 3.376** | 3.665*** | 3.548*** |
| (1.666) | (1.843) | (1.715) | |
| Missing information | 0.892 | 0.887* | 0.890 |
| (0.064) | (0.064) | (0.063) | |
| Number of countries | 157 | 157 | 157 |
| Number of inclusions | 129 | 129 | 129 |
| Observations | 1,001 | 1,001 | 1,001 |
| Log Likelihood | -567.804 | -565.836 | -565.762 |
| Note: | p<0.1; p<0.05; p<0.01 | ||
| Robust standard errors in parentheses. All explanatory variables are lagged one period unless otherwise noted. | |||
3.9 The relationship between media coverage of TIP issues and presence in the TIP report
The amount of media coverage of TIP issues in a country appears to be related to that country’s presence in the TIP report. On average, being in the report boosts media coverage by 50.9% (Media Coverage 2: t = 7.67, p < 0.001). This holds true even when controlling for the initial media coverage when a country is first added to the TIP report—coverage is still boosted by 48.6% (Media Coverage 3: t = 6.47, p < 0.001). If we control for the actual incidence of human trafficking, the report effect decreases slightly to 35.1% but remains significant (Media Coverage and incidence: t = 4.64, p < 0.001). Because the dependent variable in each of the logged coverage models is different in each case (since we include lagged coverage as an independent variable), we can interpret the “In report” coefficient as an indicator of continued growth in coverage for each additional year in the report. That is, the effect of being in the report on media coverage intensifies the longer a country is in the report.
| Change in logged coverage | Logged coverage | |||
| Media coverage 1 | Media coverage 2 | Media coverage 3 | Media coverage and incidence | |
| First year in report | 0.209*** | 0.030 | 0.073 | |
| (0.051) | (0.057) | (0.059) | ||
| In report | 0.412*** | 0.396*** | 0.301*** | |
| (0.054) | (0.061) | (0.065) | ||
| Coverage (lagged) | -0.752*** | 0.206*** | 0.208*** | 0.215*** |
| (0.023) | (0.023) | (0.023) | (0.025) | |
| Worse civil liberties | 0.105*** | 0.103*** | 0.103*** | 0.119*** |
| (0.040) | (0.040) | (0.040) | (0.040) | |
| GDP per capita (logged) | 0.302* | 0.257* | 0.262* | 0.205 |
| (0.156) | (0.154) | (0.154) | (0.156) | |
| 2000 TIP protocol ratification | 0.085* | 0.029 | 0.033 | 0.014 |
| (0.050) | (0.050) | (0.050) | (0.052) | |
| Population (logged) | 2.841*** | 2.818*** | 2.821*** | 2.891*** |
| (0.365) | (0.360) | (0.361) | (0.360) | |
| Trafficking intensity in countries of origin | -1.626*** | |||
| (0.273) | ||||
| Trafficking intensity in transit countries | 0.217* | |||
| (0.128) | ||||
| Trafficking intensity in destination countries | -3.090*** | |||
| (0.507) | ||||
| Constant | -54.544*** | -53.208*** | -53.320*** | -35.524*** |
| (7.675) | (7.574) | (7.578) | (4.610) | |
| Year fixed effects | Yes | Yes | Yes | Yes |
| Country fixed effects | Yes | Yes | Yes | Yes |
| Observations | 1,748 | 1,748 | 1,748 | 1,478 |
| R2 | 0.496 | 0.896 | 0.896 | 0.887 |
| Adjusted R2 | 0.435 | 0.883 | 0.883 | 0.873 |
| Residual Std. Error | 0.574 (df = 1558) | 0.567 (df = 1558) | 0.567 (df = 1557) | 0.542 (df = 1314) |
| F Statistic | 8.115*** (df = 189; 1558) | 70.671*** (df = 189; 1558) | 70.268*** (df = 190; 1557) | 63.347*** (df = 163; 1314) |
| Note: | p<0.1; p<0.05; p<0.01 | |||
| All explanatory variables are lagged one period unless otherwise noted. | ||||
3.10 Determinants of having a reaction
3.10.1 Original models
In the original analysis, assignment to more severe tier ratings increases the probability of observing a reaction in the Wikileaks cables: assignment to Tier 2 does not have a significant impact on reactions (Reaction 2: z = 1.81, p = 0.070), while assignment to either the Watchlist or Tier 3 increases the odds by more than five times (Reaction 2: z = 6.04, p < 0.001; z = 5.31, p < 0.001). These results tend to hold up under different specifications of the model and different measurements of US pressure (i.e. combining Watchlist and Tier 3 assignment into one variable).
| Reaction in cables (original models) | |||||
| Reaction 1 | Reaction 2 | Reaction 1 | Reaction 4 | Reaction 5 | |
| Tier 2 | 1.245 | 1.641* | 1.142 | 1.167 | 2.154** |
| (0.300) | (0.449) | (0.297) | (0.311) | (0.647) | |
| Watchlist | 4.150*** | 5.520*** | 3.790*** | 5.861*** | |
| (1.015) | (1.561) | (1.006) | (1.879) | ||
| Tier 3 | 4.027*** | 5.111*** | 5.679*** | 4.116*** | |
| (1.113) | (1.569) | (3.322) | (1.500) | ||
| US aid (logged, lagged) | 1.055*** | 1.015 | 1.011 | 1.033 | |
| (0.020) | (0.018) | (0.020) | (0.022) | ||
| GDP per capita (logged, lagged) | 1.393*** | 1.353*** | |||
| (0.093) | (0.115) | ||||
| Population (logged, lagged) | 1.095* | 0.894 | |||
| (0.053) | (0.066) | ||||
| Tier 3 × US aid (logged, lagged) | 0.973 | ||||
| (0.036) | |||||
| US pressure (Watchlist or Tier 3) | 4.146*** | ||||
| (2.044) | |||||
| US aid (logged, lagged) × US pressure | 0.996 | ||||
| (0.031) | |||||
| Share of total trade with US (lagged) | 1.754 | ||||
| (0.988) | |||||
| Worse total freedom (lagged) | 1.099*** | ||||
| (0.031) | |||||
| 2000 TIP protocol ratification (lagged) | 2.097*** | ||||
| (0.385) | |||||
| Human trafficking news (logged) | 1.723*** | ||||
| (0.190) | |||||
| Constant | 0.099*** | 0.001*** | 0.085*** | 0.089*** | 0.001*** |
| (0.020) | (0.001) | (0.024) | (0.026) | (0.002) | |
| Pseudo R-squared | 0.0581 | 0.0811 | 0.0588 | 0.0584 | 0.1564 |
| Year fixed effects | No | No | No | No | No |
| Observations | 1,356 | 1,320 | 1,356 | 1,356 | 1,118 |
| Log Likelihood | -563.201 | -534.515 | -562.760 | -563.024 | -446.833 |
| Note: | p<0.1; p<0.05; p<0.01 | ||||
| Logit models; odds ratios reported. Non-robust standard errors in parentheses. | |||||
3.10.2 Expanded models (using standard controls)
These findings also hold when using the more standardized controls used throughout this project (i.e. share of women in parliament, worse civil liberties, regional density of criminalization, 2000 TIP protocol ratification, etc.)—being assigned to the Watchlist generally increases the odds of a reaction by ≈4 times, while assignment to Tier 3 increases those odds by ≈5 times.
The new variables measuring US engagement (Wikileaks activity), US funding for TIP activities, and the number of NGOs from our survey database do not have any significant effect on the likelihood of a reaction. in the cables
| Reaction in cables (expanded models) | |||||||
| New reaction 1 | New reaction 2 | New reaction 3 | New reaction 4 | New reaction 5 | New reaction 6 | New reaction 7 | |
| Tier 2 | 1.245 | 1.202 | 1.944** | 1.053 | 1.108 | 1.133 | 1.322 |
| (0.300) | (0.315) | (0.585) | (0.585) | (0.319) | (0.326) | (0.378) | |
| Watchlist | 4.150*** | 3.604*** | 5.622*** | 3.198*** | 3.719*** | 3.797*** | 4.247*** |
| (1.015) | (1.029) | (1.889) | (1.889) | (1.161) | (1.187) | (1.331) | |
| Tier 3 | 4.027*** | 5.252*** | 6.618*** | 5.169*** | 4.837*** | 4.864*** | 9.759*** |
| (1.113) | (1.905) | (2.646) | (2.646) | (1.974) | (1.986) | (4.238) | |
| Share of women in parliament | 0.982** | 0.980** | 0.982** | 0.983* | 0.984* | 0.981* | |
| (0.009) | (0.009) | (0.009) | (0.009) | (0.009) | (0.010) | ||
| Worse civil liberties | 1.013 | 1.069* | 1.009 | 1.044 | 1.041 | 1.016 | |
| (0.027) | (0.037) | (0.037) | (0.031) | (0.031) | (0.030) | ||
| Regional density of criminalization | 0.928 | 0.972 | 0.850 | 1.085 | 1.078 | 1.009 | |
| (0.337) | (0.413) | (0.413) | (0.420) | (0.416) | (0.392) | ||
| 2000 TIP protocol ratification | 1.180 | 1.257 | 1.189 | 1.071 | 1.086 | 1.104 | |
| (0.219) | (0.253) | (0.253) | (0.219) | (0.222) | (0.223) | ||
| US aid (logged) | 1.027 | ||||||
| (0.023) | |||||||
| GDP per capita (logged) | 1.264** | ||||||
| (0.128) | |||||||
| Total population (logged) | 1.179*** | ||||||
| (0.070) | |||||||
| Corruption | 1.320 | ||||||
| (0.255) | |||||||
| NGO density | 0.924 | ||||||
| (0.070) | |||||||
| Proportion of TIP-related cables (observed in Wikileaks) | 7.953* | ||||||
| (9.152) | |||||||
| Proportion of TIP-related cables (estimated) | 0.925 | ||||||
| (0.099) | |||||||
| Number of NGOs (survey database) | 1.013* | ||||||
| (0.007) | |||||||
| Total US funding for TIP (logged) | 1.025* | ||||||
| (0.023) | |||||||
| Constant | 0.099*** | 0.000 | 0.000 | 0.00000 | 0.000 | 0.000 | 0.000 |
| (0.020) | (0.00000) | (0.00000) | (0.00000) | (0.00001) | (0.00001) | (0.00000) | |
| Pseudo R-squared | 0.0581 | 0.2107 | 0.2373 | 0.1936 | 0.1987 | 0.1965 | 0.2403 |
| Year fixed effects | No | Yes | Yes | Yes | Yes | Yes | Yes |
| Observations | 1,356 | 1,311 | 1,292 | 1,233 | 883 | 883 | 1,166 |
| Log Likelihood | -563.201 | -459.184 | -438.642 | -457.574 | -366.345 | -367.352 | -392.536 |
| Note: | p<0.1; p<0.05; p<0.01 | ||||||
| Logit model; odds ratios reported. Non-robust standard errors in parentheses. With the exception of tier ratings, all explanatory variables are lagged one period. | |||||||
3.11 Updated number of human trafficking NGOs
Substituting the number of NGOs in the database used for the survey yields smaller (and seemingly more precise) effects on both the time to entering the report (explained in section 3.3 above) and the time to criminalization. In Extension 1.2, an additional NGO in a country increases the odds of criminalization in a given year by 2% (z = 1.85, p = 0.064), which is a smaller and more precise effect than the original NGO density variable in Extension 1.1 (z = 1.74, p = 0.082). Importantly, however, this effect is only significant at a p=0.1 threshold. The new measure has no effect when used as a covariate for estimating the effect of US engagement. In Extensions 2.1 and 2.2, the original NGO density variable increases the odds of criminalization by roughly 25% (Extension 2.1: z = 2.11, p = 0.035), but that effect drops to an insignificant 2% with the updated measure (Extension 2.3: z = 1.54, p = 0.124). It is likely, however, that the effects are generally similar, since the two measures use different scales.
3.12 The effect of democracy on criminalization
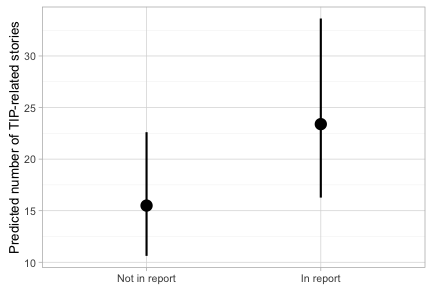
The chapter draft currently claims that the “relationship between being included in the report and time to criminalization depends on the level of democracy” and that “the models reinforce that the relationship between inclusion in the report and time to criminalization appears to be stronger for less democratic countries.” This conclusion is generally borne out in the updated results when using Freedom House’s measure of political rights and civil liberties as a stand-in for democracy.
Countries with worse freedom are around 10% more likely to enter the TIP report (Model 1.3: z = 1.94, p = 0.052), and in every model of criminalization, countries with worse freedom are 2–10% less likely to criminalize in a given year (Model 2.0: z = -1.86, p = 0.063).
3.13 Extension conclusions
Proposition: Countries with more TIP-specific funding from the US will criminalize faster.
There is generally a weak relationship between US funding and time to criminalization.
Proposition: Countries where the US is more diplomatically involved in anti-TIP discussions with senior officials (as measured by Wikileaks cables) will criminalize faster.
There is no relationship between diplomatic involvement and time to criminalization.
Proposition: Countries where there are more human trafficking NGOs will criminalize faster.
More NGOs in a country leads to minor, insubstantial, and generally insignificant increases in the odds of criminalization.
Proposition: The relationship between inclusion in the report and time to criminalization will be stronger for less democratic countries.
Countries with worse civil rights and political liberties are more likely to enter the TIP report and less likely to criminalize trafficking.
NOTE: Far more detailed analysis of interactive effects can be seen here.
4 Final tables to be included in the chapter or appendix
Which tables go here?
5 To do
- Figure out what’s going on with semi-useless cable variables?
- Improve, standardize graphics
Personal correspondence, October 19, 2015.↩