Interactions by treatment
Andrew Heiss
April 25, 2016
- 1 Monitoring (presence in the TIP report)
- 1.1 Democracy × presence in TIP report
- 1.2 NGO engagement × presence in TIP report
- 1.3 Media coverage × presence in TIP report
- 1.4 US foreign aid × presence in TIP report
- 1.5 US trade × presence in TIP report
- 1.6 Protocol ratified × presence in TIP report
- 1.7 Wikileaks engagement/intensity × presence in TIP report
- 1.8 TIP NGO count × presence in TIP report
- 1.9 TIP funding from US × presence in TIP report
- 1.10 Government stability × presence in TIP report
- 1.11 Conflict × presence in TIP report
- 1.12 GDP/capita × presence in TIP report
- 2 Lower tier ratings
- 2.1 Democracy × lower tier ratings
- 2.2 NGO engagement × lower tier ratings
- 2.3 Media coverage × lower tier ratings
- 2.4 US foreign aid × lower tier ratings
- 2.5 US trade × lower tier ratings
- 2.6 Protocol ratified × lower tier ratings
- 2.7 Wikileaks engagement/intensity × lower tier ratings
- 2.8 TIP NGO count × lower tier ratings
- 2.9 TIP funding from US × lower tier ratings
- 2.10 Government stability × lowest tier ratings
- 2.11 Conflict × lowest tier ratings
- 2.12 GDP/capita × lowest tier ratings
- 3 Downgrading
- 3.1 Democracy × downgrading
- 3.2 NGO engagement × downgrading
- 3.3 Media coverage × downgrading
- 3.4 US foreign aid × downgrading
- 3.5 US trade × downgrading
- 3.6 Protocol ratified × downgrading
- 3.7 Wikileaks engagement/intensity × downgrading
- 3.8 TIP NGO count × downgrading
- 3.9 TIP funding from US × downgrading
- 3.10 Government stability × downgrading
- 3.11 Conflict × downgrading
- 3.12 GDP/capita × downgrading
- 4 Summary
1 Monitoring (presence in the TIP report)
1.1 Democracy × presence in TIP report
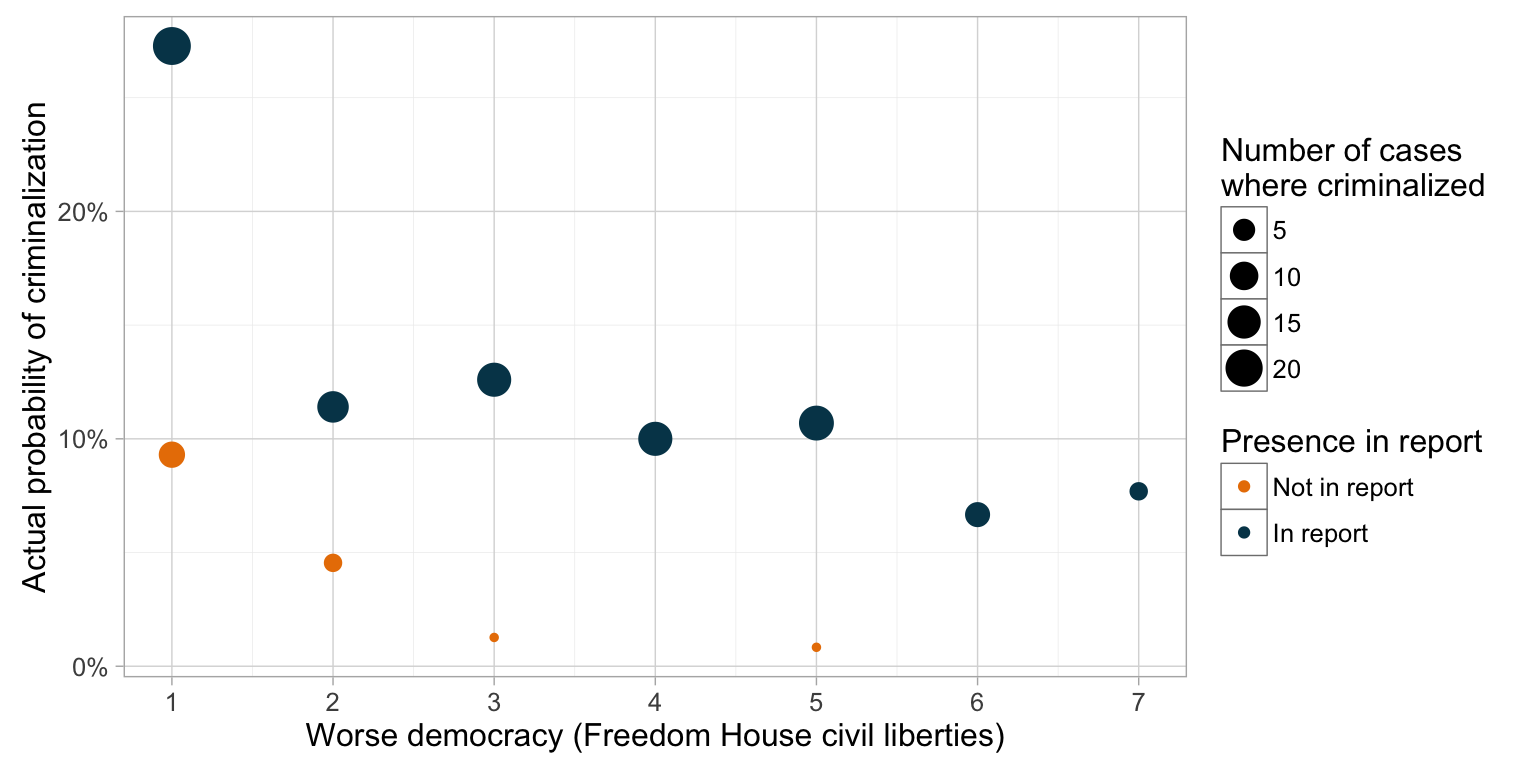
1.1.1 Descriptive
1.1.2 Interactions (models)
| Criminalization | ||
| (1) | (2) | |
| Worse democracy (Freedom House civil liberties) | 0.813*** | 0.360** |
| (0.060) | (0.144) | |
| In TIP report | 4.193*** | 0.634 |
| (1.587) | (0.474) | |
| Share of women in parliament | 1.024** | 1.024** |
| (0.011) | (0.011) | |
| 2000 TIP protocol ratification | 1.785** | 1.980*** |
| (0.458) | (0.515) | |
| Regional density of criminalization | 7.523*** | 8.528*** |
| (4.229) | (4.904) | |
| Missing info | 1.265*** | 1.237** |
| (0.114) | (0.112) | |
| Worse democracy × In TIP report | 2.471** | |
| (1.007) | ||
| Constant | 0.018*** | 0.091*** |
| (0.010) | (0.075) | |
| Year fixed effects | Yes | Yes |
| Pseudo R-squared | 0.1359 | 0.1512 |
| Observations | 1,031 | 1,031 |
| Log Likelihood | -277.868 | -272.931 |
| Note: | p<0.1; p<0.05; p<0.01 | |
| Log odds reported; standard errors in parentheses. All explanatory variables are lagged one period unless otherwise noted. | ||
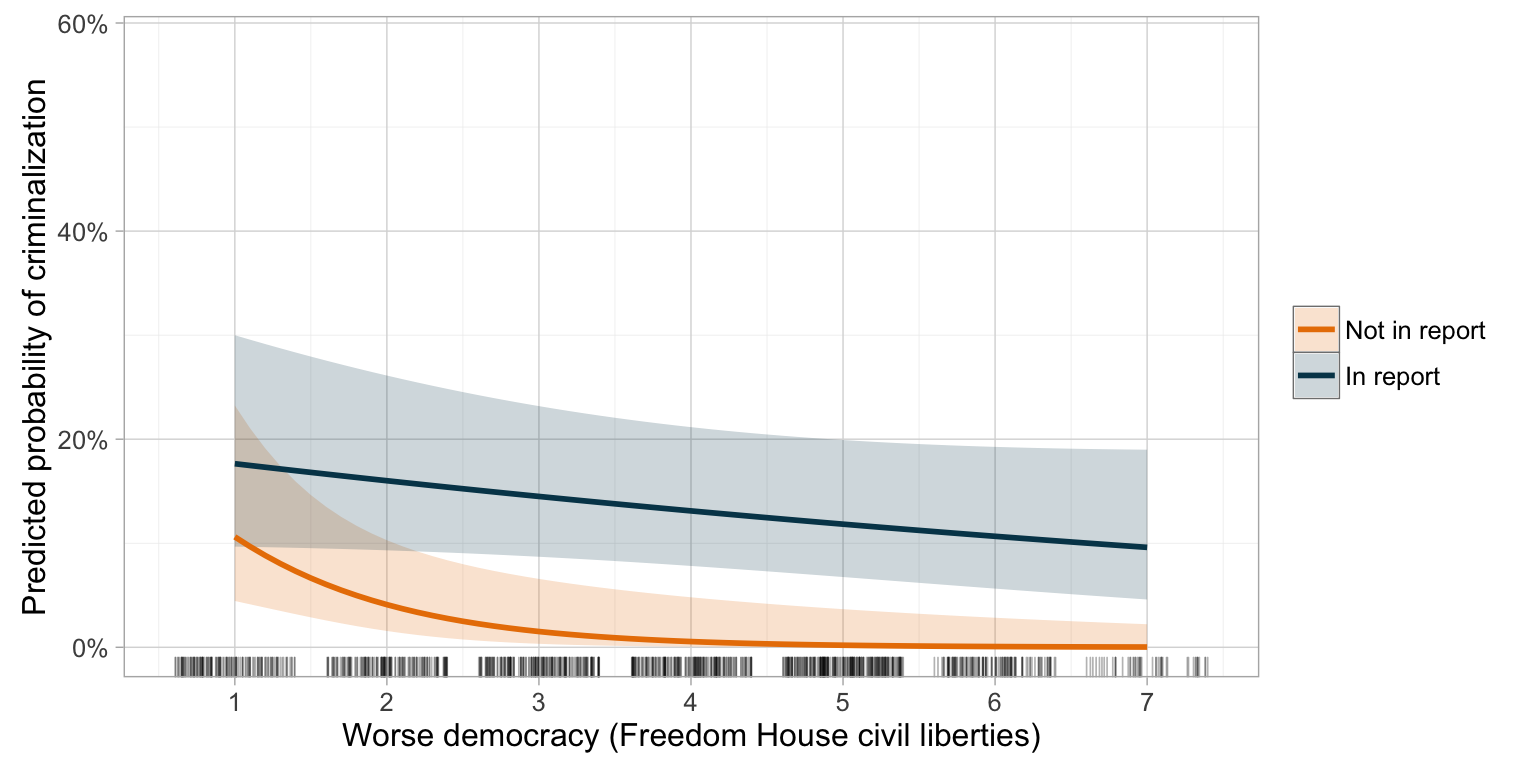
1.1.3 Interactions (visualized)
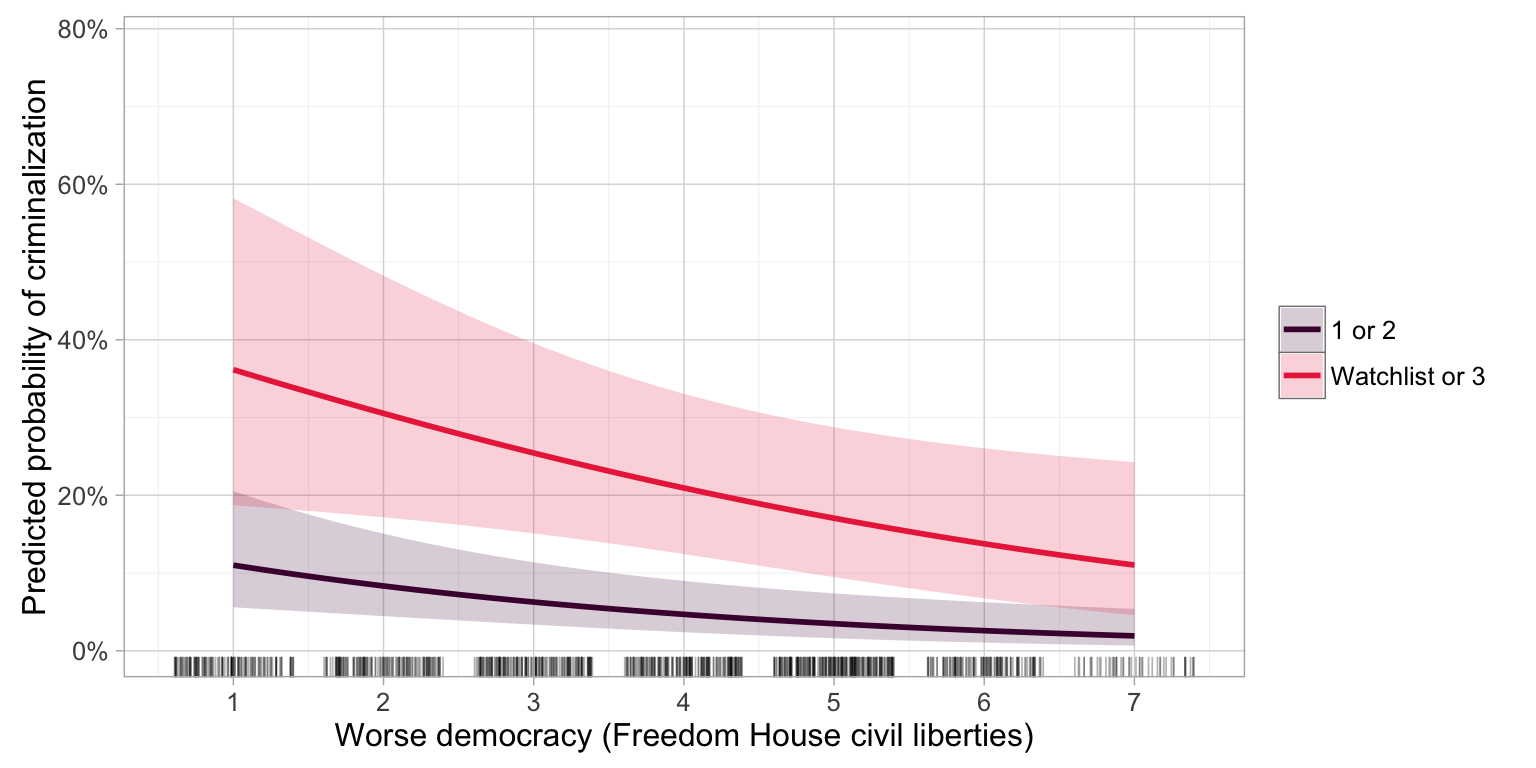
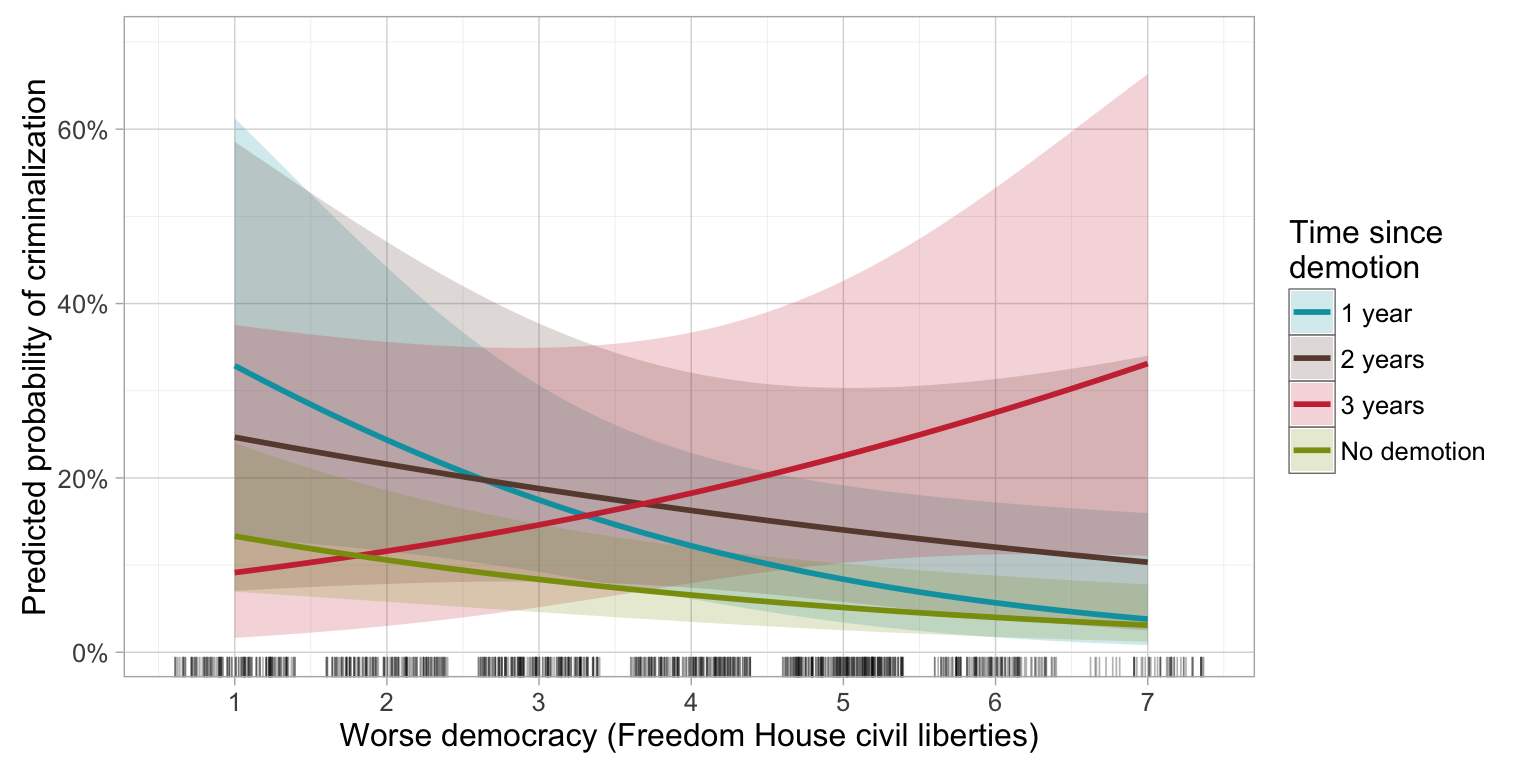
Note: All covariate values held at their mean or modal values; year held constant at 2005. Rug below indicates actual observed values.
1.2 NGO engagement × presence in TIP report
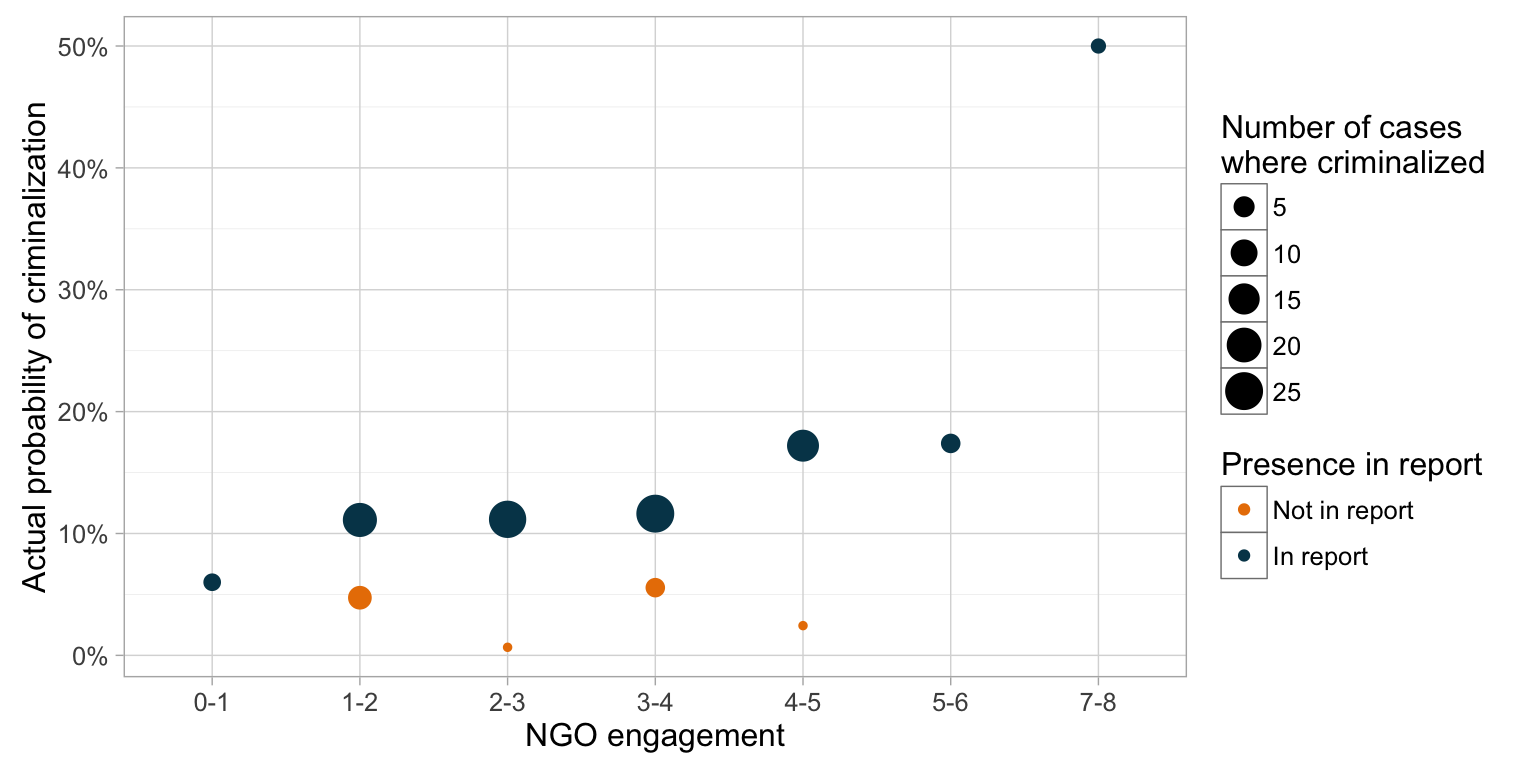
1.2.1 Descriptive
1.2.2 Interactions (models)
| Criminalization | ||
| (1) | (2) | |
| NGO engagement | 1.073 | 0.848 |
| (0.094) | (0.223) | |
| Worse democracy (Freedom House civil liberties) | 0.822*** | 0.819*** |
| (0.061) | (0.061) | |
| In TIP report | 3.962*** | 1.961 |
| (1.515) | (1.526) | |
| Share of women in parliament | 1.025** | 1.025** |
| (0.011) | (0.011) | |
| 2000 TIP protocol ratification | 1.821** | 1.803** |
| (0.470) | (0.465) | |
| Regional density of criminalization | 6.856*** | 6.714*** |
| (3.933) | (3.829) | |
| Missing info | 1.267*** | 1.262*** |
| (0.114) | (0.113) | |
| NGO engagement × In TIP report | 1.306 | |
| (0.359) | ||
| Constant | 0.014*** | 0.026*** |
| (0.009) | (0.024) | |
| Year fixed effects | Yes | Yes |
| Pseudo R-squared | 0.1348 | 0.1365 |
| Observations | 1,022 | 1,022 |
| Log Likelihood | -277.435 | -276.899 |
| Note: | p<0.1; p<0.05; p<0.01 | |
| Log odds reported; standard errors in parentheses. All explanatory variables are lagged one period unless otherwise noted. | ||
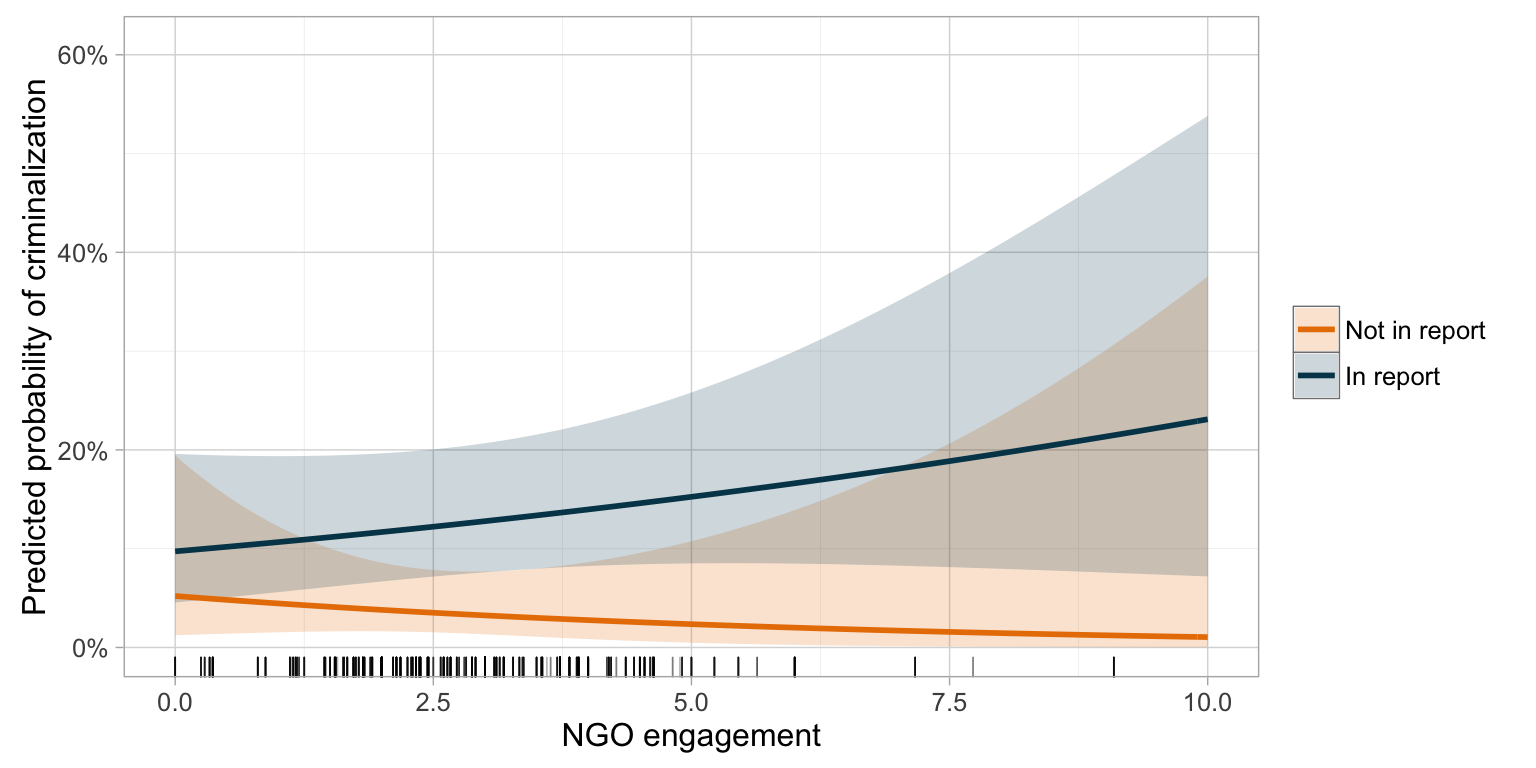
1.2.3 Interactions (visualized)
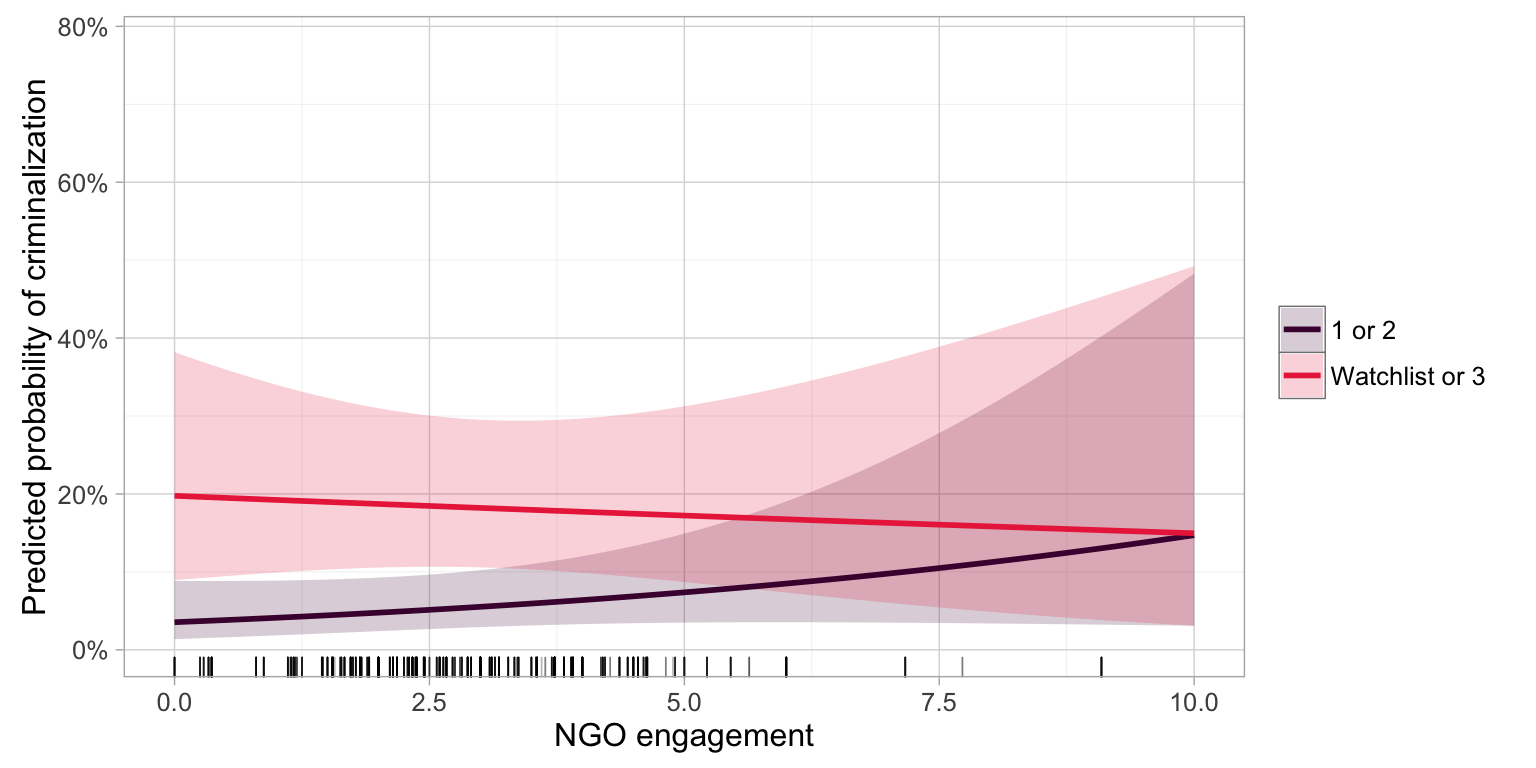
Note: All covariate values held at their mean or modal values; year held constant at 2005. Rug below indicates actual observed values.
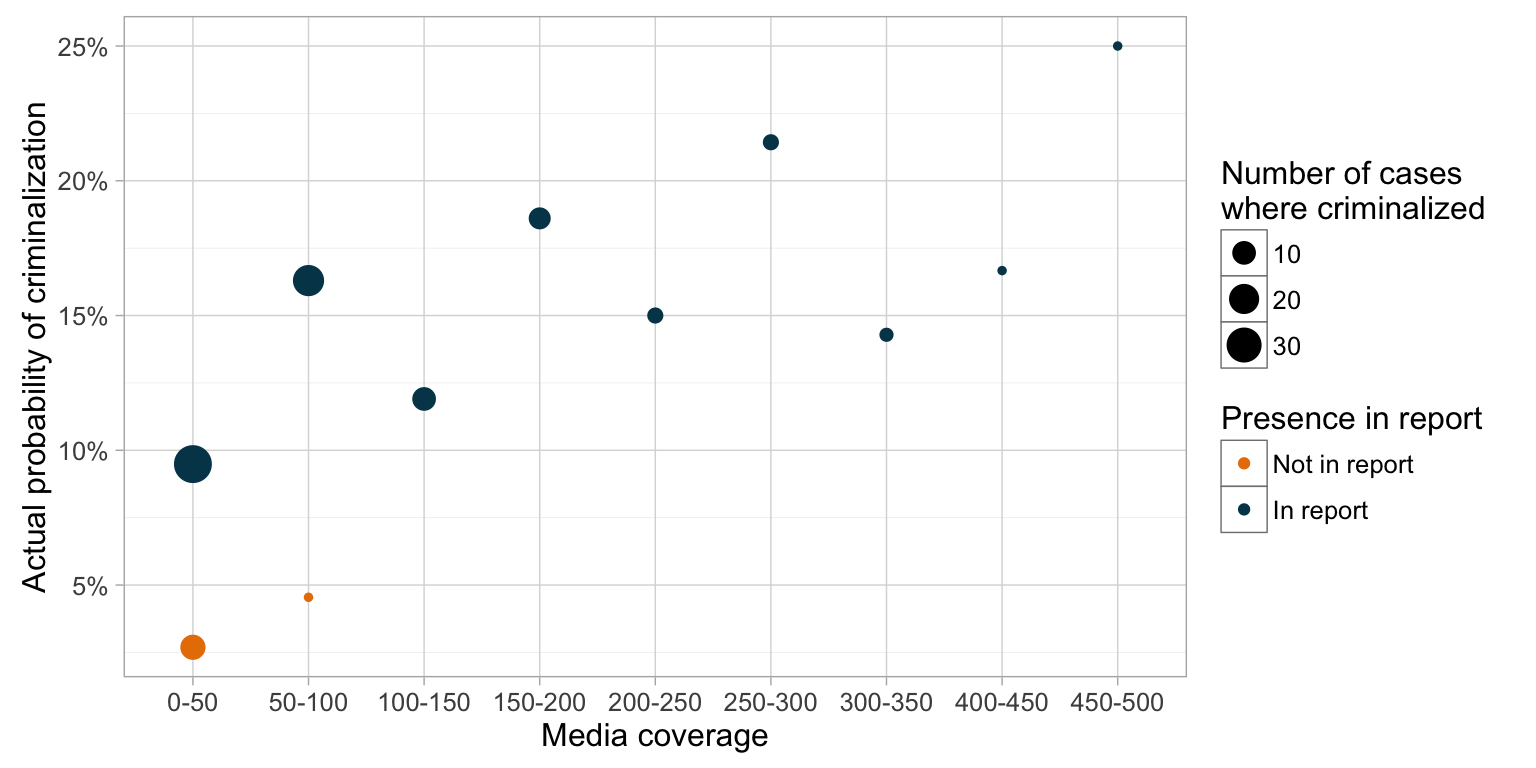
1.3 Media coverage × presence in TIP report
1.3.1 Descriptive
1.3.2 Interactions (models)
| Criminalization | ||||
| (1) | (2) | (3) | (4) | |
| Media coverage | 1.002** | 1.001 | 0.996 | 0.997 |
| (0.001) | (0.001) | (0.011) | (0.012) | |
| Worse democracy (Freedom House civil liberties) | 0.794*** | 0.795*** | ||
| (0.059) | (0.059) | |||
| In TIP report | 4.044*** | 3.628*** | 3.284*** | 3.612*** |
| (1.543) | (1.213) | (1.228) | (1.552) | |
| Share of women in parliament | 1.023** | 1.023** | ||
| (0.011) | (0.011) | |||
| 2000 TIP protocol ratification | 2.114*** | 2.107*** | ||
| (0.570) | (0.568) | |||
| Regional density of criminalization | 7.091*** | 7.212*** | ||
| (3.989) | (4.071) | |||
| Missing info | 1.356*** | 1.350*** | ||
| (0.130) | (0.130) | |||
| Media coverage × In TIP report | 1.005 | 1.006 | ||
| (0.011) | (0.012) | |||
| Constant | 0.015*** | 0.035*** | 0.038*** | 0.017*** |
| (0.009) | (0.011) | (0.013) | (0.010) | |
| Year fixed effects | Yes | No | No | Yes |
| Pseudo R-squared | 0.1426 | 0.0366 | 0.0371 | 0.1431 |
| Observations | 1,031 | 1,046 | 1,046 | 1,031 |
| Log Likelihood | -275.709 | -313.400 | -313.226 | -275.541 |
| Note: | p<0.1; p<0.05; p<0.01 | |||
| Log odds reported; standard errors in parentheses. All explanatory variables are lagged one period unless otherwise noted. | ||||
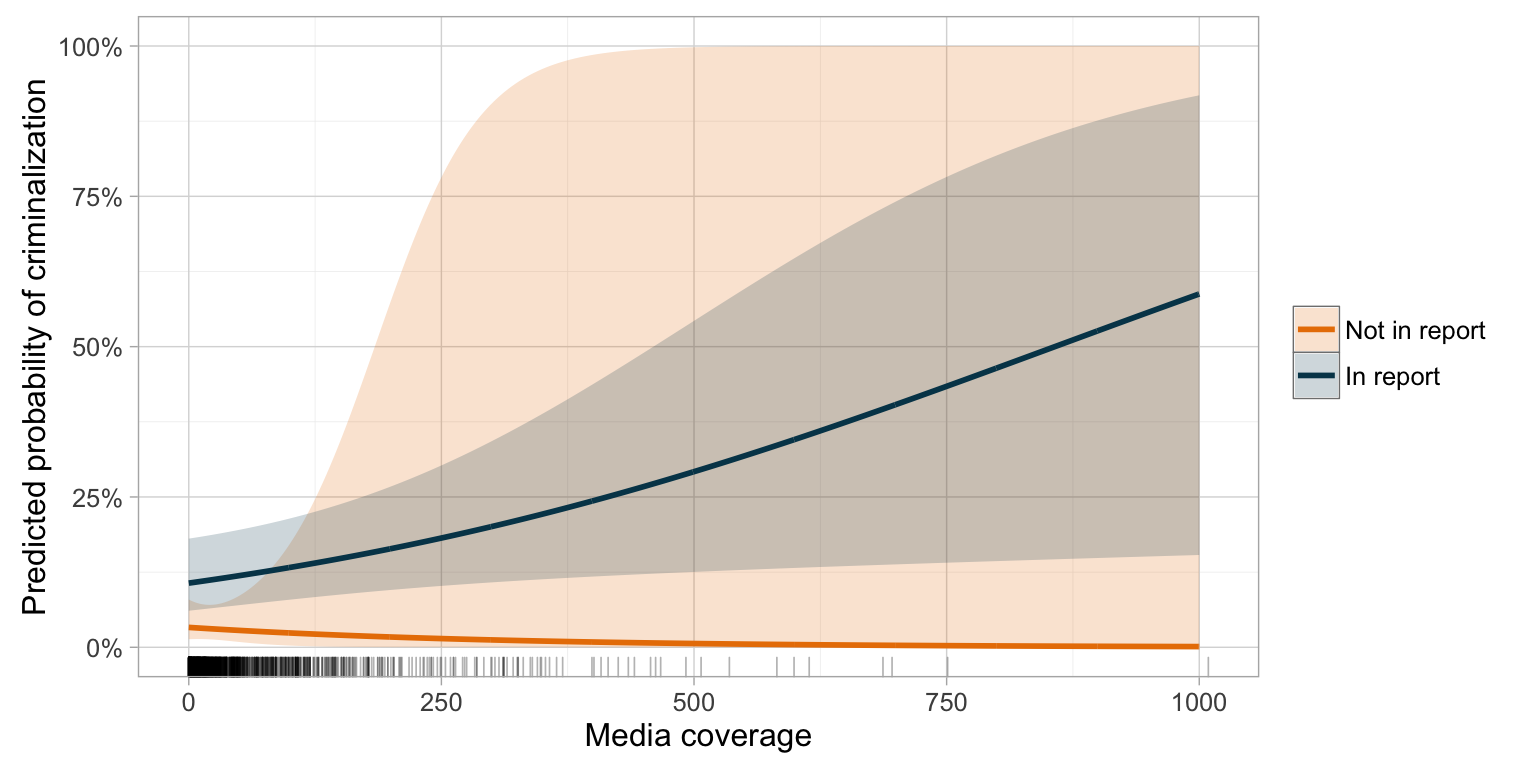
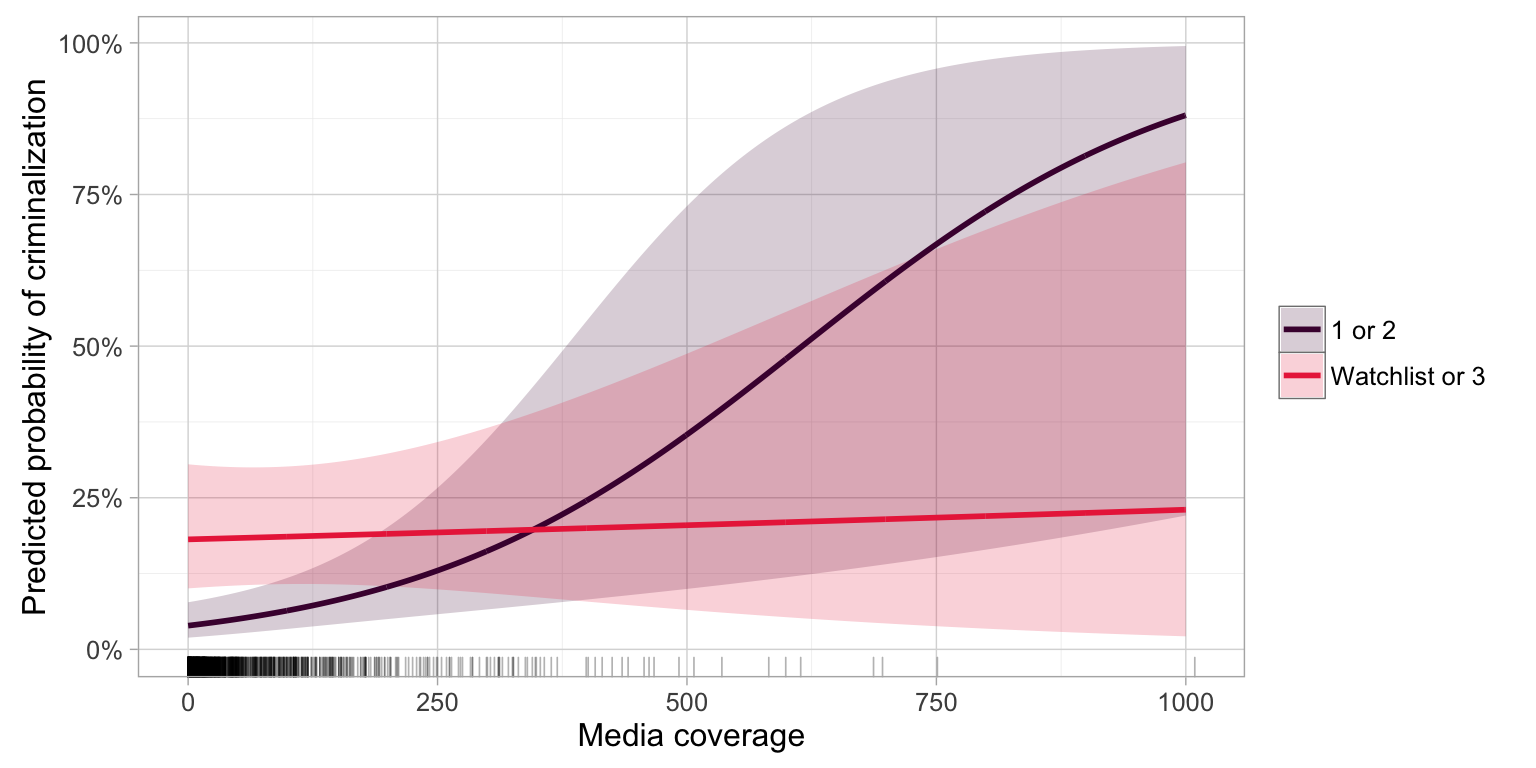
1.3.3 Interactions (visualized)
Note: All covariate values held at their mean or modal values; year held constant at 2005. Rug below indicates actual observed values.
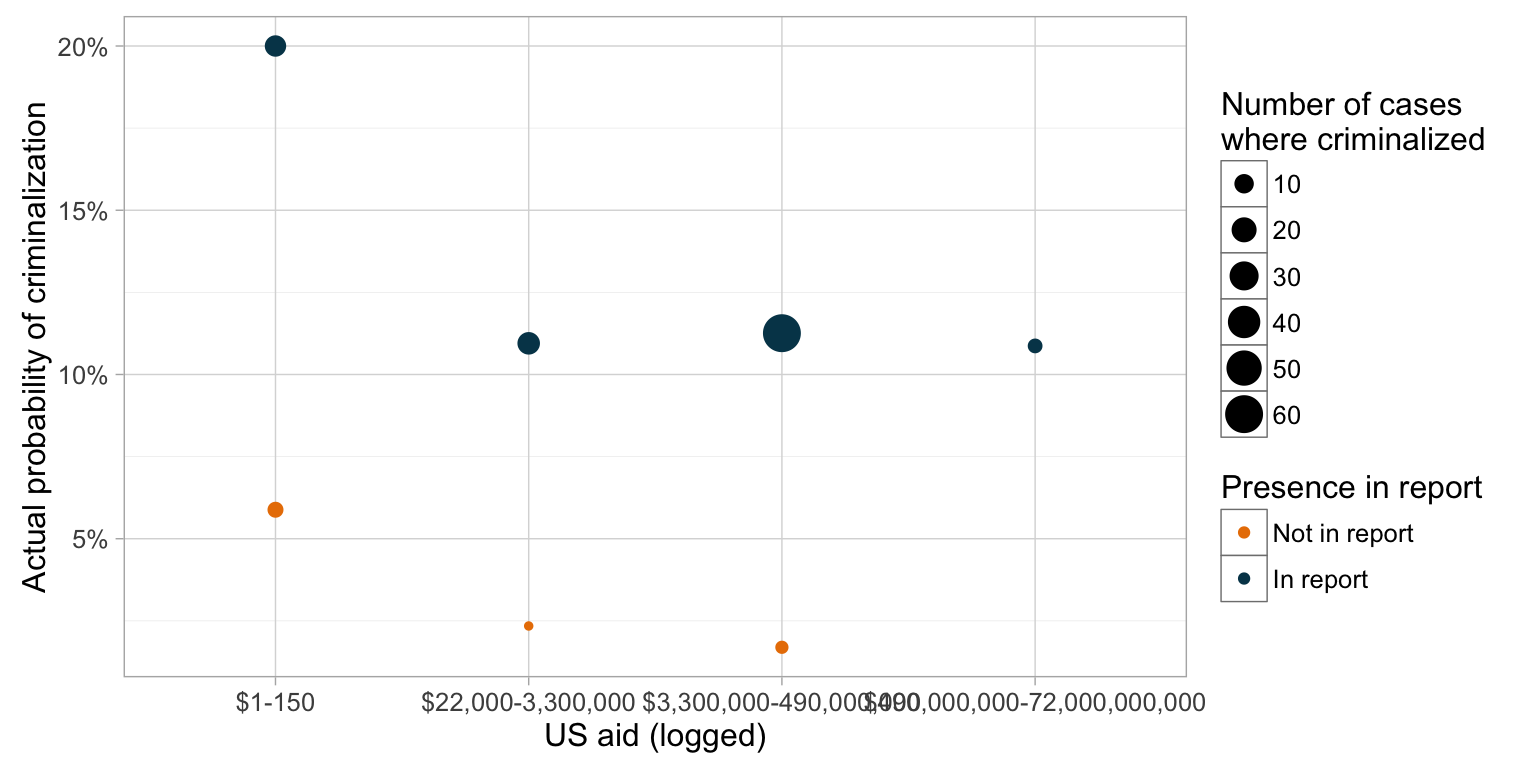
1.4 US foreign aid × presence in TIP report
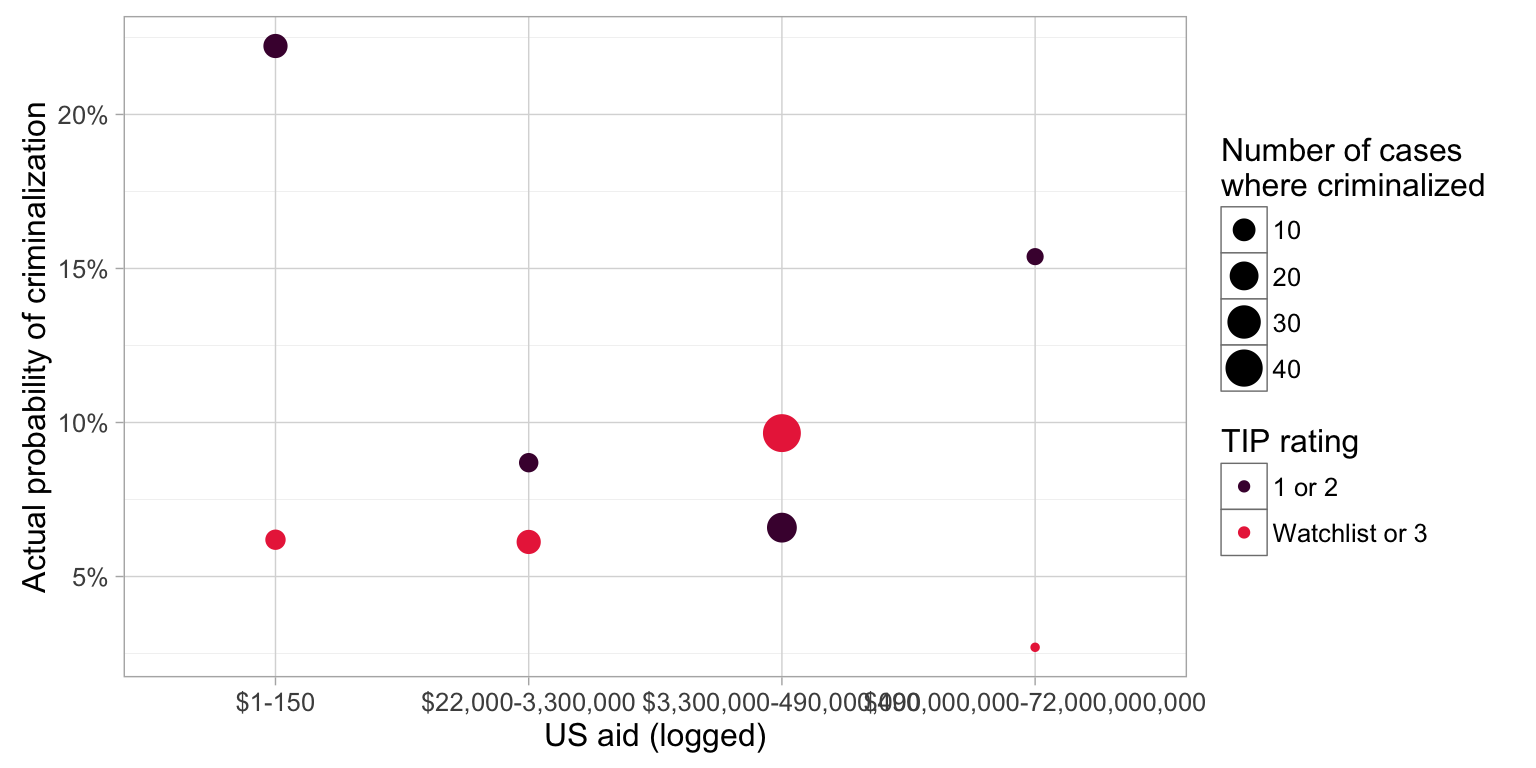
1.4.1 Descriptive
1.4.2 Interactions (models)
| Criminalization | ||
| (1) | (2) | |
| US aid (logged) | 0.977 | 0.922** |
| (0.022) | (0.038) | |
| Worse democracy (Freedom House civil liberties) | 0.841** | 0.839** |
| (0.067) | (0.068) | |
| In TIP report | 4.226*** | 1.972 |
| (1.599) | (1.122) | |
| Share of women in parliament | 1.023** | 1.023** |
| (0.011) | (0.011) | |
| 2000 TIP protocol ratification | 1.938** | 1.922** |
| (0.522) | (0.519) | |
| Regional density of criminalization | 6.704*** | 7.363*** |
| (3.847) | (4.280) | |
| Missing info | 1.237** | 1.248** |
| (0.115) | (0.116) | |
| US aid × In TIP report | 1.079* | |
| (0.049) | ||
| Constant | 0.023*** | 0.038*** |
| (0.014) | (0.025) | |
| Year fixed effects | Yes | Yes |
| Pseudo R-squared | 0.1376 | 0.1419 |
| Observations | 1,031 | 1,031 |
| Log Likelihood | -277.322 | -275.922 |
| Note: | p<0.1; p<0.05; p<0.01 | |
| Log odds reported; standard errors in parentheses. All explanatory variables are lagged one period unless otherwise noted. | ||
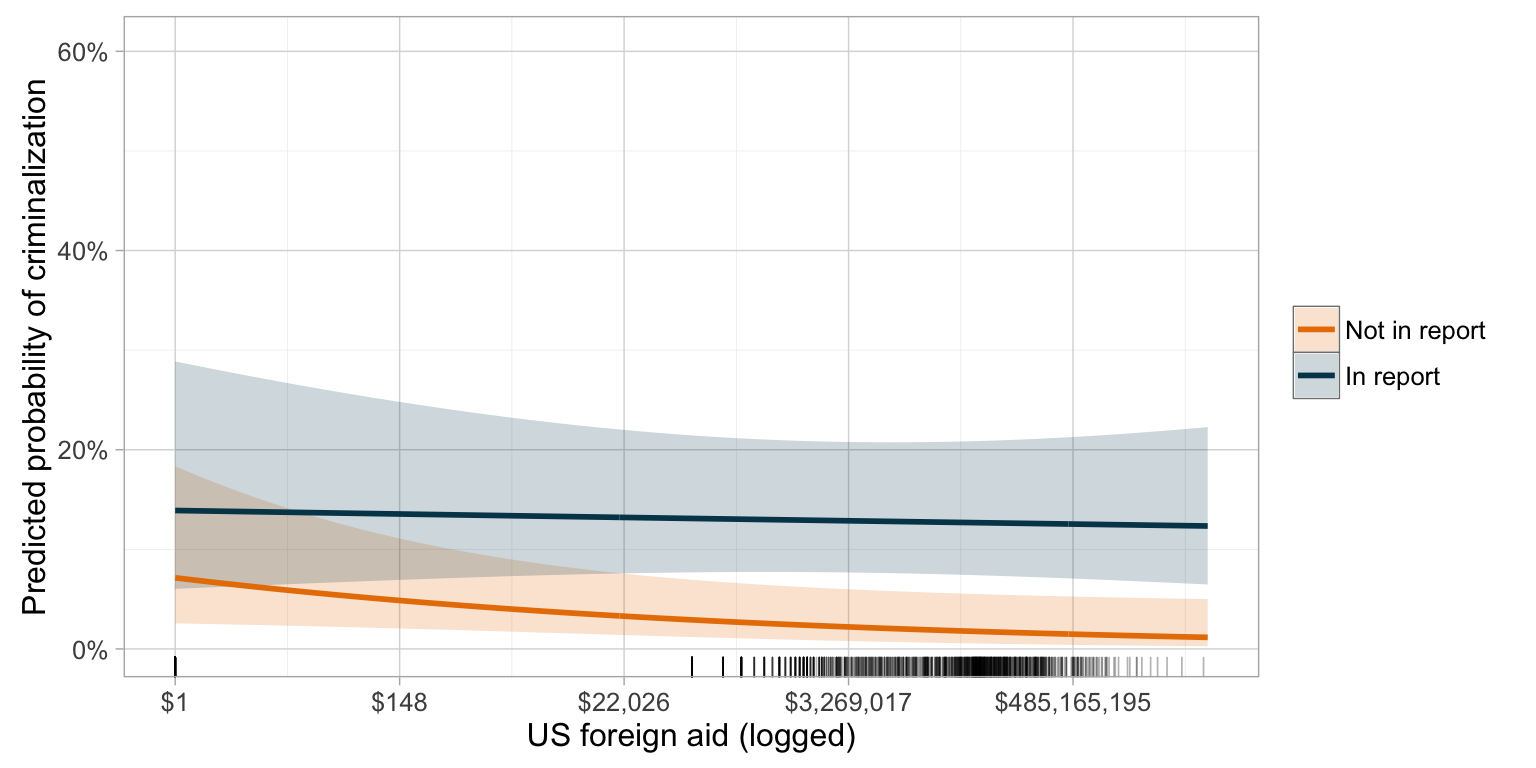
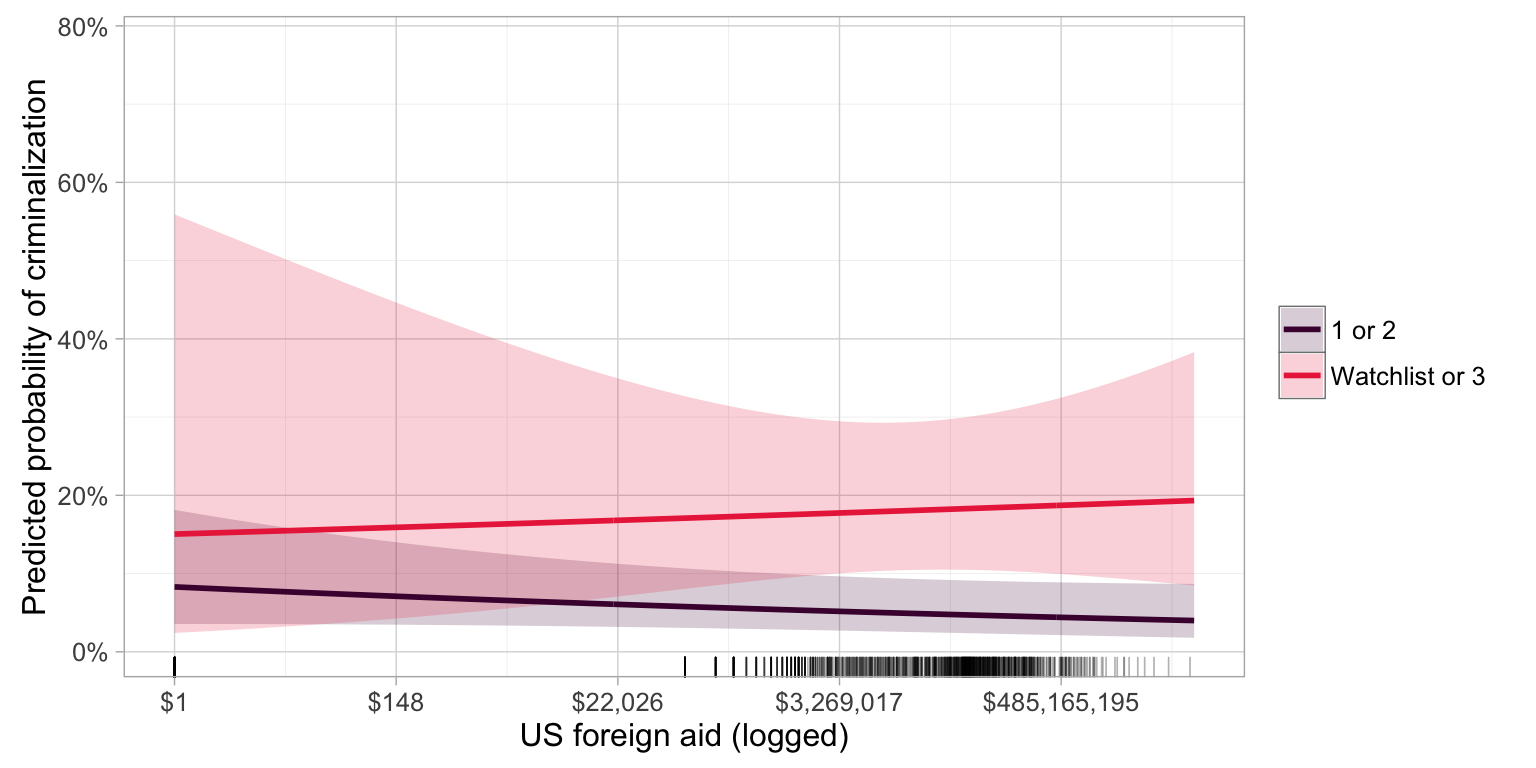
1.4.3 Interactions (visualized)
Note: All covariate values held at their mean or modal values; year held constant at 2005. Rug below indicates actual observed values.
1.5 US trade × presence in TIP report
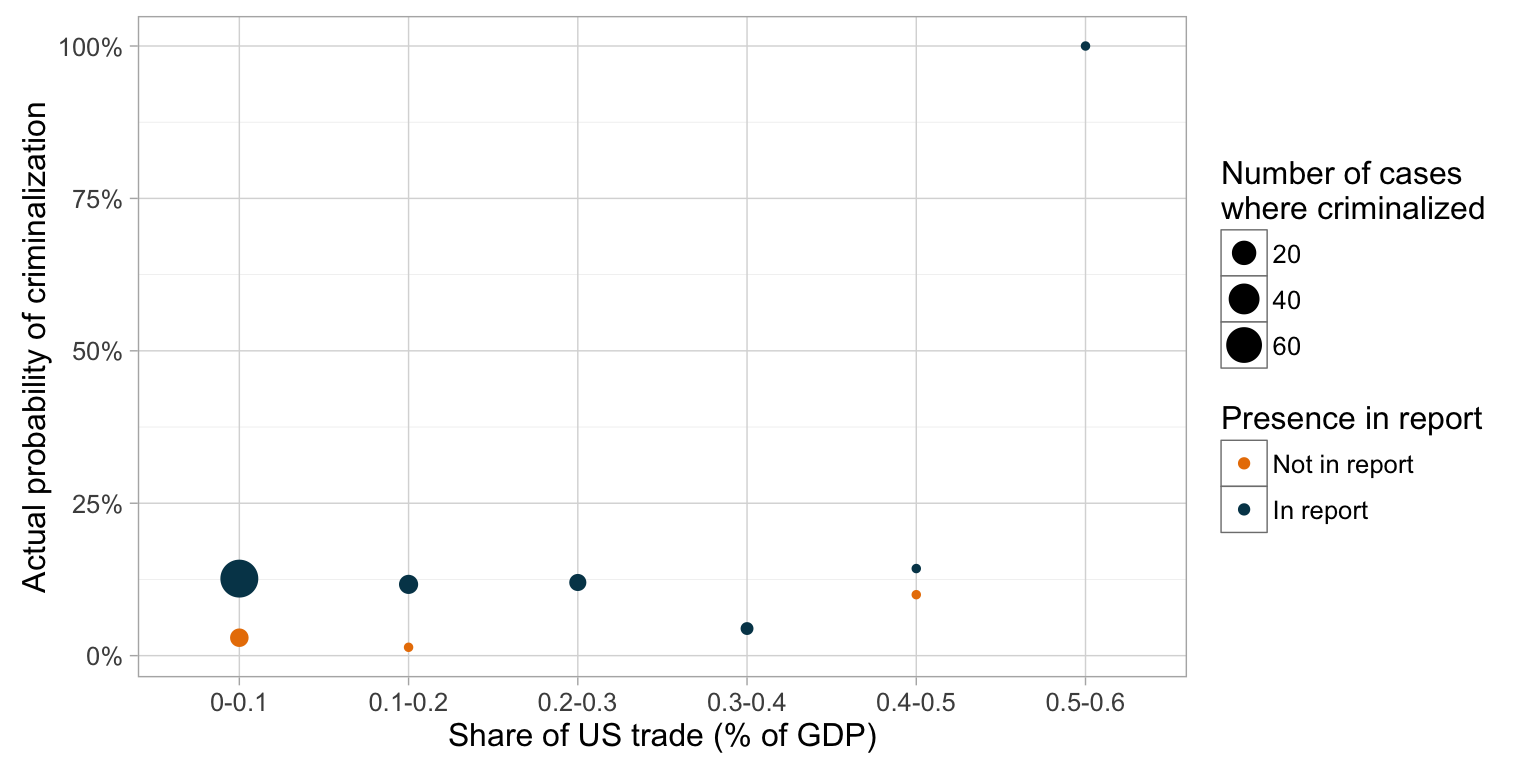
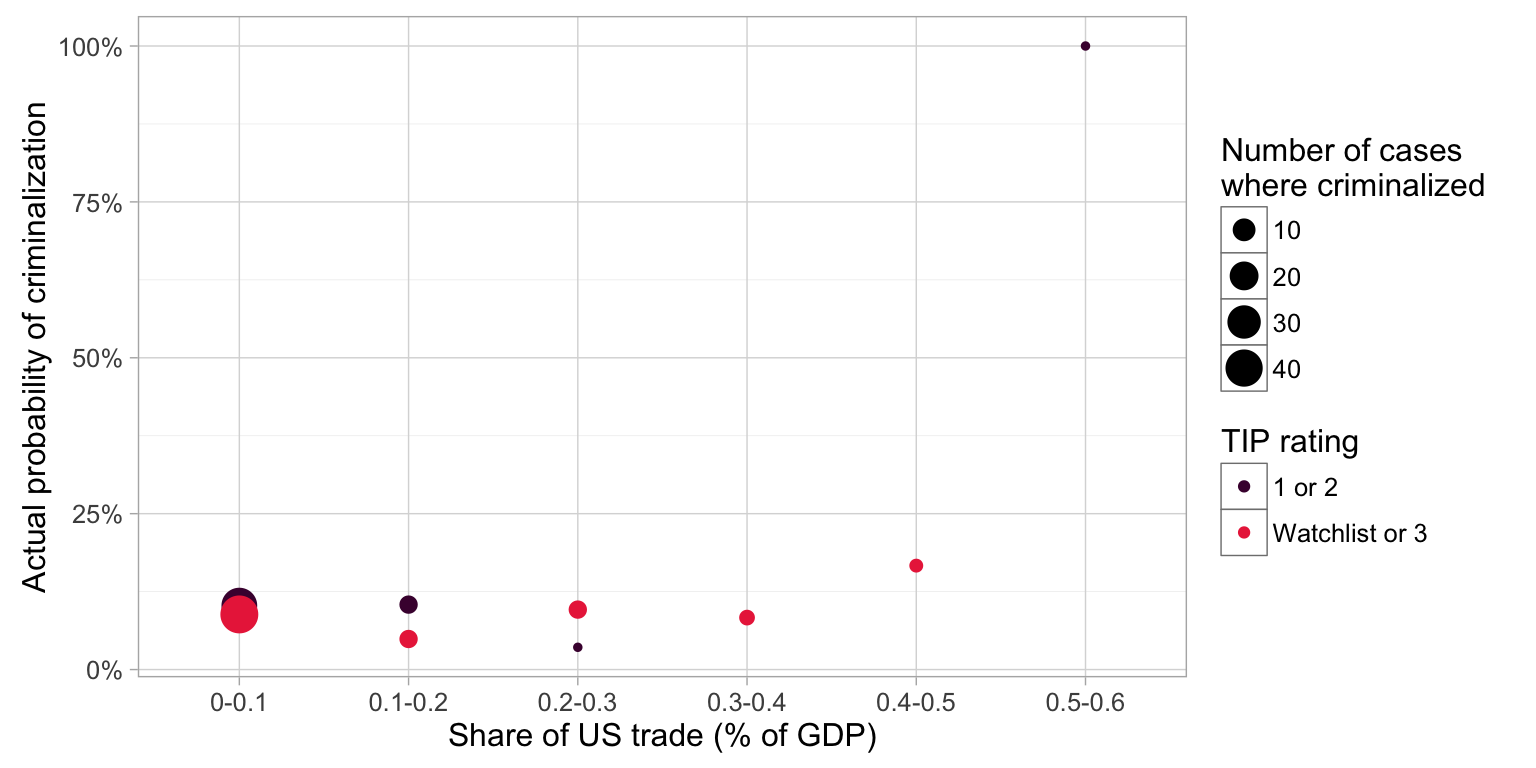
1.5.1 Descriptive
1.5.2 Interactions (models)
| Criminalization | ||
| (1) | (2) | |
| Share of US trade (% of GDP) | 1.844 | 2.355 |
| (2.067) | (6.331) | |
| Worse democracy (Freedom House civil liberties) | 0.858** | 0.859** |
| (0.066) | (0.066) | |
| In TIP report | 3.995*** | 4.143** |
| (1.656) | (2.298) | |
| Share of women in parliament | 1.027** | 1.027** |
| (0.011) | (0.011) | |
| 2000 TIP protocol ratification | 1.814** | 1.814** |
| (0.481) | (0.481) | |
| Regional density of criminalization | 8.735*** | 8.745*** |
| (5.084) | (5.091) | |
| Missing info | 1.204* | 1.203* |
| (0.114) | (0.114) | |
| Trade share × In TIP report | 0.746 | |
| (2.194) | ||
| Constant | 0.017*** | 0.016*** |
| (0.011) | (0.012) | |
| Year fixed effects | Yes | Yes |
| Pseudo R-squared | 0.1282 | 0.1282 |
| Observations | 940 | 940 |
| Log Likelihood | -264.497 | -264.492 |
| Note: | p<0.1; p<0.05; p<0.01 | |
| Log odds reported; standard errors in parentheses. All explanatory variables are lagged one period unless otherwise noted. | ||
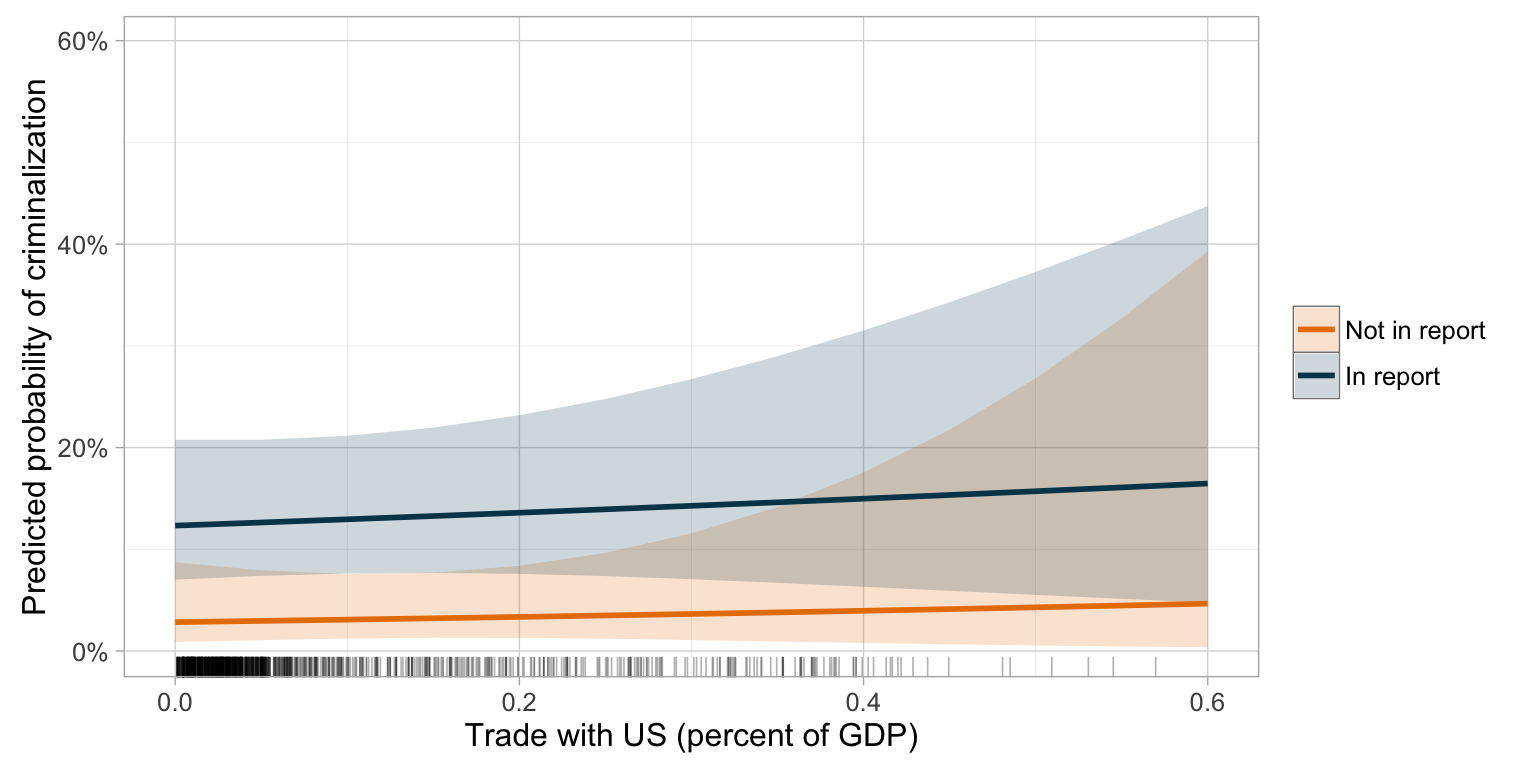
1.5.3 Interactions (visualized)
Note: All covariate values held at their mean or modal values; year held constant at 2005. Rug below indicates actual observed values.
1.6 Protocol ratified × presence in TIP report
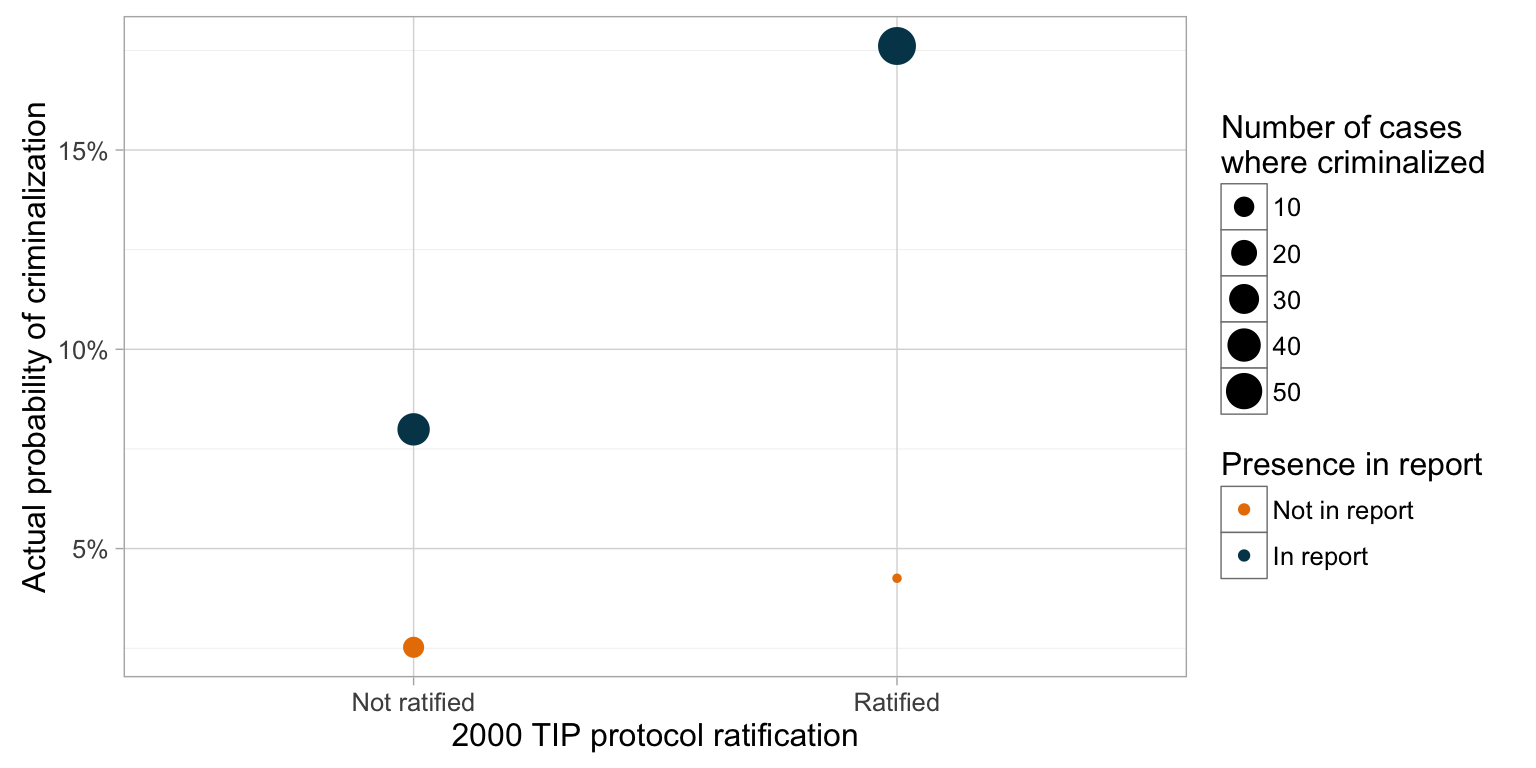
1.6.1 Descriptive
1.6.2 Interactions (models)
| Criminalization | ||
| (1) | (2) | |
| Worse democracy (Freedom House civil liberties) | 0.813*** | 0.816*** |
| (0.060) | (0.061) | |
| In TIP report | 4.193*** | 3.859*** |
| (1.587) | (1.649) | |
| Share of women in parliament | 1.024** | 1.024** |
| (0.011) | (0.011) | |
| 2000 TIP protocol ratification | 1.785** | 1.313 |
| (0.458) | (1.086) | |
| Regional density of criminalization | 7.523*** | 7.529*** |
| (4.229) | (4.252) | |
| Missing info | 1.265*** | 1.263*** |
| (0.114) | (0.114) | |
| Protocol ratification × In TIP report | 1.400 | |
| (1.197) | ||
| Constant | 0.018*** | 0.019*** |
| (0.010) | (0.011) | |
| Year fixed effects | Yes | Yes |
| Pseudo R-squared | 0.1359 | 0.1361 |
| Observations | 1,031 | 1,031 |
| Log Likelihood | -277.868 | -277.787 |
| Note: | p<0.1; p<0.05; p<0.01 | |
| Log odds reported; standard errors in parentheses. All explanatory variables are lagged one period unless otherwise noted. | ||
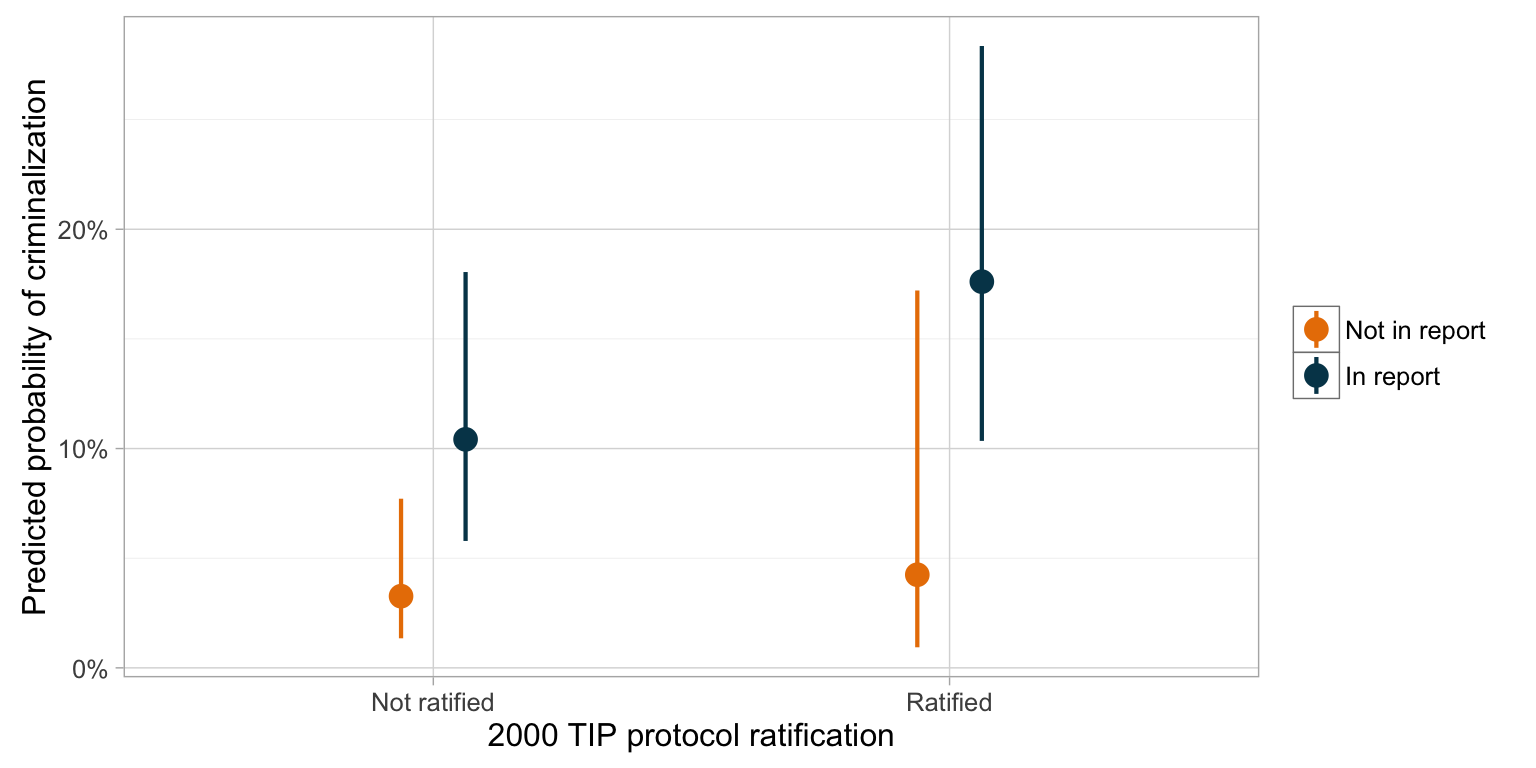
1.6.3 Interactions (visualized)
Note: All covariate values held at their mean or modal values; year held constant at 2005.
1.7 Wikileaks engagement/intensity × presence in TIP report
1.7.1 Descriptive
1.7.2 Interactions (models)
| Criminalization | ||
| (1) | (2) | |
| Proportion of TIP-related cables (observed in Wikileaks) | 7.360 | 21.798 |
| (12.025) | (89.313) | |
| Worse democracy (Freedom House civil liberties) | 0.804** | 0.804** |
| (0.080) | (0.080) | |
| In TIP report | 7.890*** | 8.392*** |
| (6.005) | (6.778) | |
| Share of women in parliament | 1.021 | 1.021 |
| (0.013) | (0.013) | |
| 2000 TIP protocol ratification | 1.492 | 1.497 |
| (0.478) | (0.480) | |
| Regional density of criminalization | 4.624** | 4.619** |
| (3.118) | (3.115) | |
| Missing info | 1.358*** | 1.359*** |
| (0.159) | (0.160) | |
| TIP cables × In TIP report | 0.295 | |
| (1.315) | ||
| Constant | 0.005*** | 0.004*** |
| (0.006) | (0.006) | |
| Year fixed effects | Yes | Yes |
| Pseudo R-squared | 0.1424 | 0.1426 |
| Observations | 563 | 563 |
| Log Likelihood | -165.634 | -165.604 |
| Note: | p<0.1; p<0.05; p<0.01 | |
| Log odds reported; standard errors in parentheses. All explanatory variables are lagged one period unless otherwise noted. | ||
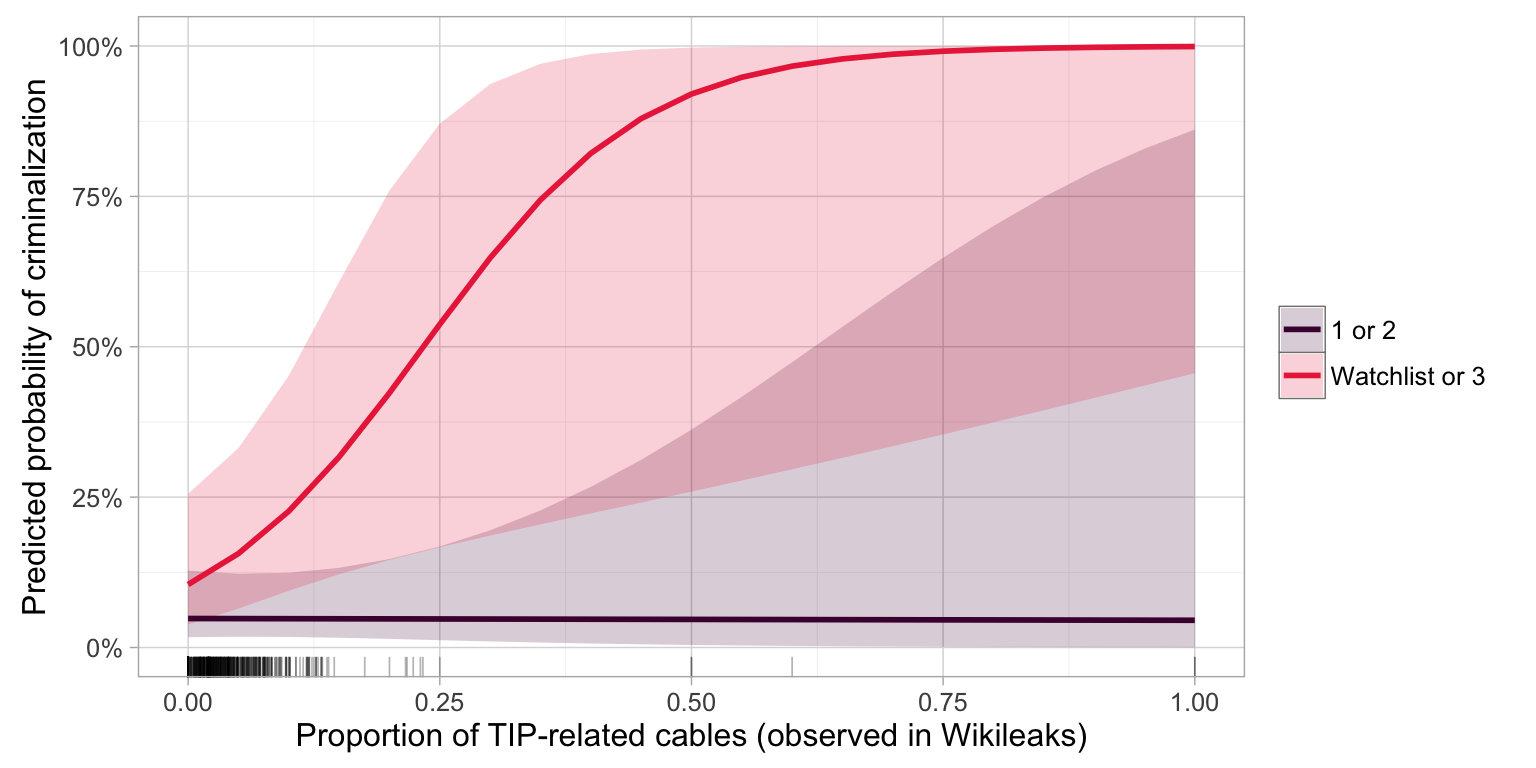
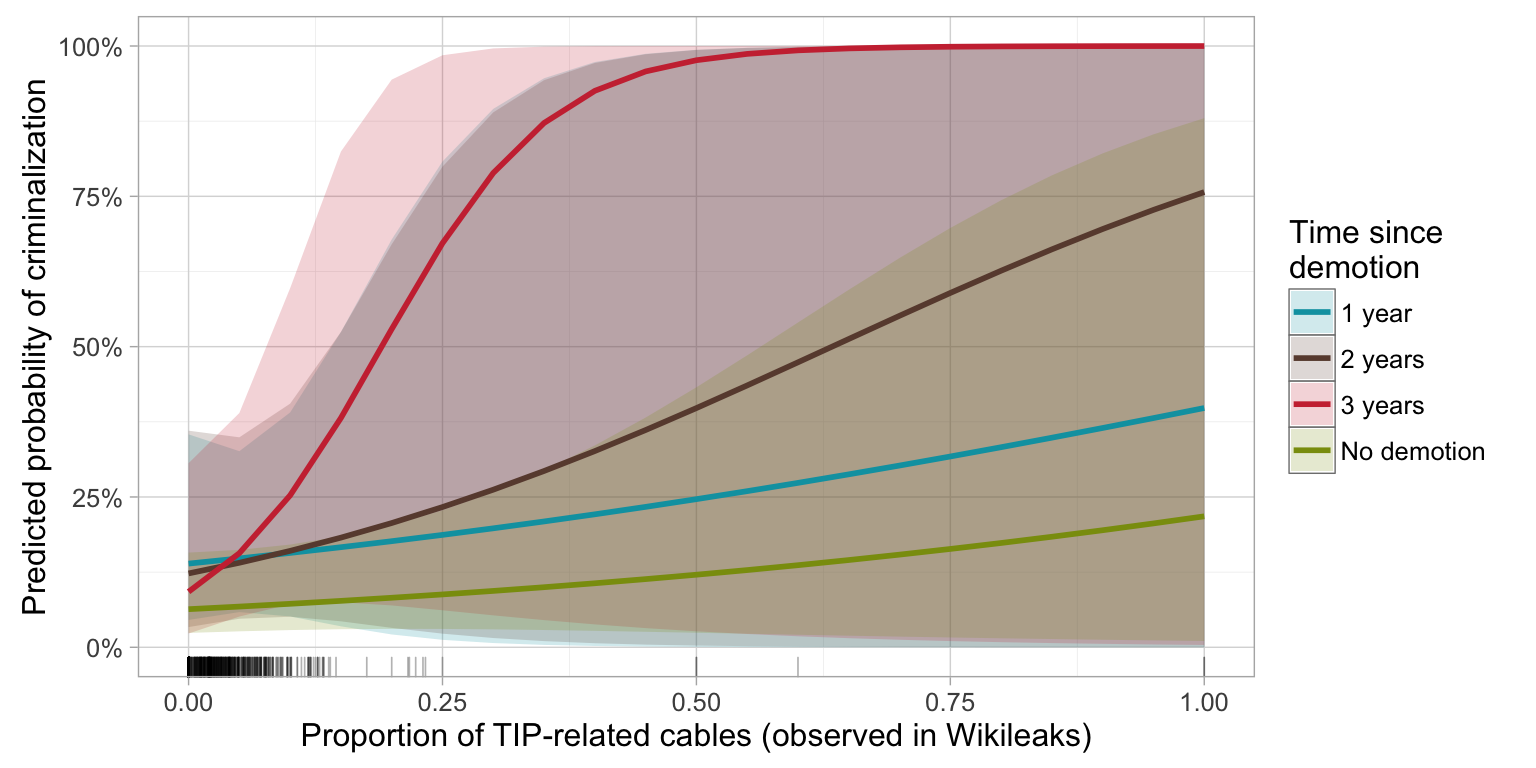
1.7.3 Interactions (visualized)
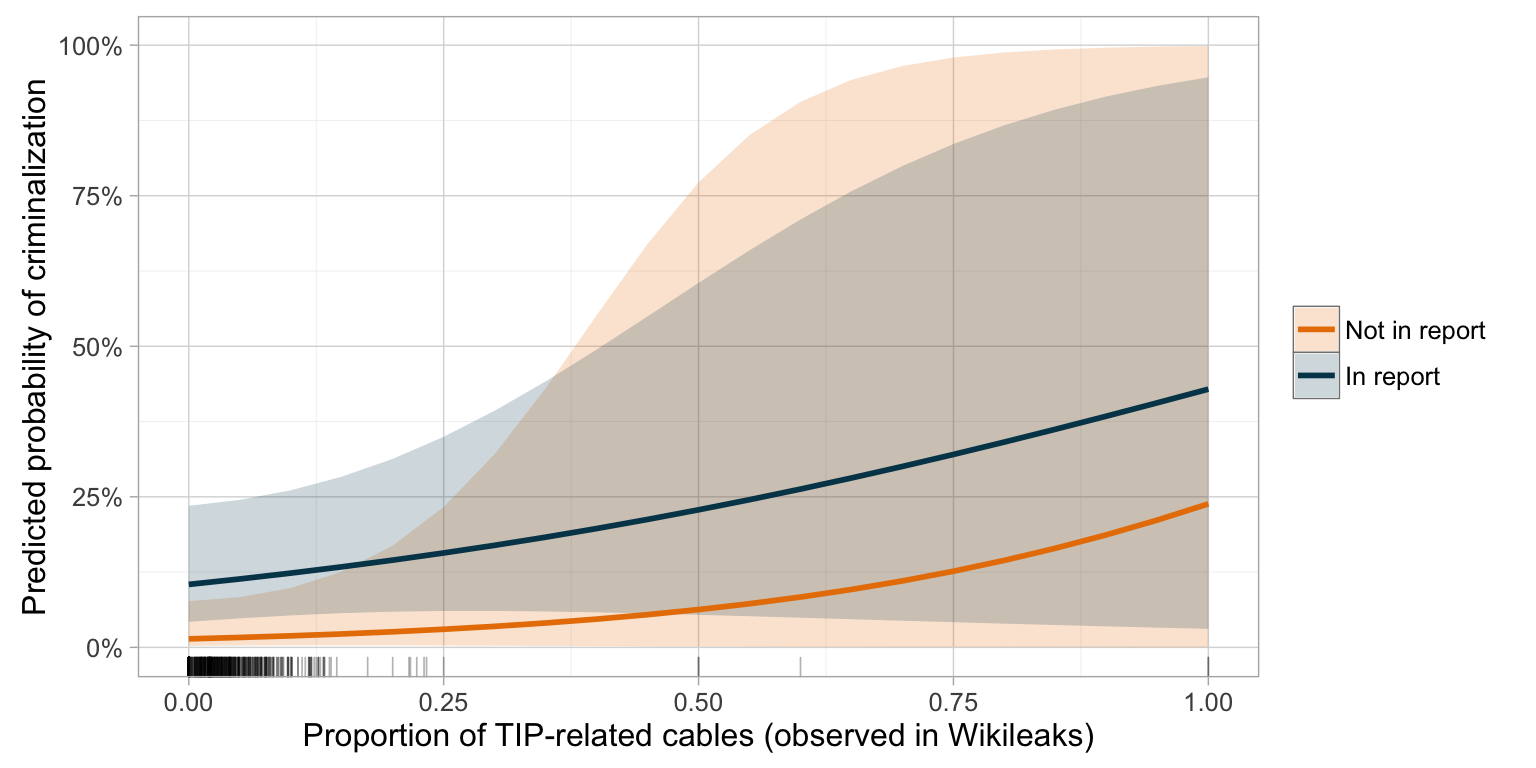
Note: All covariate values held at their mean or modal values; year held constant at 2005. Rug below indicates actual observed values.
1.8 TIP NGO count × presence in TIP report
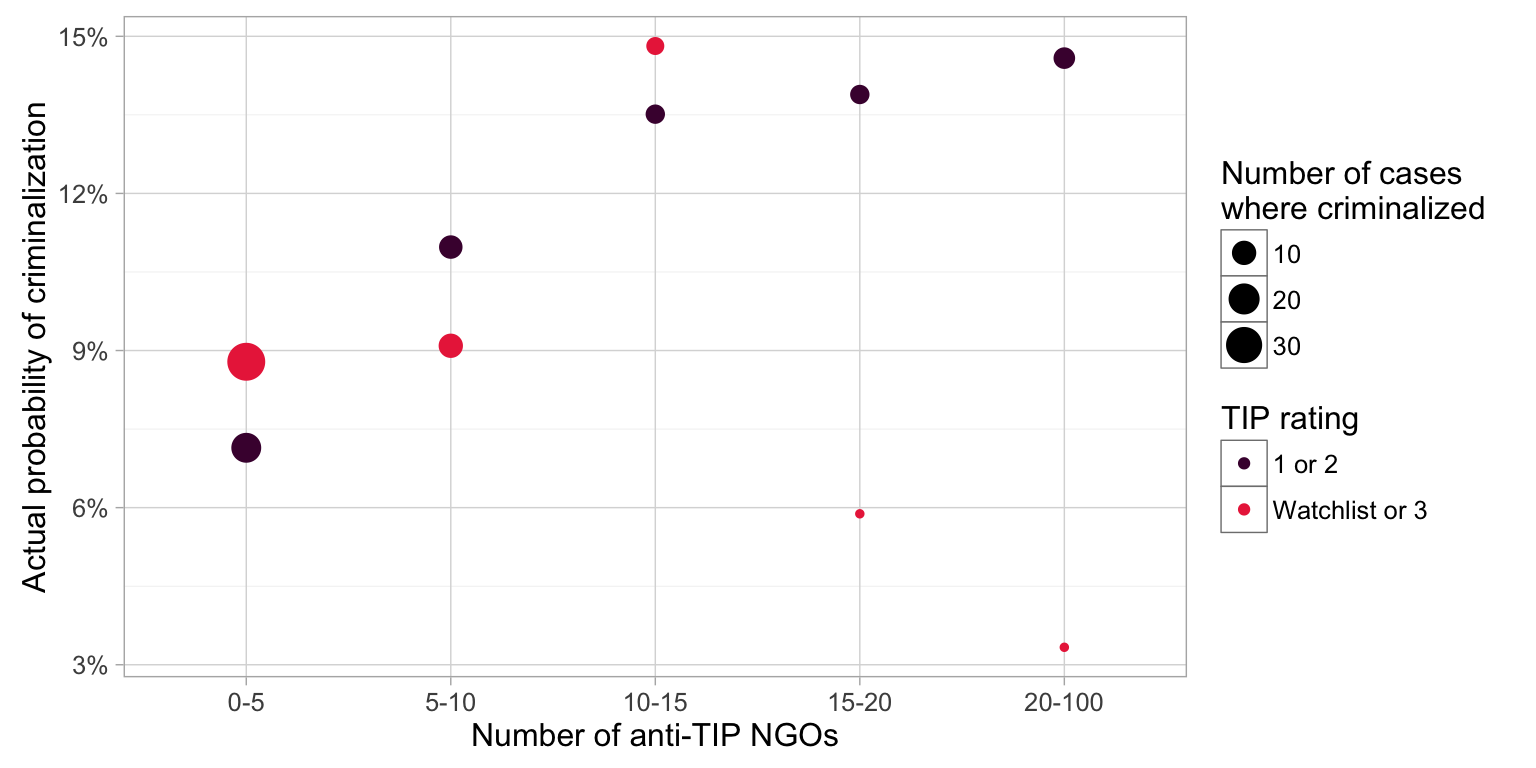
1.8.1 Descriptive
1.8.2 Interactions (models)
| Criminalization | ||
| (1) | (2) | |
| Number of anti-TIP NGOs | 1.015 | 1.015 |
| (0.010) | (0.119) | |
| Worse democracy (Freedom House civil liberties) | 0.874 | 0.874 |
| (0.073) | (0.073) | |
| In TIP report | 2.993** | 2.993* |
| (1.277) | (1.815) | |
| Share of women in parliament | 1.027** | 1.027** |
| (0.012) | (0.012) | |
| 2000 TIP protocol ratification | 1.693* | 1.693* |
| (0.479) | (0.479) | |
| Regional density of criminalization | 10.666*** | 10.667*** |
| (6.460) | (6.473) | |
| Missing info | 1.308*** | 1.308*** |
| (0.134) | (0.135) | |
| Anti-TIP NGOs × In TIP report | 1.000 | |
| (0.117) | ||
| Constant | 0.013*** | 0.013*** |
| (0.009) | (0.010) | |
| Year fixed effects | Yes | Yes |
| Pseudo R-squared | 0.1268 | 0.1268 |
| Observations | 835 | 835 |
| Log Likelihood | -243.678 | -243.678 |
| Note: | p<0.1; p<0.05; p<0.01 | |
| Log odds reported; standard errors in parentheses. All explanatory variables are lagged one period unless otherwise noted. | ||
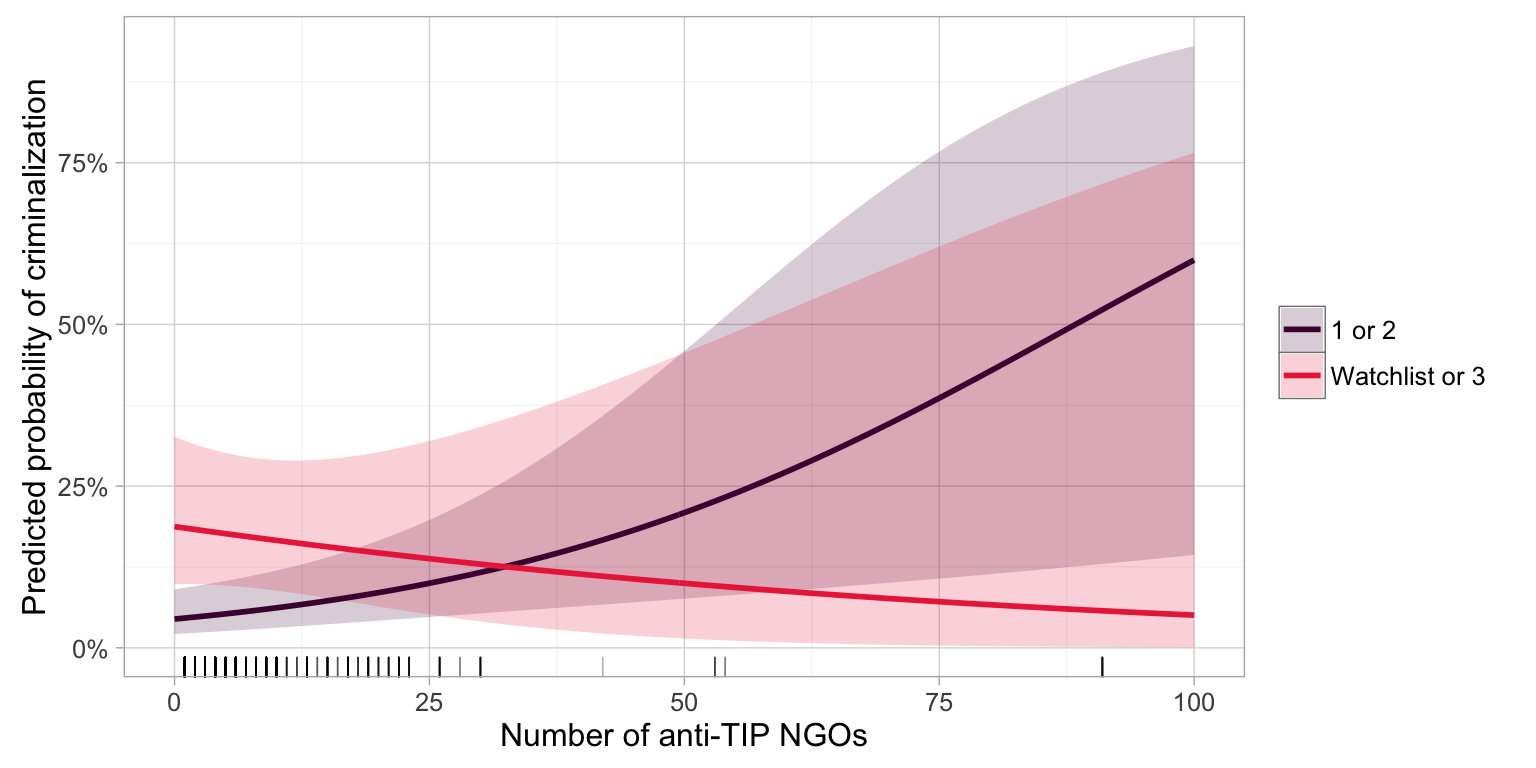
1.8.3 Interactions (visualized)
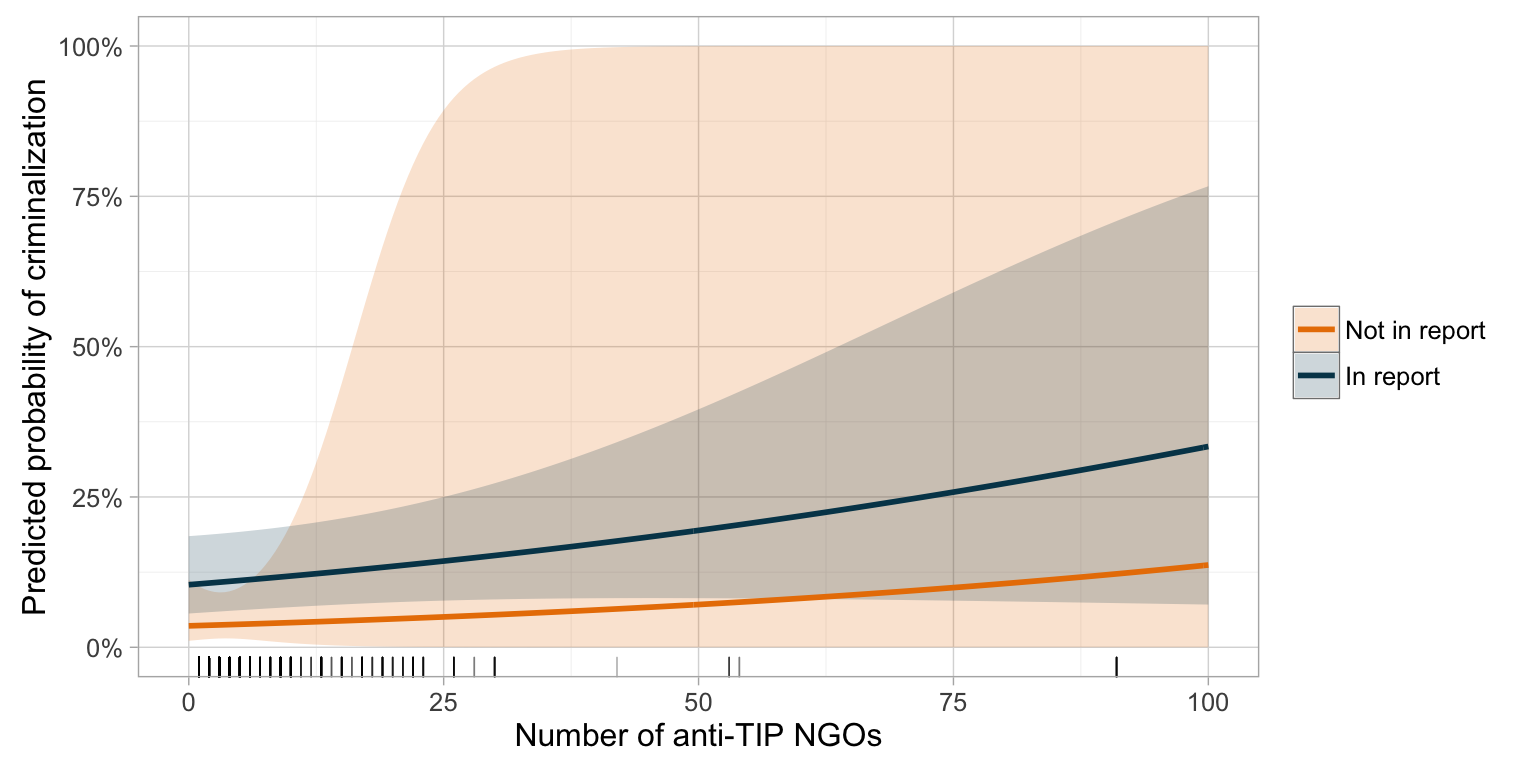
Note: All covariate values held at their mean or modal values; year held constant at 2005. Rug below indicates actual observed values.
1.9 TIP funding from US × presence in TIP report
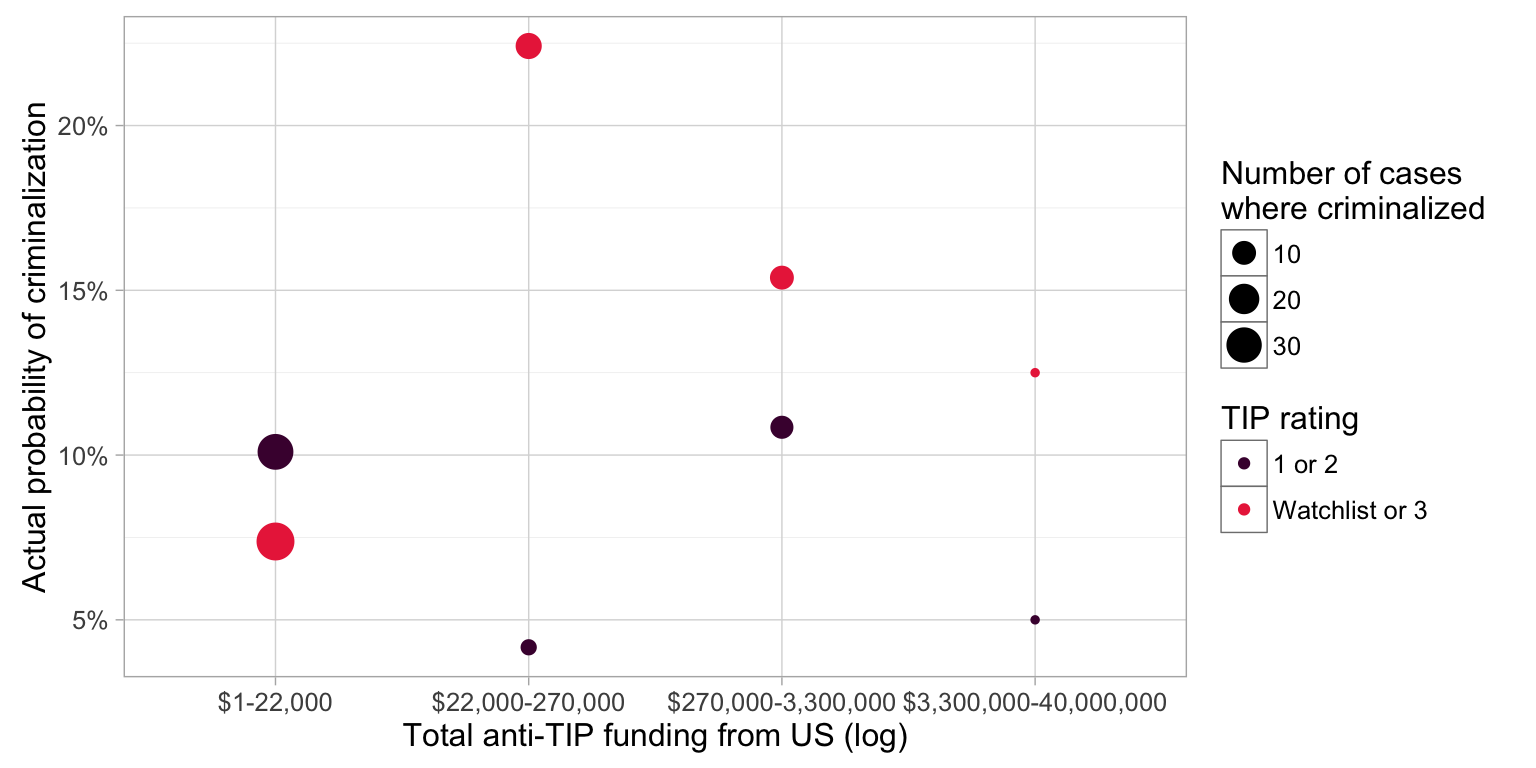
1.9.1 Descriptive
1.9.2 Interactions (models)
| Criminalization | ||
| (1) | (2) | |
| Total anti-TIP funding from US (log) | 1.034 | 0.223 |
| (0.022) | (16.629) | |
| Worse democracy (Freedom House civil liberties) | 0.801*** | 0.809*** |
| (0.060) | (0.061) | |
| In TIP report | 4.018*** | 3.599*** |
| (1.538) | (1.404) | |
| Share of women in parliament | 1.025** | 1.024** |
| (0.011) | (0.011) | |
| 2000 TIP protocol ratification | 1.775** | 1.785** |
| (0.455) | (0.459) | |
| Regional density of criminalization | 7.740*** | 8.223*** |
| (4.331) | (4.658) | |
| Missing info | 1.303*** | 1.303*** |
| (0.120) | (0.120) | |
| US funding × In TIP report | 4.657 | |
| (347.802) | ||
| Constant | 0.018*** | 0.019*** |
| (0.011) | (0.011) | |
| Year fixed effects | Yes | Yes |
| Pseudo R-squared | 0.1396 | 0.1423 |
| Observations | 1,027 | 1,027 |
| Log Likelihood | -276.332 | -275.441 |
| Note: | p<0.1; p<0.05; p<0.01 | |
| Log odds reported; standard errors in parentheses. All explanatory variables are lagged one period unless otherwise noted. | ||
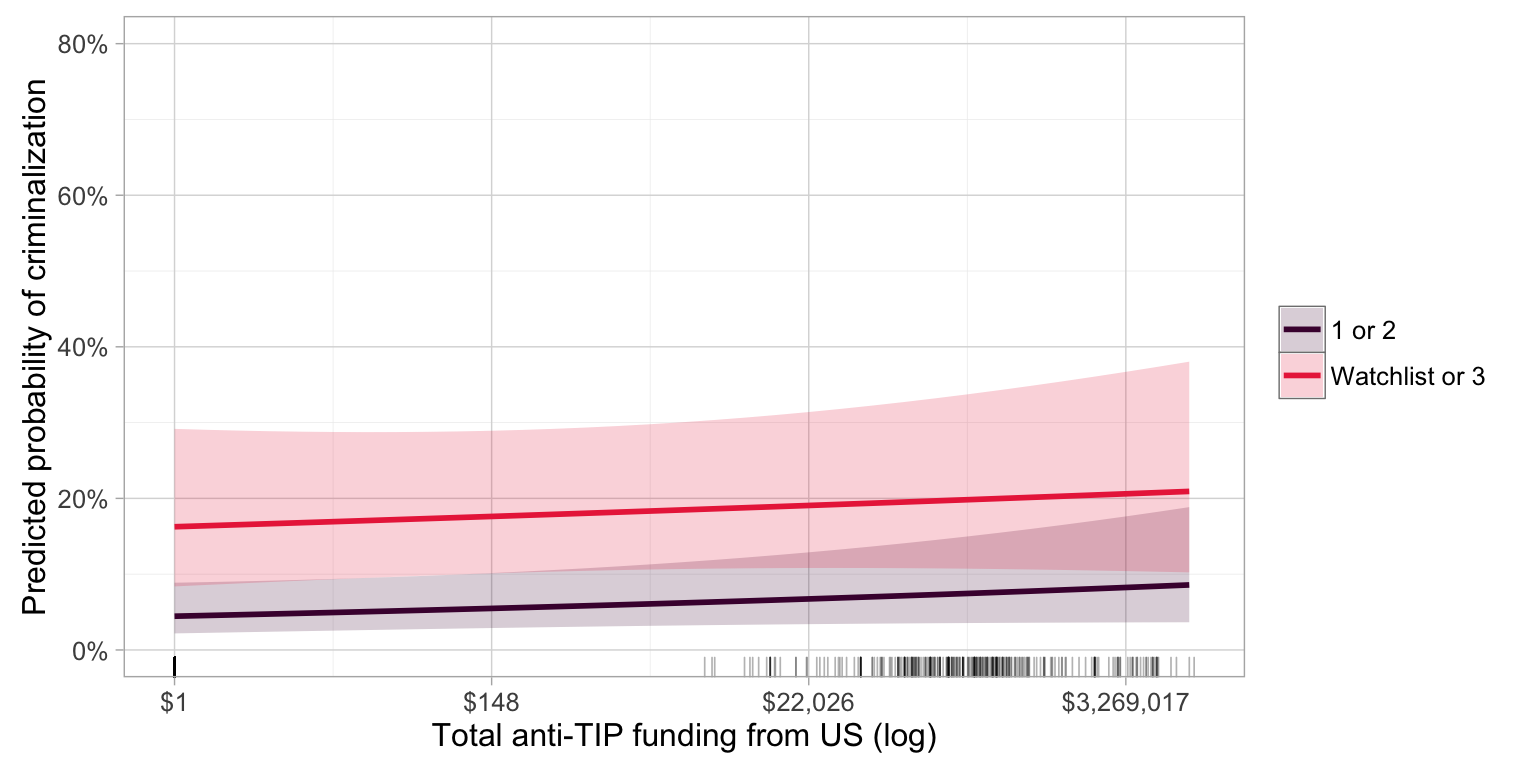
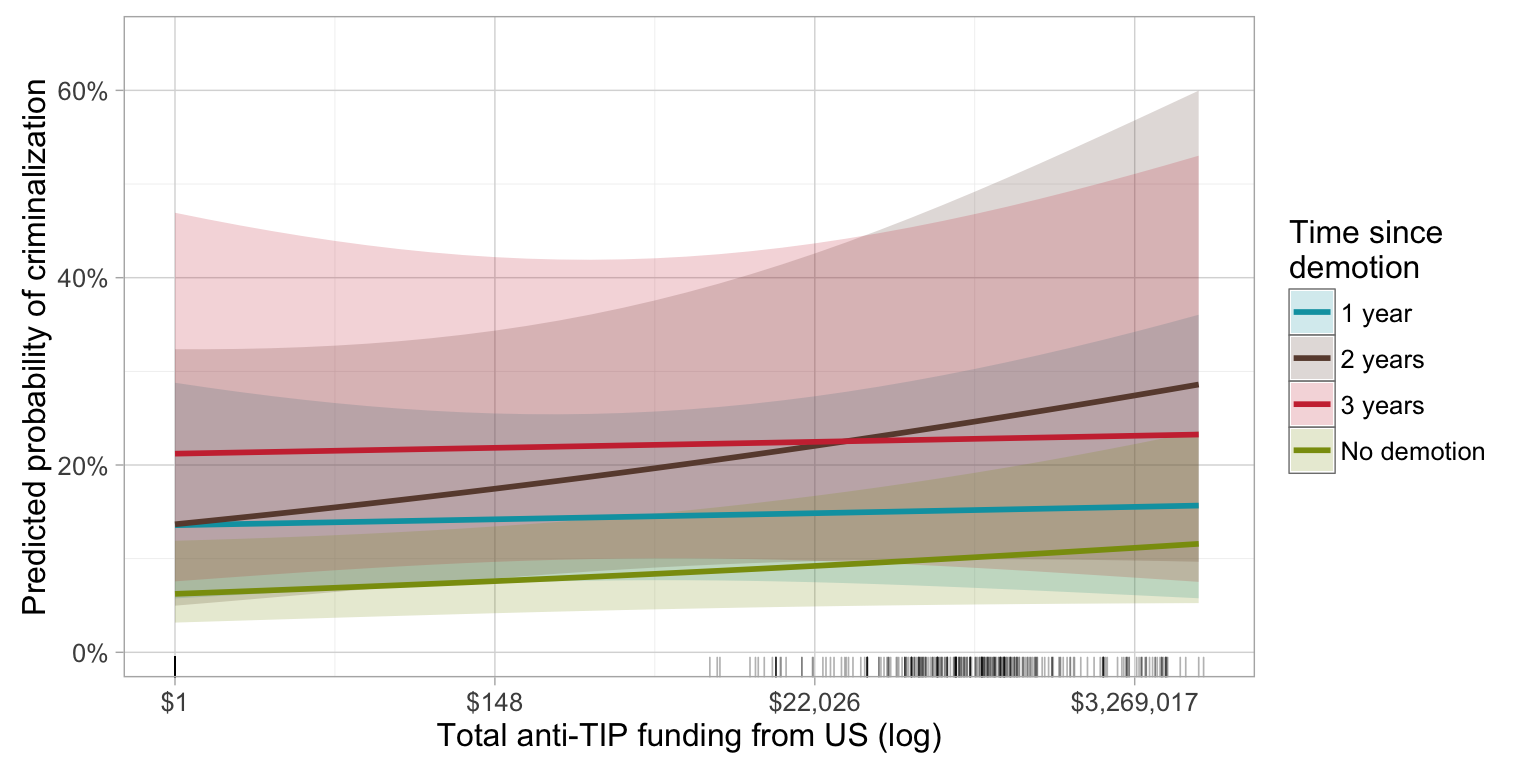
1.9.3 Interactions (visualized)
Note: All covariate values held at their mean or modal values; year held constant at 2005. Rug below indicates actual observed values.
1.10 Government stability × presence in TIP report
1.10.1 Descriptive
1.10.2 Interactions (models)
| Criminalization | ||
| (1) | (2) | |
| Government stability (ICRG) | 1.092 | 1.172 |
| (0.104) | (0.354) | |
| Worse democracy (Freedom House civil liberties) | 0.743*** | 0.746*** |
| (0.075) | (0.077) | |
| In TIP report | 3.633*** | 7.693 |
| (1.622) | (23.558) | |
| Share of women in parliament | 1.028** | 1.028** |
| (0.014) | (0.014) | |
| 2000 TIP protocol ratification | 2.033** | 2.025** |
| (0.621) | (0.619) | |
| Regional density of criminalization | 4.558** | 4.630** |
| (3.050) | (3.111) | |
| Missing info | 1.203 | 1.200 |
| (0.140) | (0.140) | |
| Government stability × In TIP report | 0.924 | |
| (0.294) | ||
| Constant | 0.014*** | 0.007* |
| (0.016) | (0.021) | |
| Year fixed effects | Yes | Yes |
| Pseudo R-squared | 0.1381 | 0.1382 |
| Observations | 822 | 822 |
| Log Likelihood | -220.305 | -220.273 |
| Note: | p<0.1; p<0.05; p<0.01 | |
| Log odds reported; standard errors in parentheses. All explanatory variables are lagged one period unless otherwise noted. | ||
1.10.3 Interactions (visualized)
Note: All covariate values held at their mean or modal values; year held constant at 2005. Rug below indicates actual observed values.
1.11 Conflict × presence in TIP report
1.11.1 Descriptive
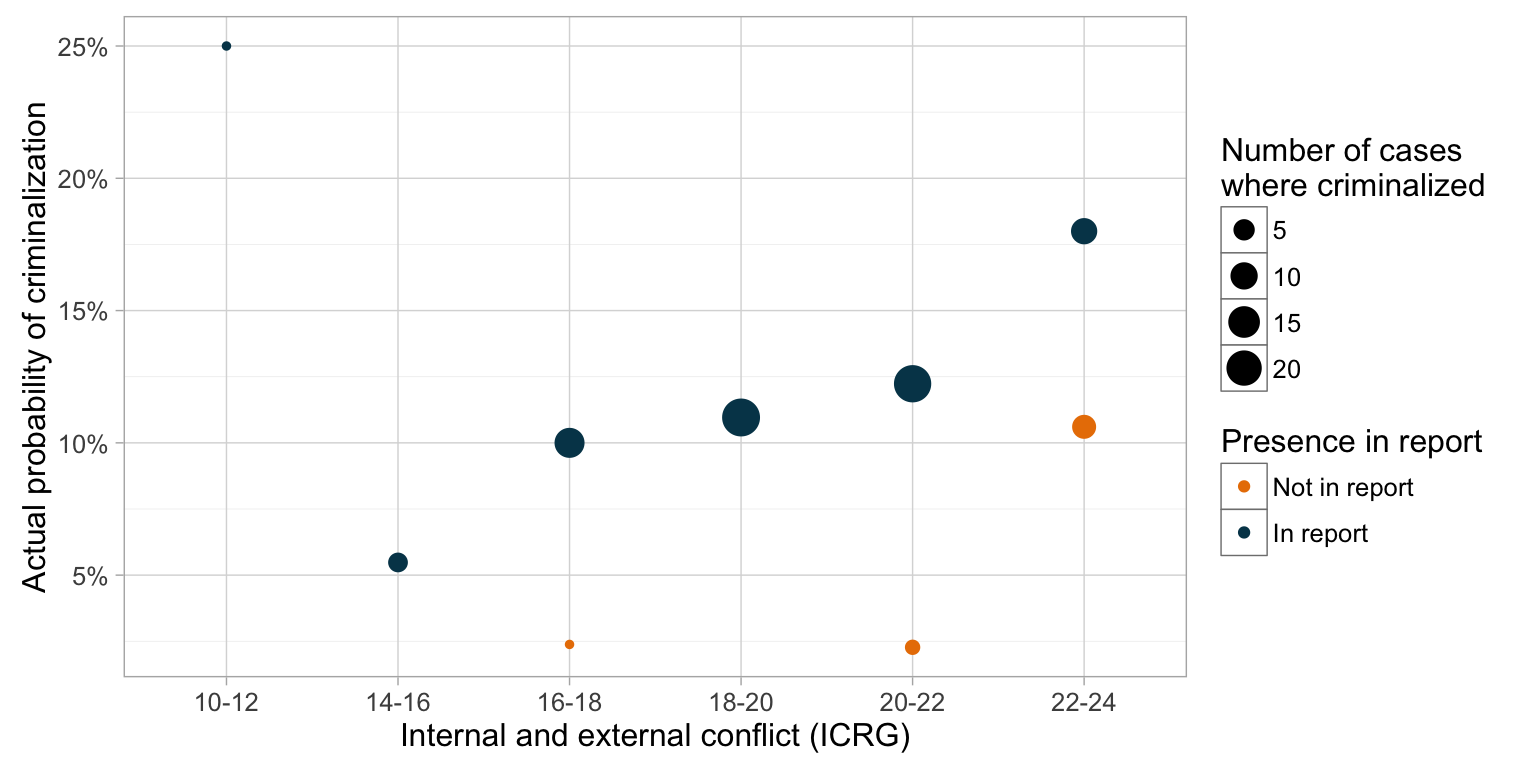
1.11.2 Interactions (models)
| Criminalization | ||
| (1) | (2) | |
| Internal and external conflict (ICRG) | 1.074 | 2.417** |
| (0.074) | (1.010) | |
| Worse democracy (Freedom House civil liberties) | 0.787** | 0.808** |
| (0.085) | (0.088) | |
| In TIP report | 3.548*** | 478,429,830.000** |
| (1.576) | (4,508,071,840.000) | |
| Share of women in parliament | 1.025* | 1.025* |
| (0.014) | (0.014) | |
| 2000 TIP protocol ratification | 1.979** | 2.101** |
| (0.598) | (0.641) | |
| Regional density of criminalization | 4.420** | 4.789** |
| (2.992) | (3.219) | |
| Missing info | 1.198 | 1.174 |
| (0.140) | (0.140) | |
| Internal and external conflict × In TIP report | 0.425** | |
| (0.178) | ||
| Constant | 0.007*** | 0.000** |
| (0.011) | (0.000) | |
| Year fixed effects | Yes | Yes |
| Pseudo R-squared | 0.1386 | 0.1544 |
| Observations | 822 | 822 |
| Log Likelihood | -220.187 | -216.133 |
| Note: | p<0.1; p<0.05; p<0.01 | |
| Log odds reported; standard errors in parentheses. All explanatory variables are lagged one period unless otherwise noted. | ||
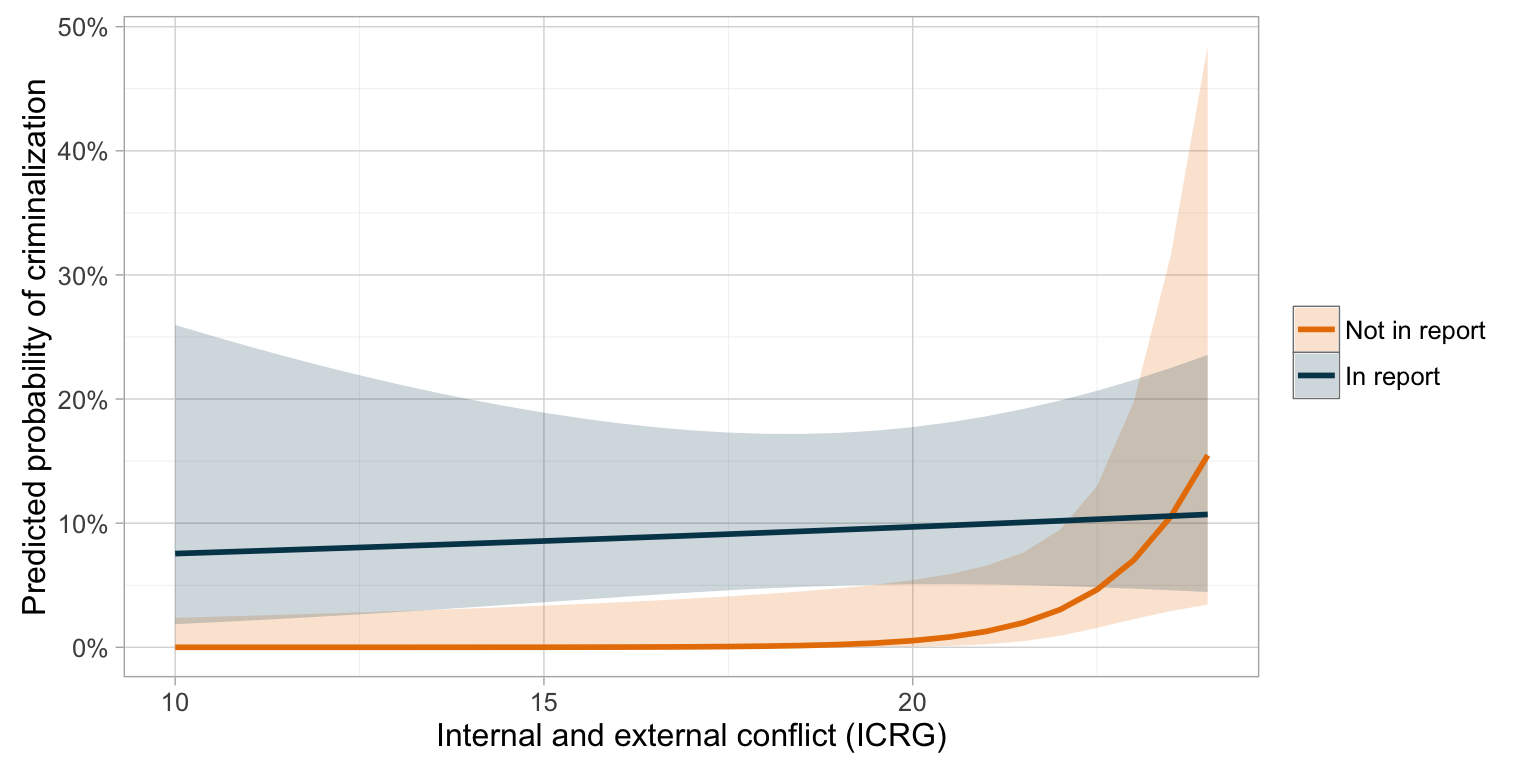
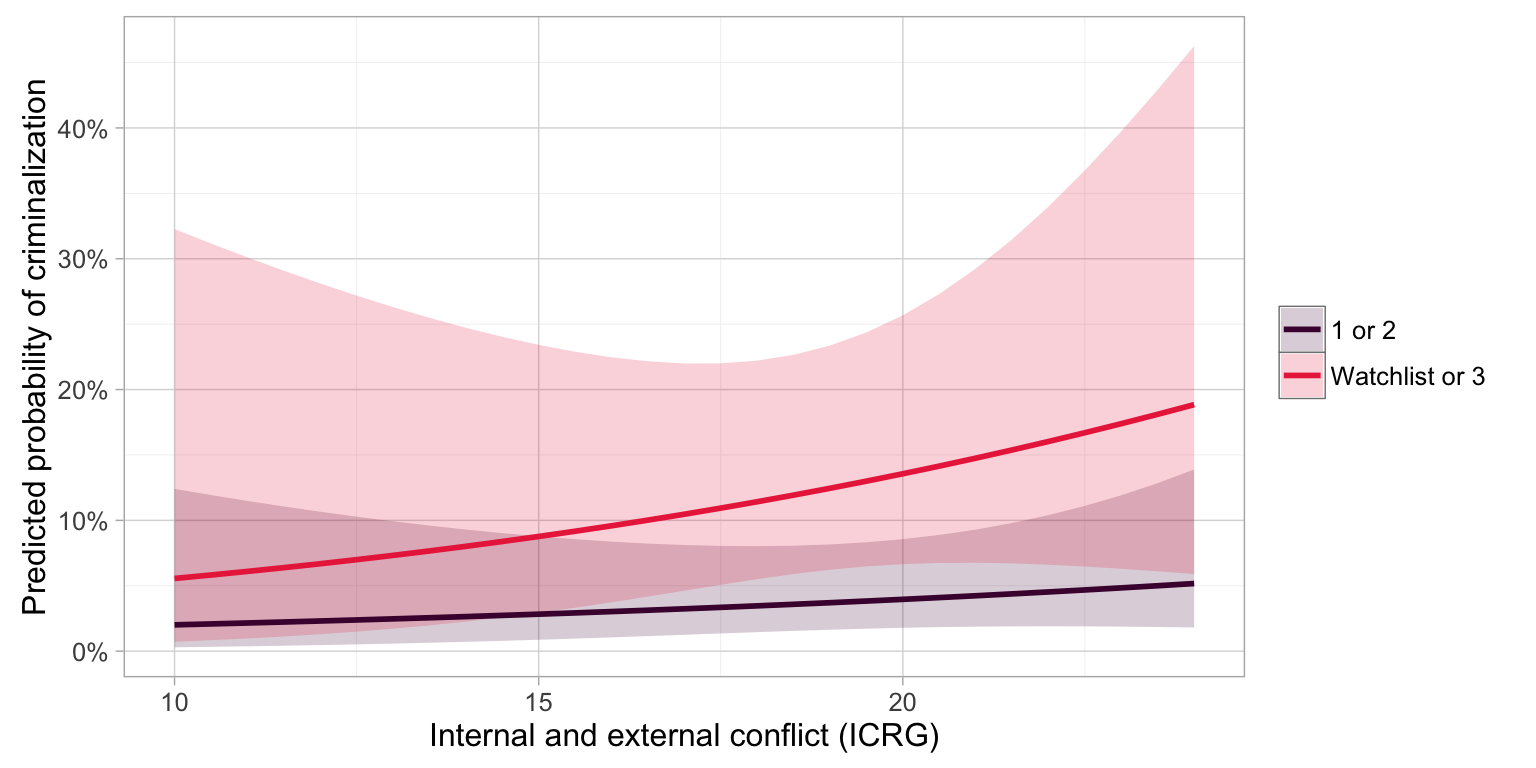
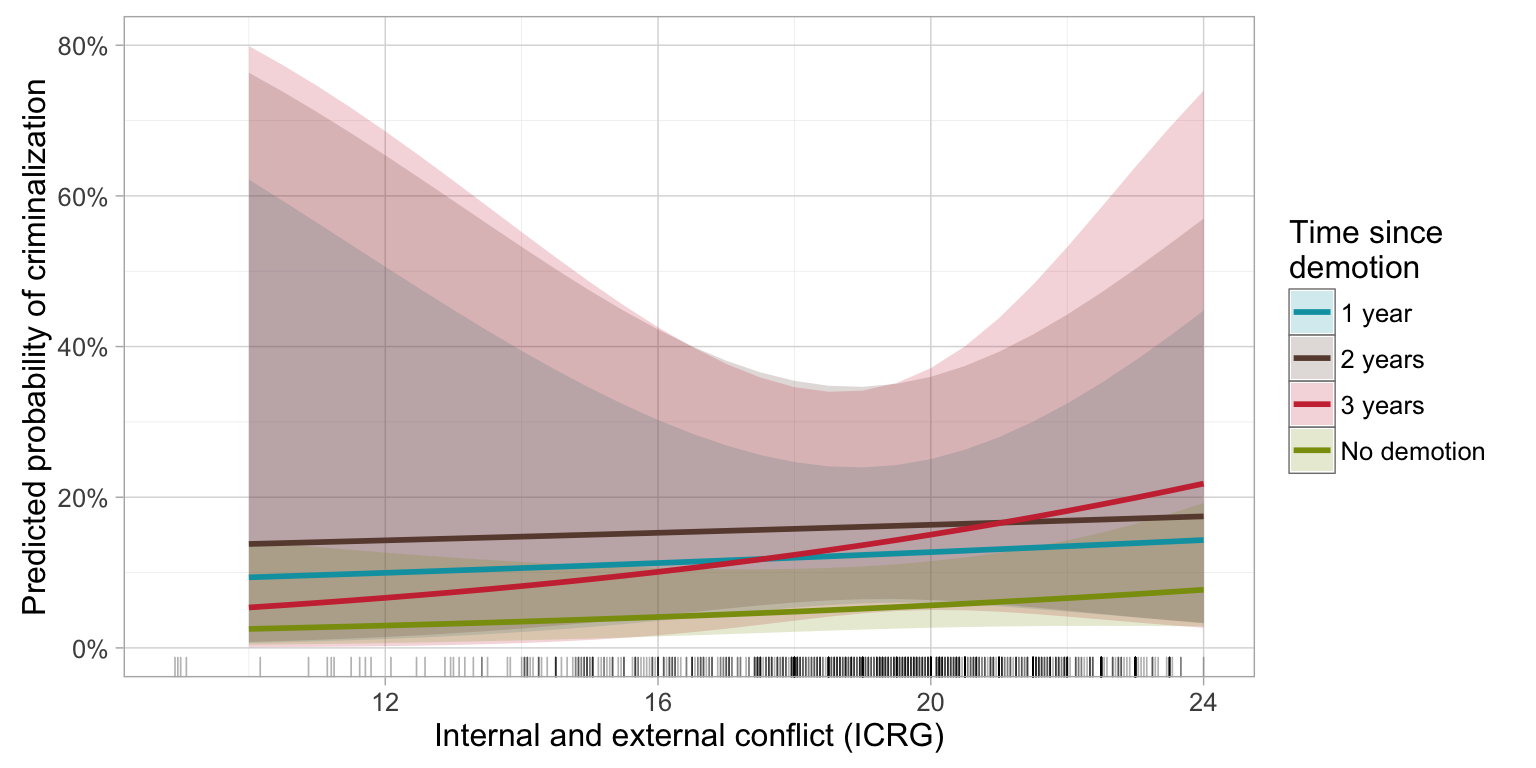
1.11.3 Interactions (visualized)
Note: All covariate values held at their mean or modal values; year held constant at 2005. Rug below indicates actual observed values.
1.12 GDP/capita × presence in TIP report
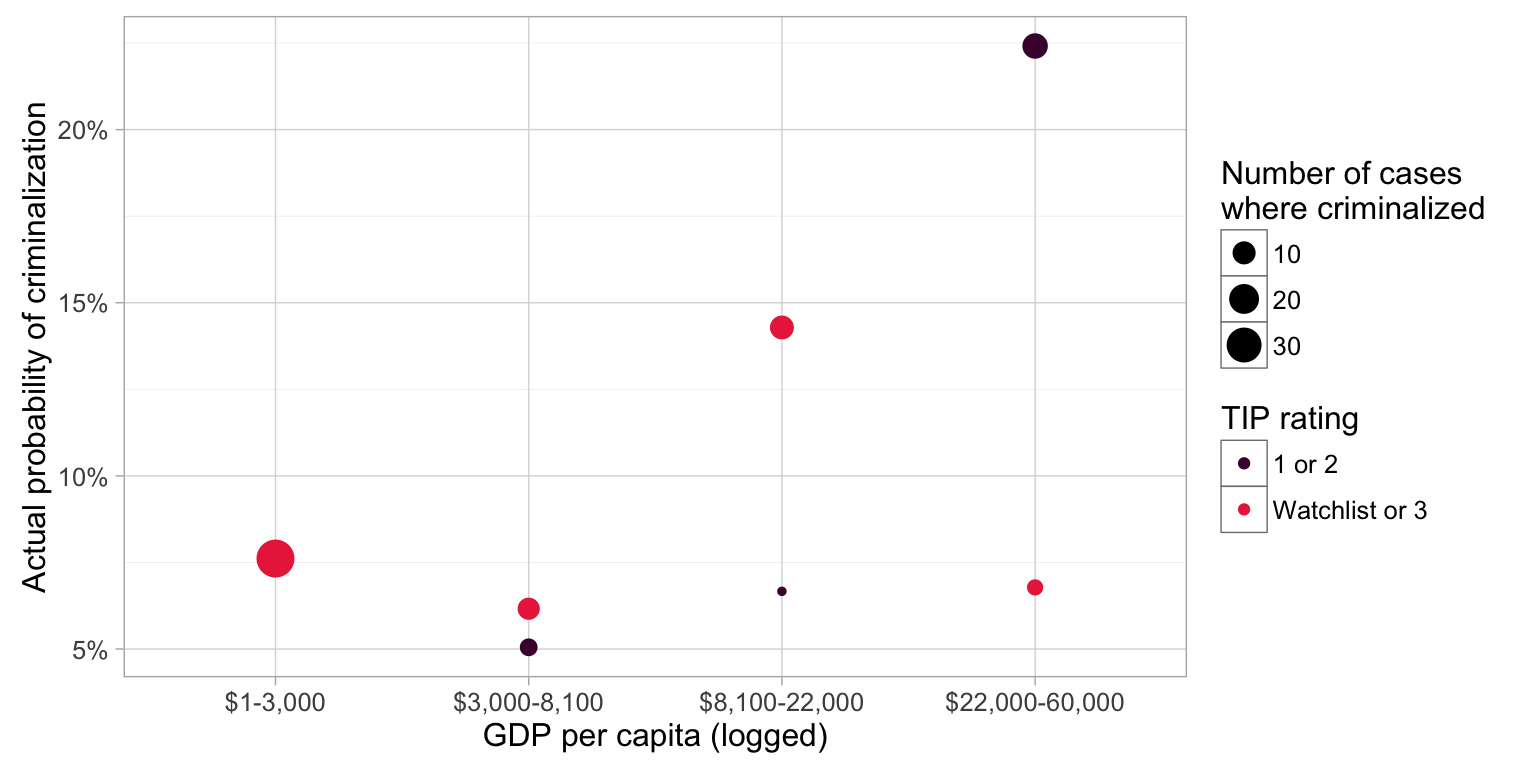
1.12.1 Descriptive
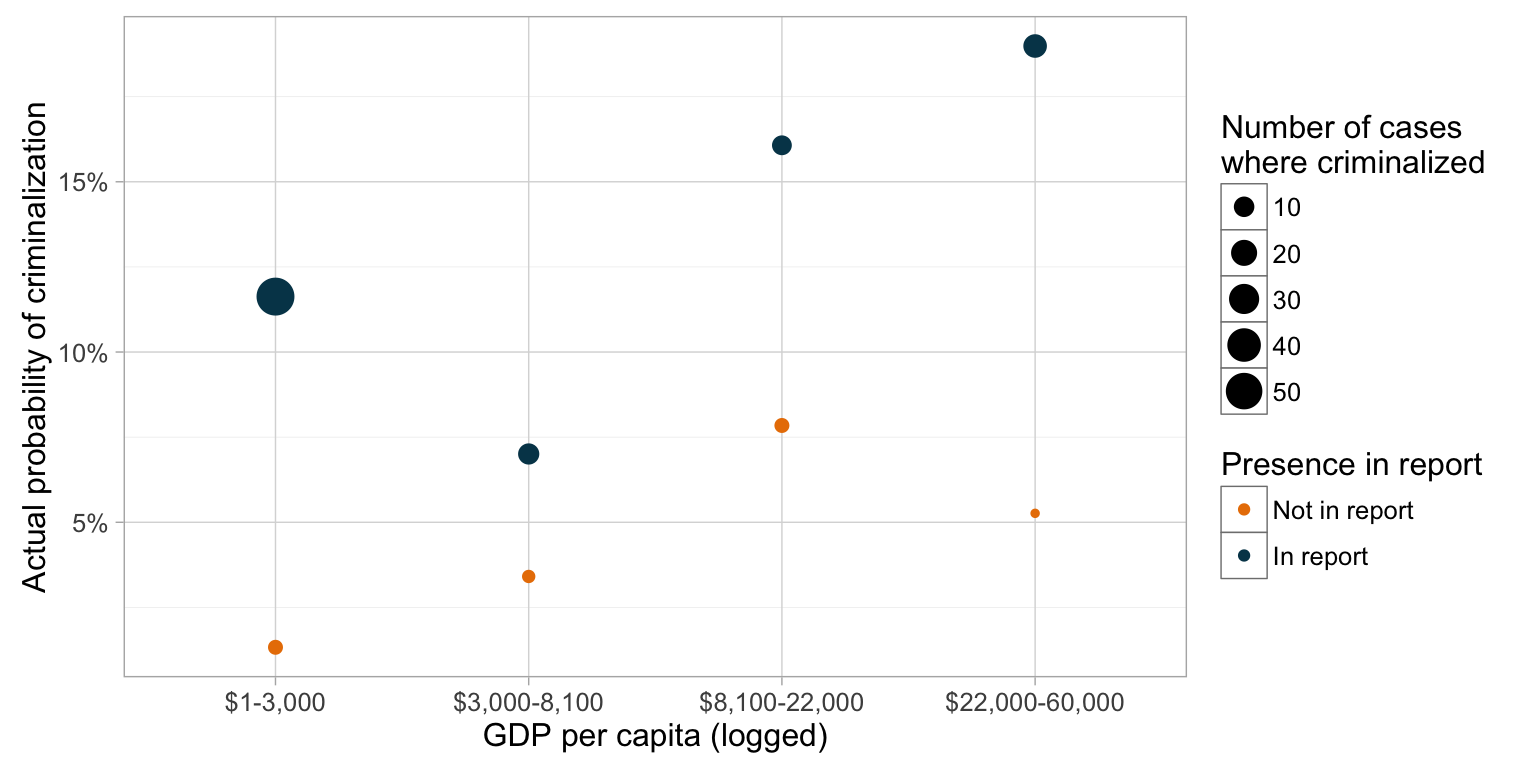
1.12.2 Interactions (models)
| Criminalization | ||
| (1) | (2) | |
| GDP per capita (logged) | 1.072 | 1.551* |
| (0.094) | (0.376) | |
| Worse democracy (Freedom House civil liberties) | 0.839** | 0.851* |
| (0.070) | (0.072) | |
| In TIP report | 4.000*** | 119.431** |
| (1.523) | (257.582) | |
| Share of women in parliament | 1.023** | 1.022** |
| (0.011) | (0.011) | |
| 2000 TIP protocol ratification | 1.899** | 1.929** |
| (0.500) | (0.508) | |
| Regional density of criminalization | 6.613*** | 6.856*** |
| (3.851) | (4.007) | |
| Missing info | 1.248** | 1.253** |
| (0.115) | (0.116) | |
| GDP per capita × In TIP report | 0.668* | |
| (0.163) | ||
| Constant | 0.010*** | 0.0004*** |
| (0.010) | (0.001) | |
| Year fixed effects | Yes | Yes |
| Pseudo R-squared | 0.1356 | 0.1403 |
| Observations | 1,021 | 1,021 |
| Log Likelihood | -273.171 | -271.684 |
| Note: | p<0.1; p<0.05; p<0.01 | |
| Log odds reported; standard errors in parentheses. All explanatory variables are lagged one period unless otherwise noted. | ||
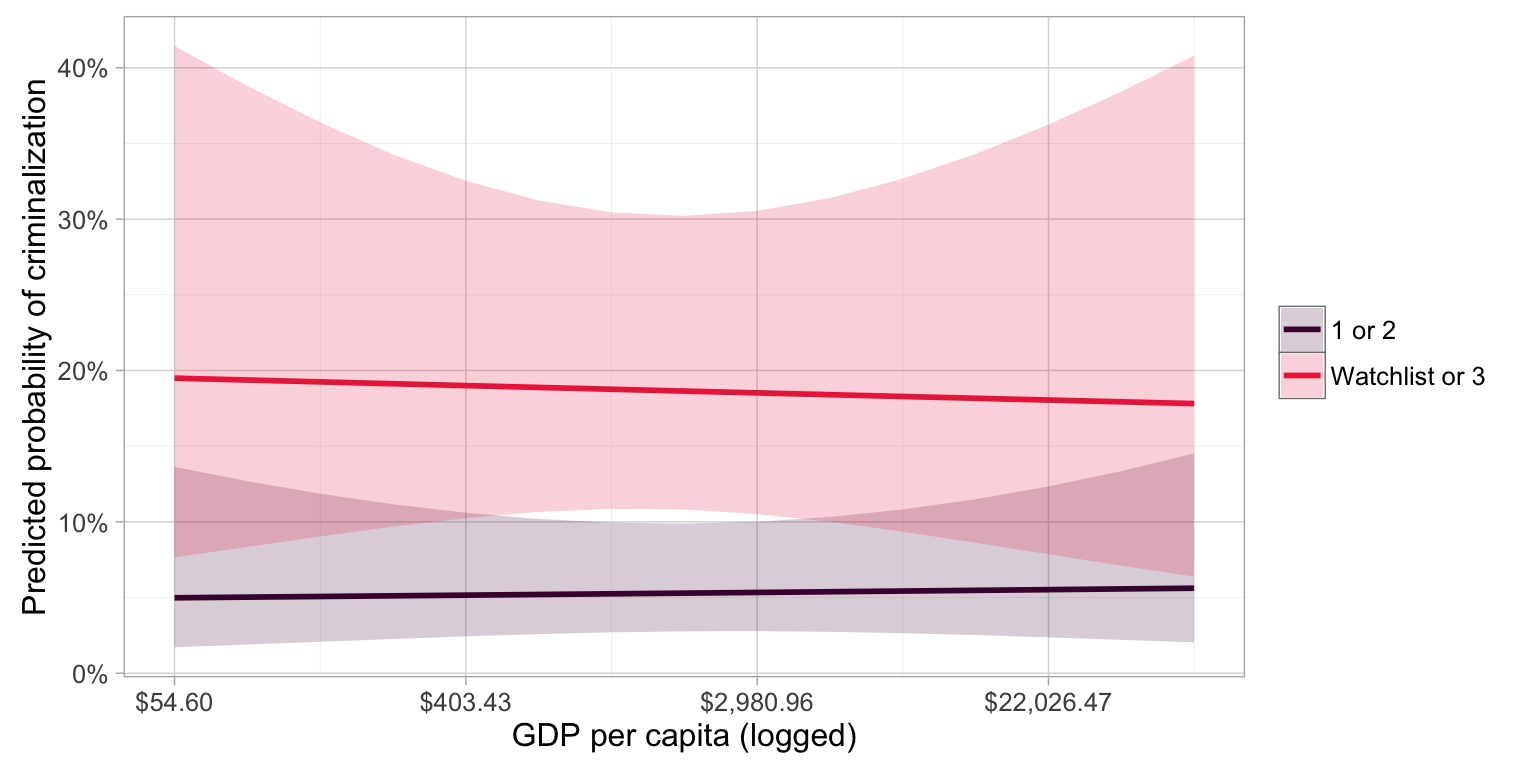
1.12.3 Interactions (visualized)
Note: All covariate values held at their mean or modal values; year held constant at 2005. Rug below indicates actual observed values.

2 Lower tier ratings
2.1 Democracy × lower tier ratings
2.1.1 Descriptive
2.1.2 Interactions (models)
| Criminalization | ||
| (1) | (2) | |
| Worse democracy (Freedom House civil liberties) | 0.752*** | 0.735*** |
| (0.058) | (0.075) | |
| Lowest tier | 4.625*** | 3.827** |
| (1.270) | (2.285) | |
| Share of women in parliament | 1.032*** | 1.032*** |
| (0.011) | (0.011) | |
| 2000 TIP protocol ratification | 1.851** | 1.877** |
| (0.480) | (0.492) | |
| Regional density of criminalization | 10.653*** | 10.298*** |
| (6.040) | (5.918) | |
| Missing info | 1.122 | 1.120 |
| (0.094) | (0.094) | |
| Worse democracy × Lowest tier | 1.056 | |
| (0.161) | ||
| Constant | 0.046*** | 0.049*** |
| (0.024) | (0.027) | |
| Year fixed effects | Yes | Yes |
| Pseudo R-squared | 0.1589 | 0.1591 |
| Observations | 1,031 | 1,031 |
| Log Likelihood | -270.445 | -270.382 |
| Note: | p<0.1; p<0.05; p<0.01 | |
| Log odds reported; standard errors in parentheses. All explanatory variables are lagged one period unless otherwise noted. | ||
2.1.3 Interactions (visualized)
Note: All covariate values held at their mean or modal values; year held constant at 2005. Rug below indicates actual observed values.
2.2 NGO engagement × lower tier ratings
2.2.1 Descriptive
2.2.2 Interactions (models)
| Criminalization | ||
| (1) | (2) | |
| NGO engagement | 1.057 | 1.167 |
| (0.089) | (0.135) | |
| Worse democracy (Freedom House civil liberties) | 0.761*** | 0.758*** |
| (0.060) | (0.060) | |
| Lowest tier | 4.472*** | 8.064*** |
| (1.240) | (4.530) | |
| Share of women in parliament | 1.033*** | 1.033*** |
| (0.012) | (0.012) | |
| 2000 TIP protocol ratification | 1.887** | 1.905** |
| (0.494) | (0.500) | |
| Regional density of criminalization | 9.760*** | 9.372*** |
| (5.666) | (5.505) | |
| Missing info | 1.132 | 1.131 |
| (0.097) | (0.097) | |
| NGO engagement × Lowest tier | 0.828 | |
| (0.129) | ||
| Constant | 0.037*** | 0.027*** |
| (0.023) | (0.018) | |
| Year fixed effects | Yes | Yes |
| Pseudo R-squared | 0.1578 | 0.1601 |
| Observations | 1,022 | 1,022 |
| Log Likelihood | -270.056 | -269.318 |
| Note: | p<0.1; p<0.05; p<0.01 | |
| Log odds reported; standard errors in parentheses. All explanatory variables are lagged one period unless otherwise noted. | ||
2.2.3 Interactions (visualized)
Note: All covariate values held at their mean or modal values; year held constant at 2005. Rug below indicates actual observed values.
2.3 Media coverage × lower tier ratings
2.3.1 Descriptive
2.3.2 Interactions (models)
| Criminalization | ||
| (1) | (2) | |
| Media coverage | 1.002 | 1.005*** |
| (0.001) | (0.002) | |
| Worse democracy (Freedom House civil liberties) | 0.743*** | 0.735*** |
| (0.057) | (0.057) | |
| Lowest tier | 4.346*** | 6.623*** |
| (1.209) | (2.220) | |
| Share of women in parliament | 1.031*** | 1.032*** |
| (0.011) | (0.011) | |
| 2000 TIP protocol ratification | 2.075*** | 2.232*** |
| (0.563) | (0.614) | |
| Regional density of criminalization | 10.276*** | 9.251*** |
| (5.827) | (5.292) | |
| Missing info | 1.184* | 1.219** |
| (0.108) | (0.114) | |
| Media coverage × Lowest tier | 0.995** | |
| (0.002) | ||
| Constant | 0.040*** | 0.033*** |
| (0.021) | (0.018) | |
| Year fixed effects | Yes | Yes |
| Pseudo R-squared | 0.1622 | 0.1707 |
| Observations | 1,031 | 1,031 |
| Log Likelihood | -269.387 | -266.657 |
| Note: | p<0.1; p<0.05; p<0.01 | |
| Log odds reported; standard errors in parentheses. All explanatory variables are lagged one period unless otherwise noted. | ||
2.3.3 Interactions (visualized)
Note: All covariate values held at their mean or modal values; year held constant at 2005. Rug below indicates actual observed values.
2.4 US foreign aid × lower tier ratings
2.4.1 Descriptive
2.4.2 Interactions (models)
| Criminalization | ||
| (1) | (2) | |
| US aid (logged) | 0.974 | 0.967 |
| (0.022) | (0.023) | |
| Worse democracy (Freedom House civil liberties) | 0.778*** | 0.782*** |
| (0.064) | (0.064) | |
| Lowest tier | 4.702*** | 2.196 |
| (1.298) | (2.269) | |
| Share of women in parliament | 1.031*** | 1.029** |
| (0.012) | (0.012) | |
| 2000 TIP protocol ratification | 2.026*** | 2.084*** |
| (0.551) | (0.573) | |
| Regional density of criminalization | 9.449*** | 9.283*** |
| (5.447) | (5.345) | |
| Missing info | 1.092 | 1.100 |
| (0.096) | (0.097) | |
| US aid × Lowest tier | 1.048 | |
| (0.064) | ||
| Constant | 0.062*** | 0.068*** |
| (0.036) | (0.040) | |
| Year fixed effects | Yes | Yes |
| Pseudo R-squared | 0.161 | 0.162 |
| Observations | 1,031 | 1,031 |
| Log Likelihood | -269.778 | -269.458 |
| Note: | p<0.1; p<0.05; p<0.01 | |
| Log odds reported; standard errors in parentheses. All explanatory variables are lagged one period unless otherwise noted. | ||
2.4.3 Interactions (visualized)
Note: All covariate values held at their mean or modal values; year held constant at 2005. Rug below indicates actual observed values.
2.5 US trade × lower tier ratings
2.5.1 Descriptive
2.5.2 Interactions (models)
| Criminalization | ||
| (1) | (2) | |
| Share of US trade (part of GDP) | 0.861 | 0.297 |
| (0.988) | (0.471) | |
| Worse democracy (Freedom House civil liberties) | 0.790*** | 0.792*** |
| (0.063) | (0.063) | |
| Lowest tier | 4.594*** | 3.643*** |
| (1.285) | (1.275) | |
| Share of women in parliament | 1.037*** | 1.036*** |
| (0.012) | (0.012) | |
| 2000 TIP protocol ratification | 1.827** | 1.801** |
| (0.493) | (0.488) | |
| Regional density of criminalization | 11.163*** | 11.013*** |
| (6.645) | (6.542) | |
| Missing info | 1.070 | 1.083 |
| (0.095) | (0.097) | |
| Trade share × Lowest tier | 12.876 | |
| (30.145) | ||
| Constant | 0.044*** | 0.048*** |
| (0.024) | (0.026) | |
| Year fixed effects | Yes | Yes |
| Pseudo R-squared | 0.1568 | 0.1588 |
| Observations | 940 | 940 |
| Log Likelihood | -255.811 | -255.208 |
| Note: | p<0.1; p<0.05; p<0.01 | |
| Log odds reported; standard errors in parentheses. All explanatory variables are lagged one period unless otherwise noted. | ||
2.5.3 Interactions (visualized)
Note: All covariate values held at their mean or modal values; year held constant at 2005. Rug below indicates actual observed values.
2.6 Protocol ratified × lower tier ratings
2.6.1 Descriptive
2.6.2 Interactions (models)
| Criminalization | ||
| (1) | (2) | |
| Worse democracy (Freedom House civil liberties) | 0.752*** | 0.761*** |
| (0.058) | (0.059) | |
| Lowest tier | 4.625*** | 3.496*** |
| (1.270) | (1.357) | |
| Share of women in parliament | 1.032*** | 1.032*** |
| (0.011) | (0.012) | |
| 2000 TIP protocol ratification | 1.851** | 1.475 |
| (0.480) | (0.503) | |
| Regional density of criminalization | 10.653*** | 10.898*** |
| (6.040) | (6.226) | |
| Missing info | 1.122 | 1.113 |
| (0.094) | (0.094) | |
| Protocol ratification × Lowest tier | 1.654 | |
| (0.806) | ||
| Constant | 0.046*** | 0.048*** |
| (0.024) | (0.025) | |
| Year fixed effects | Yes | Yes |
| Pseudo R-squared | 0.1589 | 0.1606 |
| Observations | 1,031 | 1,031 |
| Log Likelihood | -270.445 | -269.905 |
| Note: | p<0.1; p<0.05; p<0.01 | |
| Log odds reported; standard errors in parentheses. All explanatory variables are lagged one period unless otherwise noted. | ||
2.6.3 Interactions (visualized)
Note: All covariate values held at their mean or modal values; year held constant at 2005.
2.7 Wikileaks engagement/intensity × lower tier ratings
2.7.1 Descriptive
2.7.2 Interactions (models)
| Criminalization | ||
| (1) | (2) | |
| Proportion of TIP-related cables (observed in Wikileaks) | 7.107 | 0.936 |
| (11.190) | (2.425) | |
| Worse democracy (Freedom House civil liberties) | 0.690*** | 0.693*** |
| (0.073) | (0.075) | |
| Lowest tier | 5.677*** | 3.489*** |
| (1.981) | (1.486) | |
| Share of women in parliament | 1.033** | 1.035** |
| (0.014) | (0.014) | |
| 2000 TIP protocol ratification | 1.520 | 1.521 |
| (0.496) | (0.500) | |
| Regional density of criminalization | 6.015*** | 5.614** |
| (4.032) | (3.808) | |
| Missing info | 1.267** | 1.258** |
| (0.147) | (0.147) | |
| TIP cables × Lowest tier | 10,367.930** | |
| (48,234.860) | ||
| Constant | 0.022*** | 0.028*** |
| (0.025) | (0.032) | |
| Year fixed effects | Yes | Yes |
| Pseudo R-squared | 0.1814 | 0.1928 |
| Observations | 563 | 563 |
| Log Likelihood | -158.107 | -155.908 |
| Note: | p<0.1; p<0.05; p<0.01 | |
| Log odds reported; standard errors in parentheses. All explanatory variables are lagged one period unless otherwise noted. | ||
2.7.3 Interactions (visualized)
Note: All covariate values held at their mean or modal values; year held constant at 2005. Rug below indicates actual observed values.
2.8 TIP NGO count × lower tier ratings
2.8.1 Descriptive
2.8.2 Interactions (models)
| Criminalization | ||
| (1) | (2) | |
| Number of anti-TIP NGOs | 1.014 | 1.035*** |
| (0.010) | (0.012) | |
| Worse democracy (Freedom House civil liberties) | 0.824** | 0.807** |
| (0.071) | (0.071) | |
| Lowest tier | 4.001*** | 5.938*** |
| (1.184) | (2.046) | |
| Share of women in parliament | 1.037*** | 1.037*** |
| (0.012) | (0.012) | |
| 2000 TIP protocol ratification | 1.680* | 1.644* |
| (0.483) | (0.467) | |
| Regional density of criminalization | 15.345*** | 12.944*** |
| (9.423) | (8.029) | |
| Missing info | 1.221** | 1.216* |
| (0.122) | (0.123) | |
| Anti-TIP NGOs × Lowest tier | 0.952** | |
| (0.023) | ||
| Constant | 0.024*** | 0.021*** |
| (0.015) | (0.013) | |
| Year fixed effects | Yes | Yes |
| Pseudo R-squared | 0.1532 | 0.1643 |
| Observations | 835 | 835 |
| Log Likelihood | -236.298 | -233.218 |
| Note: | p<0.1; p<0.05; p<0.01 | |
| Log odds reported; standard errors in parentheses. All explanatory variables are lagged one period unless otherwise noted. | ||
2.8.3 Interactions (visualized)
Note: All covariate values held at their mean or modal values; year held constant at 2005. Rug below indicates actual observed values.
2.9 TIP funding from US × lower tier ratings
2.9.1 Descriptive
2.9.2 Interactions (models)
| Criminalization | ||
| (1) | (2) | |
| Total anti-TIP funding from US (log) | 1.032 | 1.045 |
| (0.023) | (0.031) | |
| Worse democracy (Freedom House civil liberties) | 0.746*** | 0.738*** |
| (0.057) | (0.058) | |
| Lowest tier | 4.436*** | 5.117*** |
| (1.224) | (1.868) | |
| Share of women in parliament | 1.032*** | 1.033*** |
| (0.012) | (0.012) | |
| 2000 TIP protocol ratification | 1.812** | 1.821** |
| (0.471) | (0.474) | |
| Regional density of criminalization | 10.764*** | 10.905*** |
| (6.104) | (6.191) | |
| Missing info | 1.155* | 1.161* |
| (0.100) | (0.101) | |
| US funding × Lowest tier | 0.976 | |
| (0.040) | ||
| Constant | 0.045*** | 0.044*** |
| (0.024) | (0.023) | |
| Year fixed effects | Yes | Yes |
| Pseudo R-squared | 0.1622 | 0.1628 |
| Observations | 1,027 | 1,027 |
| Log Likelihood | -269.063 | -268.885 |
| Note: | p<0.1; p<0.05; p<0.01 | |
| Log odds reported; standard errors in parentheses. All explanatory variables are lagged one period unless otherwise noted. | ||
2.9.3 Interactions (visualized)
Note: All covariate values held at their mean or modal values; year held constant at 2005. Rug below indicates actual observed values.
2.10 Government stability × lowest tier ratings
2.10.1 Descriptive
2.10.2 Interactions (models)
| Criminalization | ||
| (1) | (2) | |
| Government stability (ICRG) | 1.096 | 1.224 |
| (0.107) | (0.162) | |
| Worse democracy (Freedom House civil liberties) | 0.669*** | 0.686*** |
| (0.072) | (0.074) | |
| Lowest tier | 5.218*** | 46.848** |
| (1.685) | (80.807) | |
| Share of women in parliament | 1.031** | 1.031** |
| (0.014) | (0.014) | |
| 2000 TIP protocol ratification | 1.898** | 1.944** |
| (0.588) | (0.606) | |
| Regional density of criminalization | 7.808*** | 8.781*** |
| (5.286) | (5.993) | |
| Missing info | 1.049 | 1.032 |
| (0.115) | (0.113) | |
| Government stability × Lowest tier | 0.777 | |
| (0.151) | ||
| Constant | 0.036*** | 0.012*** |
| (0.038) | (0.017) | |
| Year fixed effects | Yes | Yes |
| Pseudo R-squared | 0.1725 | 0.1759 |
| Observations | 822 | 822 |
| Log Likelihood | -211.510 | -210.654 |
| Note: | p<0.1; p<0.05; p<0.01 | |
| Log odds reported; standard errors in parentheses. All explanatory variables are lagged one period unless otherwise noted. | ||
2.10.3 Interactions (visualized)
Note: All covariate values held at their mean or modal values; year held constant at 2005. Rug below indicates actual observed values.
2.11 Conflict × lowest tier ratings
2.11.1 Descriptive
2.11.2 Interactions (models)
| Criminalization | ||
| (1) | (2) | |
| Internal and external conflict (ICRG) | 1.084 | 1.072 |
| (0.078) | (0.096) | |
| Worse democracy (Freedom House civil liberties) | 0.711*** | 0.710*** |
| (0.081) | (0.081) | |
| Lowest tier | 5.211*** | 3.000 |
| (1.685) | (7.997) | |
| Share of women in parliament | 1.028** | 1.028** |
| (0.014) | (0.014) | |
| 2000 TIP protocol ratification | 1.863** | 1.846** |
| (0.573) | (0.573) | |
| Regional density of criminalization | 7.519*** | 7.623*** |
| (5.140) | (5.241) | |
| Missing info | 1.049 | 1.051 |
| (0.114) | (0.115) | |
| Internal and external conflict × Lowest tier | 1.029 | |
| (0.140) | ||
| Constant | 0.015*** | 0.019** |
| (0.024) | (0.037) | |
| Year fixed effects | Yes | Yes |
| Pseudo R-squared | 0.1733 | 0.1734 |
| Observations | 822 | 822 |
| Log Likelihood | -211.310 | -211.288 |
| Note: | p<0.1; p<0.05; p<0.01 | |
| Log odds reported; standard errors in parentheses. All explanatory variables are lagged one period unless otherwise noted. | ||
2.11.3 Interactions (visualized)
Note: All covariate values held at their mean or modal values; year held constant at 2005. Rug below indicates actual observed values.
2.12 GDP/capita × lowest tier ratings
2.12.1 Descriptive
2.12.2 Interactions (models)
| Criminalization | ||
| (1) | (2) | |
| GDP per capita (logged) | 1.003 | 1.018 |
| (0.094) | (0.124) | |
| Worse democracy (Freedom House civil liberties) | 0.746*** | 0.749*** |
| (0.066) | (0.068) | |
| Lowest tier | 4.867*** | 6.276 |
| (1.361) | (8.380) | |
| Share of women in parliament | 1.031*** | 1.031*** |
| (0.012) | (0.012) | |
| 2000 TIP protocol ratification | 1.916** | 1.940** |
| (0.508) | (0.528) | |
| Regional density of criminalization | 10.728*** | 10.460*** |
| (6.383) | (6.363) | |
| Missing info | 1.109 | 1.108 |
| (0.095) | (0.095) | |
| GDP per capita × Lowest tier | 0.967 | |
| (0.168) | ||
| Constant | 0.048*** | 0.043*** |
| (0.048) | (0.051) | |
| Year fixed effects | Yes | Yes |
| Pseudo R-squared | 0.1631 | 0.1631 |
| Observations | 1,021 | 1,021 |
| Log Likelihood | -264.494 | -264.475 |
| Note: | p<0.1; p<0.05; p<0.01 | |
| Log odds reported; standard errors in parentheses. All explanatory variables are lagged one period unless otherwise noted. | ||
2.12.3 Interactions (visualized)
Note: All covariate values held at their mean or modal values; year held constant at 2005. Rug below indicates actual observed values.
3 Downgrading
3.1 Democracy × downgrading
3.1.1 Descriptive
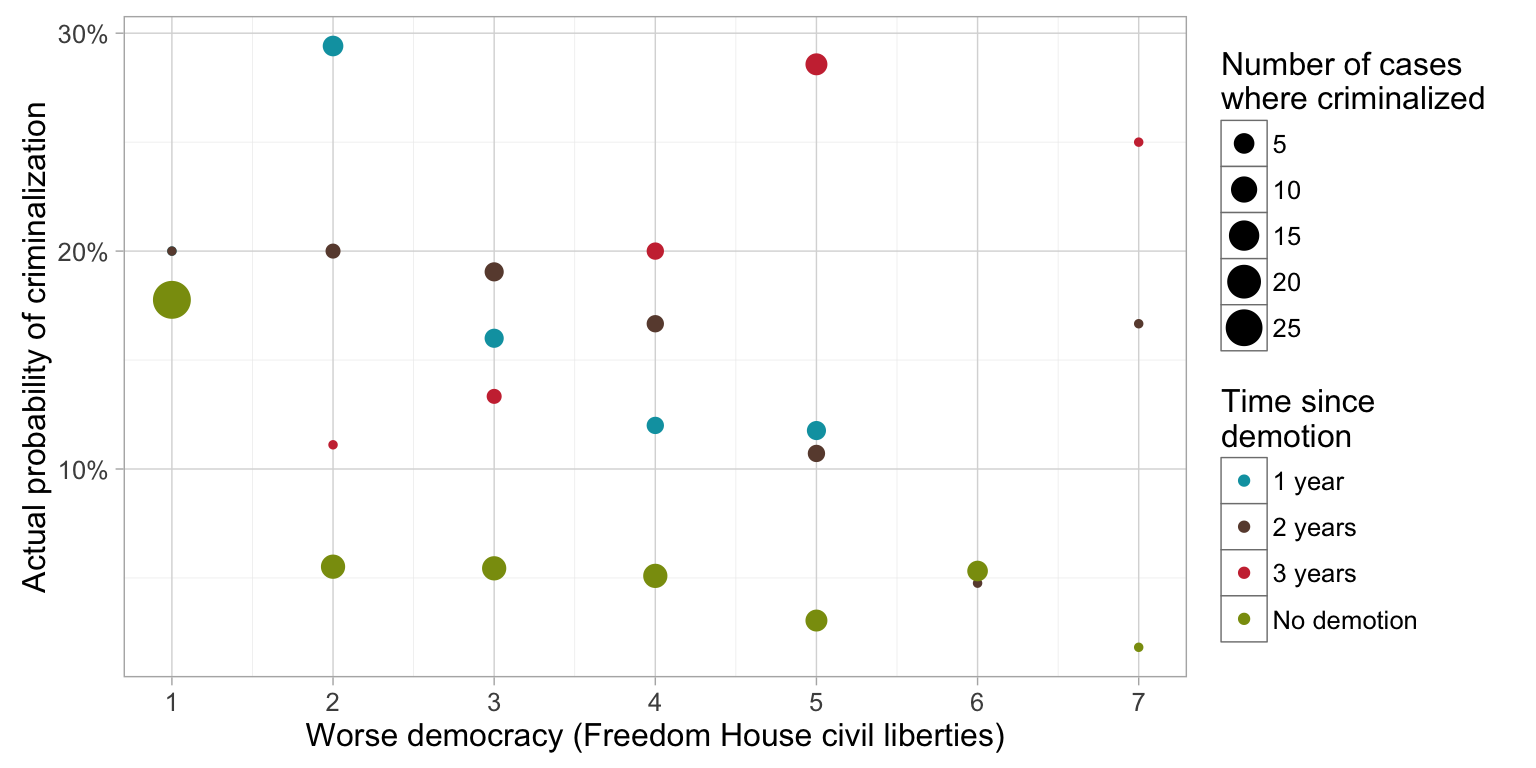
3.1.2 Interactions (models)
| Criminalization | ||
| (1) | (2) | |
| Worse democracy (Freedom House civil liberties) | 0.808*** | 0.770*** |
| (0.059) | (0.070) | |
| First demotion (t−3) | 3.369*** | 0.387 |
| (1.317) | (0.412) | |
| First demotion (t−2) | 2.648** | 1.954 |
| (1.003) | (1.736) | |
| First demotion (t−1) | 2.008** | 3.735* |
| (0.662) | (2.948) | |
| Share of women in parliament | 1.033*** | 1.032*** |
| (0.012) | (0.012) | |
| 2000 TIP protocol ratification | 1.705** | 1.800** |
| (0.443) | (0.474) | |
| Regional density of criminalization | 9.569*** | 9.072*** |
| (5.329) | (5.123) | |
| Missing info | 1.097 | 1.098 |
| (0.090) | (0.091) | |
| Worse democracy × First demotion (t−3) | 1.693** | |
| (0.390) | ||
| Worse democracy × First demotion (t−2) | 1.091 | |
| (0.237) | ||
| Worse democracy × First demotion (t−1) | 0.853 | |
| (0.179) | ||
| Constant | 0.046*** | 0.053*** |
| (0.024) | (0.029) | |
| Year fixed effects | Yes | Yes |
| Pseudo R-squared | 0.1328 | 0.1422 |
| Observations | 1,031 | 1,031 |
| Log Likelihood | -278.865 | -275.827 |
| Note: | p<0.1; p<0.05; p<0.01 | |
| Log odds reported; standard errors in parentheses. All explanatory variables are lagged one period unless otherwise noted. | ||
3.1.3 Interactions (visualized)
Note: All covariate values held at their mean or modal values; year held constant at 2005. Rug below indicates actual observed values.
3.2 NGO engagement × downgrading
3.2.1 Descriptive
3.2.2 Interactions (models)
| Criminalization | ||
| (1) | (2) | |
| NGO engagement | 1.086 | 1.119 |
| (0.094) | (0.118) | |
| Worse democracy (Freedom House civil liberties) | 0.818*** | 0.820*** |
| (0.061) | (0.061) | |
| First demotion (t−3) | 3.291*** | 3.648 |
| (1.292) | (3.082) | |
| First demotion (t−2) | 2.522** | 2.698 |
| (0.964) | (2.341) | |
| First demotion (t−1) | 1.935** | 3.042 |
| (0.640) | (2.365) | |
| Share of women in parliament | 1.034*** | 1.034*** |
| (0.012) | (0.012) | |
| 2000 TIP protocol ratification | 1.750** | 1.757** |
| (0.459) | (0.462) | |
| Regional density of criminalization | 8.393*** | 8.441*** |
| (4.806) | (4.865) | |
| Missing info | 1.109 | 1.110 |
| (0.092) | (0.092) | |
| Worse democracy × First demotion (t−3) | 0.966 | |
| (0.241) | ||
| Worse democracy × First demotion (t−2) | 0.977 | |
| (0.230) | ||
| Worse democracy × First demotion (t−1) | 0.864 | |
| (0.200) | ||
| Constant | 0.033*** | 0.030*** |
| (0.021) | (0.020) | |
| Year fixed effects | Yes | Yes |
| Pseudo R-squared | 0.1325 | 0.1332 |
| Observations | 1,022 | 1,022 |
| Log Likelihood | -278.160 | -277.943 |
| Note: | p<0.1; p<0.05; p<0.01 | |
| Log odds reported; standard errors in parentheses. All explanatory variables are lagged one period unless otherwise noted. | ||
3.2.3 Interactions (visualized)
Note: All covariate values held at their mean or modal values; year held constant at 2005. Rug below indicates actual observed values.
3.3 Media coverage × downgrading
3.3.1 Descriptive
3.3.2 Interactions (models)
| Criminalization | ||
| (1) | (2) | |
| Media coverage | 1.003** | 1.004*** |
| (0.001) | (0.001) | |
| Worse democracy (Freedom House civil liberties) | 0.786*** | 0.782*** |
| (0.058) | (0.058) | |
| First demotion (t−3) | 3.272*** | 5.130*** |
| (1.290) | (2.565) | |
| First demotion (t−2) | 2.725*** | 3.093** |
| (1.037) | (1.480) | |
| First demotion (t−1) | 2.070** | 2.169* |
| (0.687) | (0.893) | |
| Share of women in parliament | 1.032*** | 1.032*** |
| (0.012) | (0.012) | |
| 2000 TIP protocol ratification | 2.060*** | 2.065*** |
| (0.562) | (0.566) | |
| Regional density of criminalization | 9.244*** | 8.744*** |
| (5.164) | (4.931) | |
| Missing info | 1.195** | 1.197** |
| (0.107) | (0.108) | |
| Worse democracy × First demotion (t−3) | 0.995 | |
| (0.004) | ||
| Worse democracy × First demotion (t−2) | 0.999 | |
| (0.003) | ||
| Worse democracy × First demotion (t−1) | 0.999 | |
| (0.003) | ||
| Constant | 0.037*** | 0.036*** |
| (0.020) | (0.019) | |
| Year fixed effects | Yes | Yes |
| Pseudo R-squared | 0.1415 | 0.1451 |
| Observations | 1,031 | 1,031 |
| Log Likelihood | -276.063 | -274.908 |
| Note: | p<0.1; p<0.05; p<0.01 | |
| Log odds reported; standard errors in parentheses. All explanatory variables are lagged one period unless otherwise noted. | ||
3.3.3 Interactions (visualized)
Note: All covariate values held at their mean or modal values; year held constant at 2005. Rug below indicates actual observed values.
3.4 US foreign aid × downgrading
3.4.1 Descriptive
3.4.2 Interactions (models)
| Criminalization | ||
| (1) | (2) | |
| US aid (logged) | 0.975 | 0.970 |
| (0.022) | (0.023) | |
| Worse democracy (Freedom House civil liberties) | 0.836** | 0.831** |
| (0.066) | (0.066) | |
| First demotion (t−3) | 3.374*** | 5.445 |
| (1.317) | (8.159) | |
| First demotion (t−2) | 2.674*** | 3.788 |
| (1.011) | (4.746) | |
| First demotion (t−1) | 2.082** | 0.002** |
| (0.689) | (0.007) | |
| Share of women in parliament | 1.032*** | 1.030*** |
| (0.012) | (0.012) | |
| 2000 TIP protocol ratification | 1.867** | 1.949** |
| (0.510) | (0.538) | |
| Regional density of criminalization | 8.528*** | 9.307*** |
| (4.828) | (5.304) | |
| Missing info | 1.069 | 1.096 |
| (0.092) | (0.096) | |
| Worse democracy × First demotion (t−3) | 0.973 | |
| (0.086) | ||
| Worse democracy × First demotion (t−2) | 0.980 | |
| (0.074) | ||
| Worse democracy × First demotion (t−1) | 1.480** | |
| (0.246) | ||
| Constant | 0.060*** | 0.062*** |
| (0.035) | (0.036) | |
| Year fixed effects | Yes | Yes |
| Pseudo R-squared | 0.1348 | 0.1462 |
| Observations | 1,031 | 1,031 |
| Log Likelihood | -278.223 | -274.550 |
| Note: | p<0.1; p<0.05; p<0.01 | |
| Log odds reported; standard errors in parentheses. All explanatory variables are lagged one period unless otherwise noted. | ||
3.4.3 Interactions (visualized)
Note: All covariate values held at their mean or modal values; year held constant at 2005. Rug below indicates actual observed values.
3.5 US trade × downgrading
3.5.1 Descriptive
3.5.2 Interactions (models)
| Criminalization | ||
| (1) | (2) | |
| Share of US trade (part of GDP) | 0.921 | 0.832 |
| (1.034) | (1.148) | |
| Worse democracy (Freedom House civil liberties) | 0.844** | 0.845** |
| (0.065) | (0.065) | |
| First demotion (t−3) | 3.188*** | 3.974*** |
| (1.254) | (1.949) | |
| First demotion (t−2) | 2.505** | 2.369* |
| (0.957) | (1.170) | |
| First demotion (t−1) | 1.850* | 1.529 |
| (0.626) | (0.669) | |
| Share of women in parliament | 1.035*** | 1.035*** |
| (0.012) | (0.012) | |
| 2000 TIP protocol ratification | 1.736** | 1.751** |
| (0.469) | (0.474) | |
| Regional density of criminalization | 9.442*** | 9.612*** |
| (5.477) | (5.576) | |
| Missing info | 1.051 | 1.051 |
| (0.091) | (0.092) | |
| Worse democracy × First demotion (t−3) | 0.057 | |
| (0.242) | ||
| Worse democracy × First demotion (t−2) | 1.619 | |
| (6.034) | ||
| Worse democracy × First demotion (t−1) | 6.540 | |
| (18.979) | ||
| Constant | 0.047*** | 0.047*** |
| (0.025) | (0.026) | |
| Year fixed effects | Yes | Yes |
| Pseudo R-squared | 0.1275 | 0.1291 |
| Observations | 940 | 940 |
| Log Likelihood | -264.704 | -264.195 |
| Note: | p<0.1; p<0.05; p<0.01 | |
| Log odds reported; standard errors in parentheses. All explanatory variables are lagged one period unless otherwise noted. | ||
3.5.3 Interactions (visualized)
Note: All covariate values held at their mean or modal values; year held constant at 2005. Rug below indicates actual observed values.
3.6 Protocol ratified × downgrading
3.6.1 Descriptive
3.6.2 Interactions (models)
| Criminalization | ||
| (1) | (2) | |
| Worse democracy (Freedom House civil liberties) | 0.808*** | 0.796*** |
| (0.059) | (0.059) | |
| First demotion (t−3) | 3.369*** | 4.588** |
| (1.317) | (2.884) | |
| First demotion (t−2) | 2.648** | 4.568*** |
| (1.003) | (2.406) | |
| First demotion (t−1) | 2.008** | 3.056** |
| (0.662) | (1.456) | |
| Share of women in parliament | 1.033*** | 1.033*** |
| (0.012) | (0.012) | |
| 2000 TIP protocol ratification | 1.705** | 2.353*** |
| (0.443) | (0.768) | |
| Regional density of criminalization | 9.569*** | 9.703*** |
| (5.329) | (5.396) | |
| Missing info | 1.097 | 1.116 |
| (0.090) | (0.093) | |
| Worse democracy × First demotion (t−3) | 0.619 | |
| (0.472) | ||
| Worse democracy × First demotion (t−2) | 0.376 | |
| (0.266) | ||
| Worse democracy × First demotion (t−1) | 0.481 | |
| (0.303) | ||
| Constant | 0.046*** | 0.043*** |
| (0.024) | (0.022) | |
| Year fixed effects | Yes | Yes |
| Pseudo R-squared | 0.1328 | 0.1372 |
| Observations | 1,031 | 1,031 |
| Log Likelihood | -278.865 | -277.431 |
| Note: | p<0.1; p<0.05; p<0.01 | |
| Log odds reported; standard errors in parentheses. All explanatory variables are lagged one period unless otherwise noted. | ||
3.6.3 Interactions (visualized)
Note: All covariate values held at their mean or modal values; year held constant at 2005.
3.7 Wikileaks engagement/intensity × downgrading
3.7.1 Descriptive
3.7.2 Interactions (models)
| Criminalization | ||
| (1) | (2) | |
| Proportion of TIP-related cables (observed in Wikileaks) | 6.975 | 4.115 |
| (10.651) | (7.187) | |
| Worse democracy (Freedom House civil liberties) | 0.786** | 0.785** |
| (0.076) | (0.077) | |
| First demotion (t−3) | 2.434** | 1.504 |
| (1.058) | (0.901) | |
| First demotion (t−2) | 2.223* | 2.069 |
| (0.979) | (1.239) | |
| First demotion (t−1) | 2.292** | 2.389 |
| (0.906) | (1.282) | |
| Share of women in parliament | 1.030** | 1.032** |
| (0.014) | (0.014) | |
| 2000 TIP protocol ratification | 1.335 | 1.284 |
| (0.431) | (0.420) | |
| Regional density of criminalization | 5.523*** | 5.354** |
| (3.600) | (3.573) | |
| Missing info | 1.189 | 1.177 |
| (0.133) | (0.134) | |
| Worse democracy × First demotion (t−3) | 39,981.810 | |
| (333,848.900) | ||
| Worse democracy × First demotion (t−2) | 5.408 | |
| (34.791) | ||
| Worse democracy × First demotion (t−1) | 0.993 | |
| (7.053) | ||
| Constant | 0.022*** | 0.023*** |
| (0.025) | (0.026) | |
| Year fixed effects | Yes | Yes |
| Pseudo R-squared | 0.1338 | 0.1382 |
| Observations | 563 | 563 |
| Log Likelihood | -167.293 | -166.451 |
| Note: | p<0.1; p<0.05; p<0.01 | |
| Log odds reported; standard errors in parentheses. All explanatory variables are lagged one period unless otherwise noted. | ||
3.7.3 Interactions (visualized)
Note: All covariate values held at their mean or modal values; year held constant at 2005. Rug below indicates actual observed values.
3.8 TIP NGO count × downgrading
3.8.1 Descriptive
3.8.2 Interactions (models)
| Criminalization | ||
| (1) | (2) | |
| Number of anti-TIP NGOs | 1.018* | 1.024** |
| (0.010) | (0.011) | |
| Worse democracy (Freedom House civil liberties) | 0.864* | 0.854* |
| (0.072) | (0.072) | |
| First demotion (t−3) | 2.535** | 3.997** |
| (1.080) | (2.247) | |
| First demotion (t−2) | 2.478** | 3.058** |
| (1.005) | (1.505) | |
| First demotion (t−1) | 2.000* | 2.213* |
| (0.727) | (0.927) | |
| Share of women in parliament | 1.035*** | 1.034*** |
| (0.012) | (0.012) | |
| 2000 TIP protocol ratification | 1.630* | 1.589 |
| (0.468) | (0.455) | |
| Regional density of criminalization | 13.392*** | 12.107*** |
| (8.142) | (7.431) | |
| Missing info | 1.198* | 1.173 |
| (0.117) | (0.117) | |
| Worse democracy × First demotion (t−3) | 0.928 | |
| (0.067) | ||
| Worse democracy × First demotion (t−2) | 0.971 | |
| (0.043) | ||
| Worse democracy × First demotion (t−1) | 0.985 | |
| (0.030) | ||
| Constant | 0.025*** | 0.026*** |
| (0.015) | (0.016) | |
| Year fixed effects | Yes | Yes |
| Pseudo R-squared | 0.1307 | 0.135 |
| Observations | 835 | 835 |
| Log Likelihood | -242.588 | -241.375 |
| Note: | p<0.1; p<0.05; p<0.01 | |
| Log odds reported; standard errors in parentheses. All explanatory variables are lagged one period unless otherwise noted. | ||
3.8.3 Interactions (visualized)
Note: All covariate values held at their mean or modal values; year held constant at 2005. Rug below indicates actual observed values.
3.9 TIP funding from US × downgrading
3.9.1 Descriptive
3.9.2 Interactions (models)
| Criminalization | ||
| (1) | (2) | |
| Total anti-TIP funding from US (log) | 1.033 | 1.043 |
| (0.022) | (0.030) | |
| Worse democracy (Freedom House civil liberties) | 0.796*** | 0.790*** |
| (0.059) | (0.059) | |
| First demotion (t−3) | 3.112*** | 4.044** |
| (1.234) | (2.303) | |
| First demotion (t−2) | 2.642** | 2.379* |
| (1.008) | (1.232) | |
| First demotion (t−1) | 1.928** | 2.359* |
| (0.644) | (1.072) | |
| Share of women in parliament | 1.032*** | 1.033*** |
| (0.012) | (0.012) | |
| 2000 TIP protocol ratification | 1.686** | 1.683** |
| (0.439) | (0.439) | |
| Regional density of criminalization | 9.593*** | 10.098*** |
| (5.330) | (5.639) | |
| Missing info | 1.131 | 1.140 |
| (0.096) | (0.098) | |
| Worse democracy × First demotion (t−3) | 0.966 | |
| (0.056) | ||
| Worse democracy × First demotion (t−2) | 1.016 | |
| (0.058) | ||
| Worse democracy × First demotion (t−1) | 0.969 | |
| (0.051) | ||
| Constant | 0.045*** | 0.044*** |
| (0.024) | (0.023) | |
| Year fixed effects | Yes | Yes |
| Pseudo R-squared | 0.1363 | 0.1378 |
| Observations | 1,027 | 1,027 |
| Log Likelihood | -277.390 | -276.916 |
| Note: | p<0.1; p<0.05; p<0.01 | |
| Log odds reported; standard errors in parentheses. All explanatory variables are lagged one period unless otherwise noted. | ||
3.9.3 Interactions (visualized)
Note: All covariate values held at their mean or modal values; year held constant at 2005. Rug below indicates actual observed values.
3.10 Government stability × downgrading
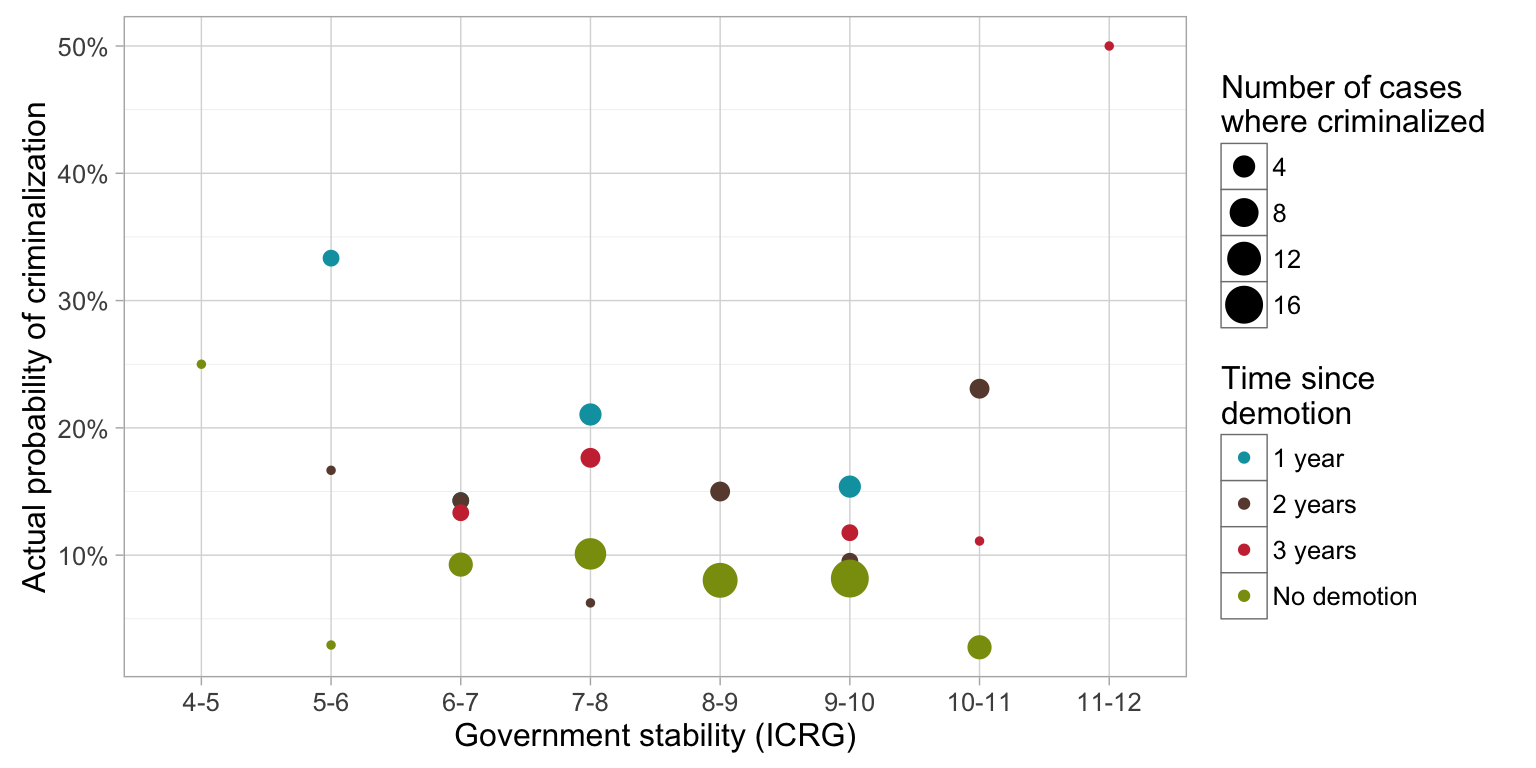
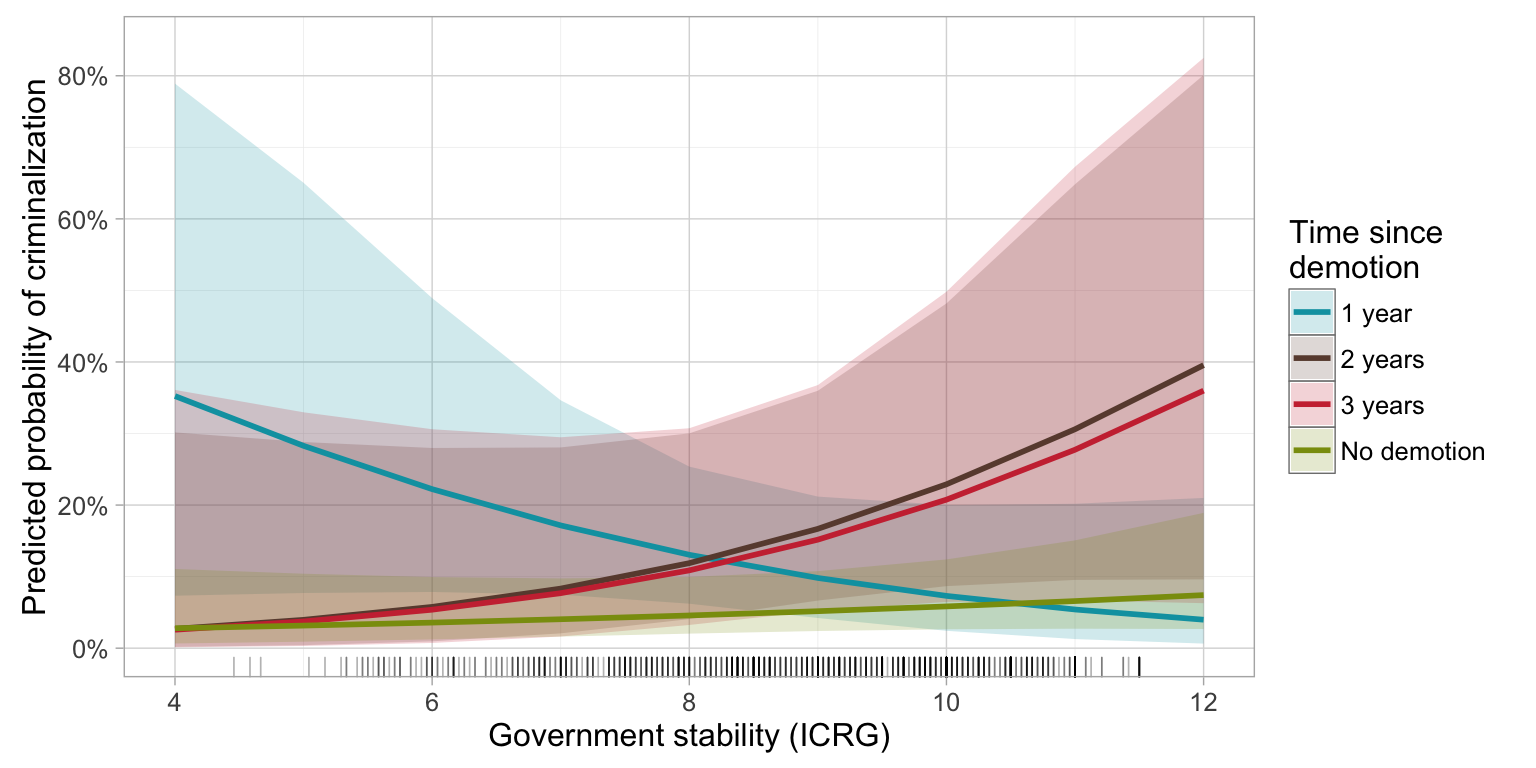
3.10.1 Descriptive
3.10.2 Interactions (models)
| Criminalization | ||
| (1) | (2) | |
| Government stability (ICRG) | 1.105 | 1.137 |
| (0.106) | (0.141) | |
| Worse democracy (Freedom House civil liberties) | 0.737*** | 0.722*** |
| (0.076) | (0.077) | |
| First demotion (t−3) | 3.003** | 0.335 |
| (1.464) | (0.907) | |
| First demotion (t−2) | 3.498*** | 0.334 |
| (1.485) | (0.859) | |
| First demotion (t−1) | 2.543** | 114.958** |
| (0.958) | (238.016) | |
| Share of women in parliament | 1.035** | 1.036** |
| (0.015) | (0.015) | |
| 2000 TIP protocol ratification | 1.805* | 1.831* |
| (0.560) | (0.569) | |
| Regional density of criminalization | 7.472*** | 7.062*** |
| (5.088) | (4.860) | |
| Missing info | 1.048 | 1.033 |
| (0.114) | (0.114) | |
| Government stability × First demotion (t−3) | 1.289 | |
| (0.390) | ||
| Government stability × First demotion (t−2) | 1.305 | |
| (0.368) | ||
| Government stability × First demotion (t−1) | 0.637* | |
| (0.155) | ||
| Constant | 0.028*** | 0.024*** |
| (0.029) | (0.031) | |
| Year fixed effects | Yes | Yes |
| Pseudo R-squared | 0.1468 | 0.1581 |
| Observations | 822 | 822 |
| Log Likelihood | -218.086 | -215.190 |
| Note: | p<0.1; p<0.05; p<0.01 | |
| Log odds reported; standard errors in parentheses. All explanatory variables are lagged one period unless otherwise noted. | ||
3.10.3 Interactions (visualized)
Note: All covariate values held at their mean or modal values; year held constant at 2005. Rug below indicates actual observed values.
3.11 Conflict × downgrading
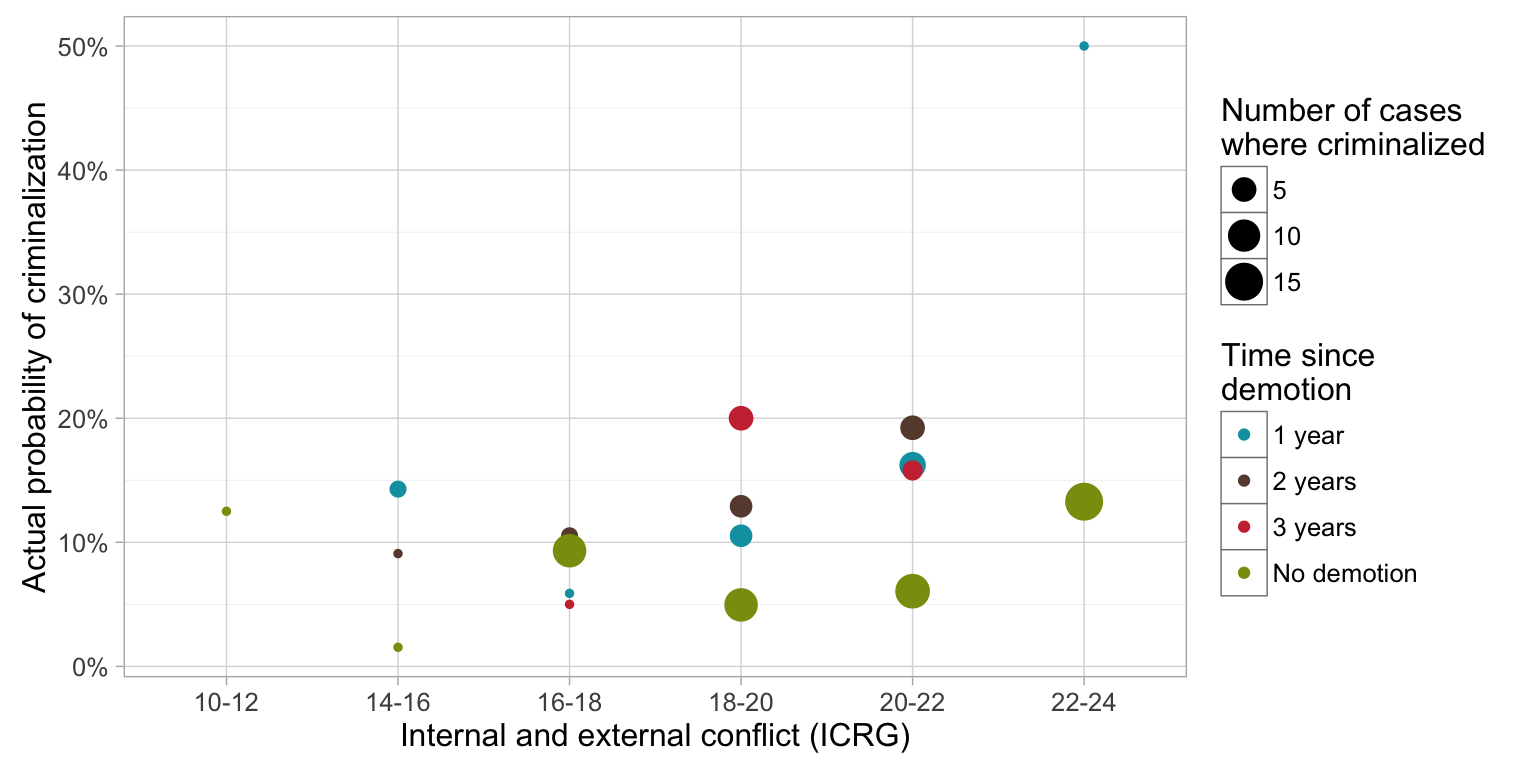
3.11.1 Descriptive
3.11.2 Interactions (models)
| Criminalization | ||
| (1) | (2) | |
| Internal and external conflict (ICRG) | 1.070 | 1.087 |
| (0.074) | (0.095) | |
| Worse democracy (Freedom House civil liberties) | 0.781** | 0.783** |
| (0.087) | (0.087) | |
| First demotion (t−3) | 2.880** | 1.625 |
| (1.402) | (7.404) | |
| First demotion (t−2) | 3.394*** | 11.725 |
| (1.436) | (40.102) | |
| First demotion (t−1) | 2.503** | 6.556 |
| (0.941) | (20.915) | |
| Share of women in parliament | 1.033** | 1.032** |
| (0.015) | (0.015) | |
| 2000 TIP protocol ratification | 1.745* | 1.763* |
| (0.535) | (0.545) | |
| Regional density of criminalization | 7.220*** | 7.118*** |
| (4.969) | (4.899) | |
| Missing info | 1.053 | 1.048 |
| (0.114) | (0.114) | |
| Internal and external conflict × First demotion (t−3) | 1.030 | |
| (0.240) | ||
| Internal and external conflict × First demotion (t−2) | 0.938 | |
| (0.165) | ||
| Internal and external conflict × First demotion (t−1) | 0.952 | |
| (0.155) | ||
| Constant | 0.016*** | 0.012** |
| (0.025) | (0.022) | |
| Year fixed effects | Yes | Yes |
| Pseudo R-squared | 0.1466 | 0.147 |
| Observations | 822 | 822 |
| Log Likelihood | -218.138 | -218.027 |
| Note: | p<0.1; p<0.05; p<0.01 | |
| Log odds reported; standard errors in parentheses. All explanatory variables are lagged one period unless otherwise noted. | ||
3.11.3 Interactions (visualized)
Note: All covariate values held at their mean or modal values; year held constant at 2005. Rug below indicates actual observed values.
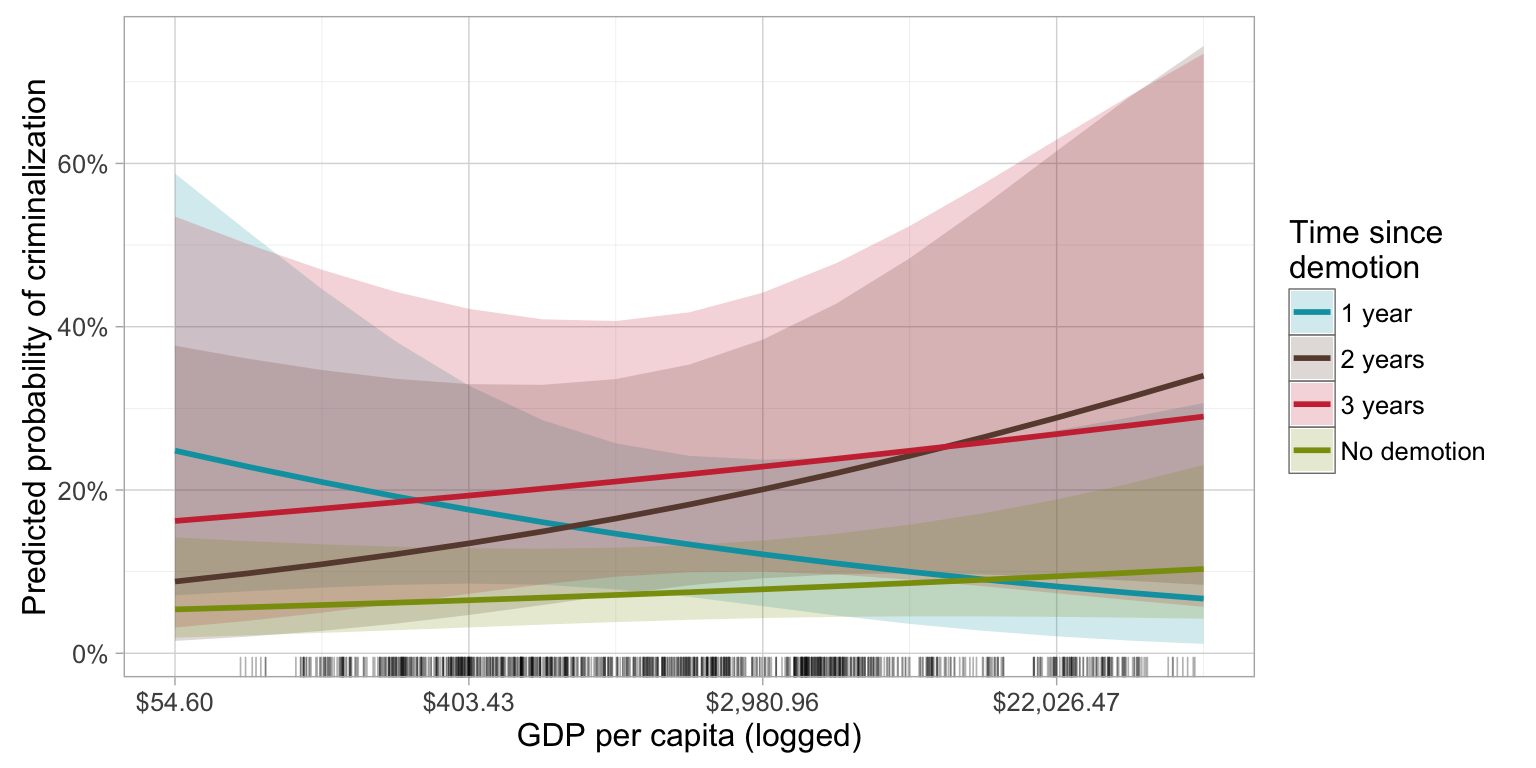
3.12 GDP/capita × downgrading
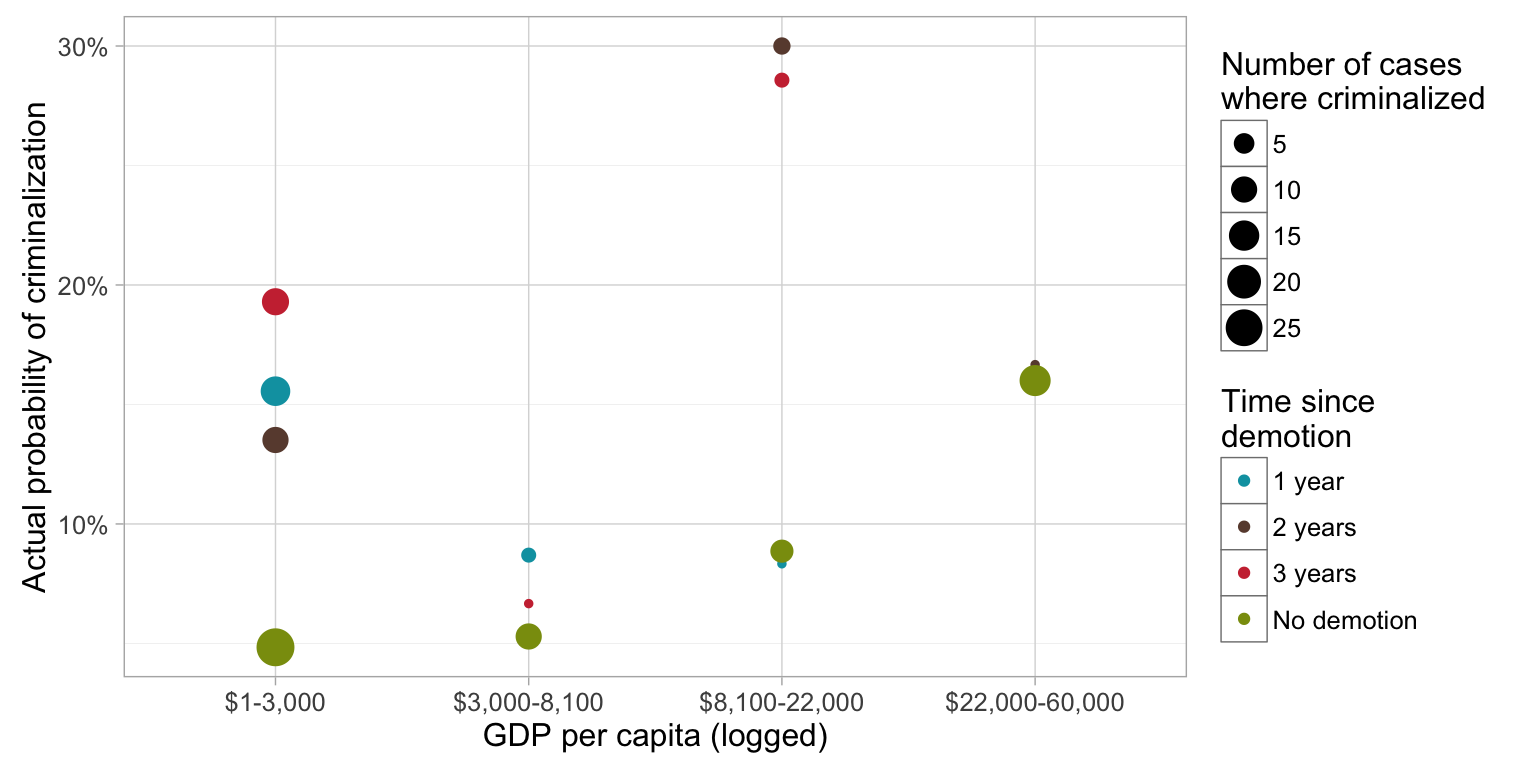
3.12.1 Descriptive
3.12.2 Interactions (models)
| Criminalization | ||
| (1) | (2) | |
| GDP per capita (logged) | 1.074 | 1.106 |
| (0.100) | (0.127) | |
| Worse democracy (Freedom House civil liberties) | 0.830** | 0.831** |
| (0.071) | (0.071) | |
| First demotion (t−3) | 3.407*** | 3.329 |
| (1.335) | (6.266) | |
| First demotion (t−2) | 2.726*** | 0.975 |
| (1.039) | (1.871) | |
| First demotion (t−1) | 2.076** | 20.848* |
| (0.688) | (34.270) | |
| Share of women in parliament | 1.032*** | 1.031*** |
| (0.012) | (0.012) | |
| 2000 TIP protocol ratification | 1.817** | 1.870** |
| (0.484) | (0.505) | |
| Regional density of criminalization | 8.438*** | 8.338*** |
| (4.887) | (4.930) | |
| Missing info | 1.081 | 1.078 |
| (0.091) | (0.091) | |
| GDP per capita × First demotion (t−3) | 1.006 | |
| (0.250) | ||
| GDP per capita × First demotion (t−2) | 1.149 | |
| (0.281) | ||
| GDP per capita × First demotion (t−1) | 0.727 | |
| (0.163) | ||
| Constant | 0.025*** | 0.021*** |
| (0.026) | (0.024) | |
| Year fixed effects | Yes | Yes |
| Pseudo R-squared | 0.1356 | 0.1399 |
| Observations | 1,021 | 1,021 |
| Log Likelihood | -273.168 | -271.812 |
| Note: | p<0.1; p<0.05; p<0.01 | |
| Log odds reported; standard errors in parentheses. All explanatory variables are lagged one period unless otherwise noted. | ||
3.12.3 Interactions (visualized)
Note: All covariate values held at their mean or modal values; year held constant at 2005. Rug below indicates actual observed values.
4 Summary
Different forms of scorecard diplomacy have varying effects on the probability of TIP criminalization in a country when interacted with other explanatory variables. These interactive effects are summarized visually and in prose in the table below.
4.1 Monitoring (presence in the TIP report)
| Variable | Descriptive | Interactions |
|---|---|---|
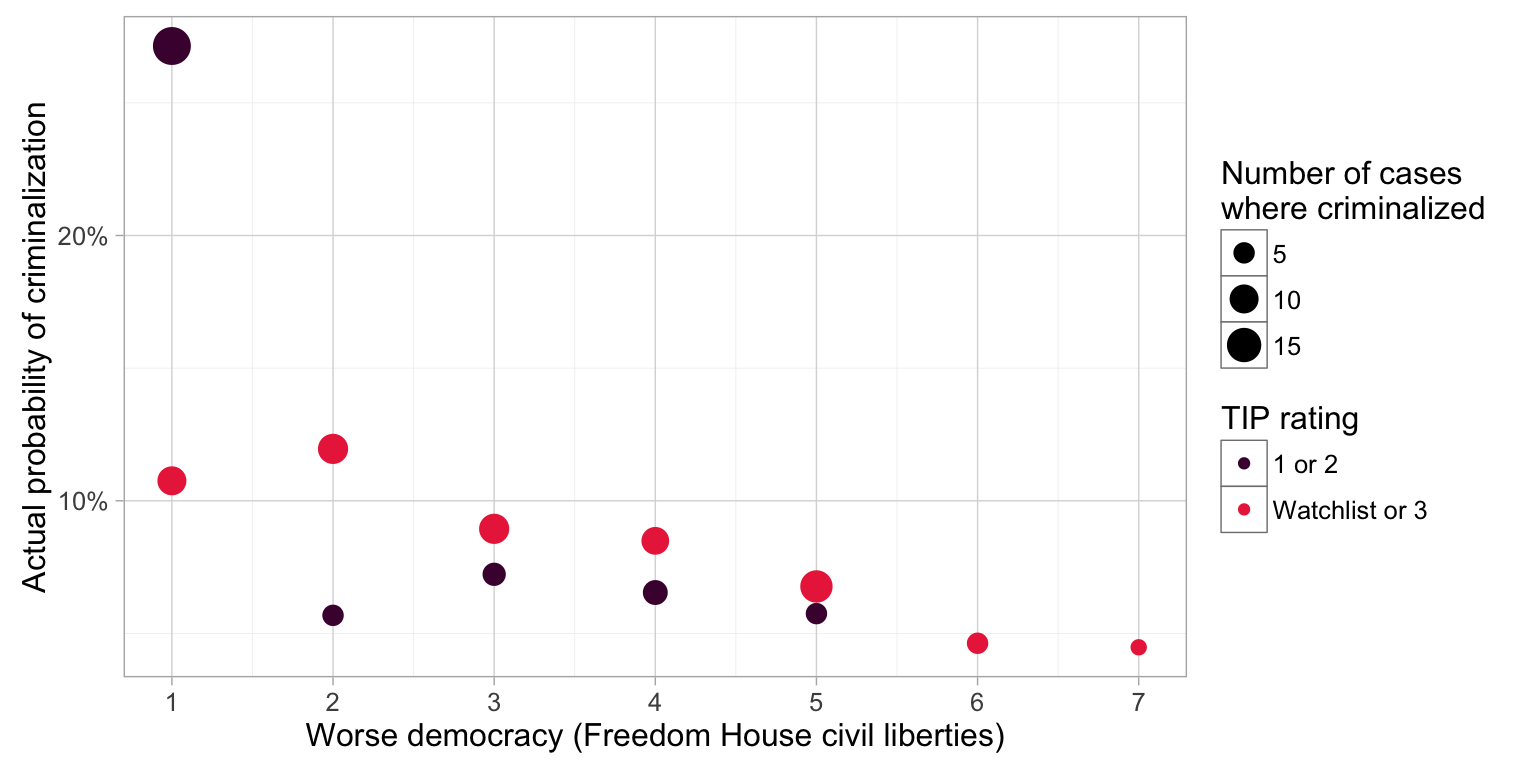
| Democracy | Countries with greater civil liberties are more likely to criminalize in the next year in general, but the relative impact of being in the report appears to be higher for countries with worse civil liberties (see figure). No countries with bad civil liberties criminalized in the next year without being in the report. | Statistically, this interactive effect is significant. Having worse democracy reduces the likelihood of criminalization in the next year by almost 70% for every increase in the Freedom House score (z = -0.61, p = 0.542), but the interaction with the TIP report increases that likelihood more than twofold (z = 2.22, p = 0.026). The effect of this interaction on the predicted probabilities of criminalization is apparent visually (see figure). |
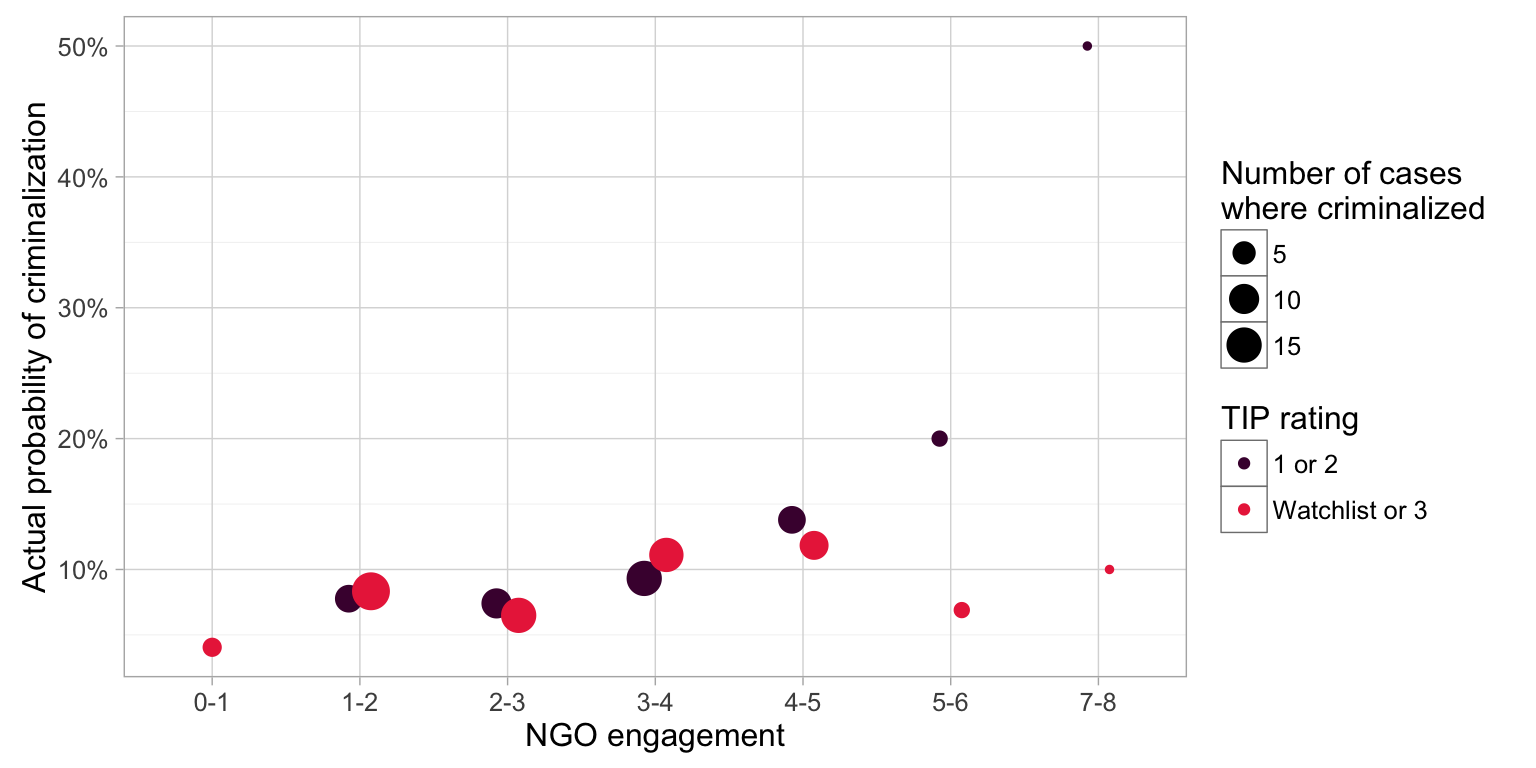
| NGO engagement | Countries with more active anti-TIP NGOs are more likely to criminalize in the next year in general, and presence in the TIP report appears to increase the probability of criminalization—the likelihood of criminalization in cases where a country is not included in the report is about 5% regardless of NGO engagement, while the probability doubles or triples when a case is in the report (see figure). | This interactive effect is visible when modeled statistically (see figure, though it is not significant (z = 0.97, p = 0.332). That said, when looking at the model’s predicted probabilities, the probability of criminalization in the next year decreases slightly as NGO engagement increases for cases not in the report, while the probability increases for cases included in the report. |
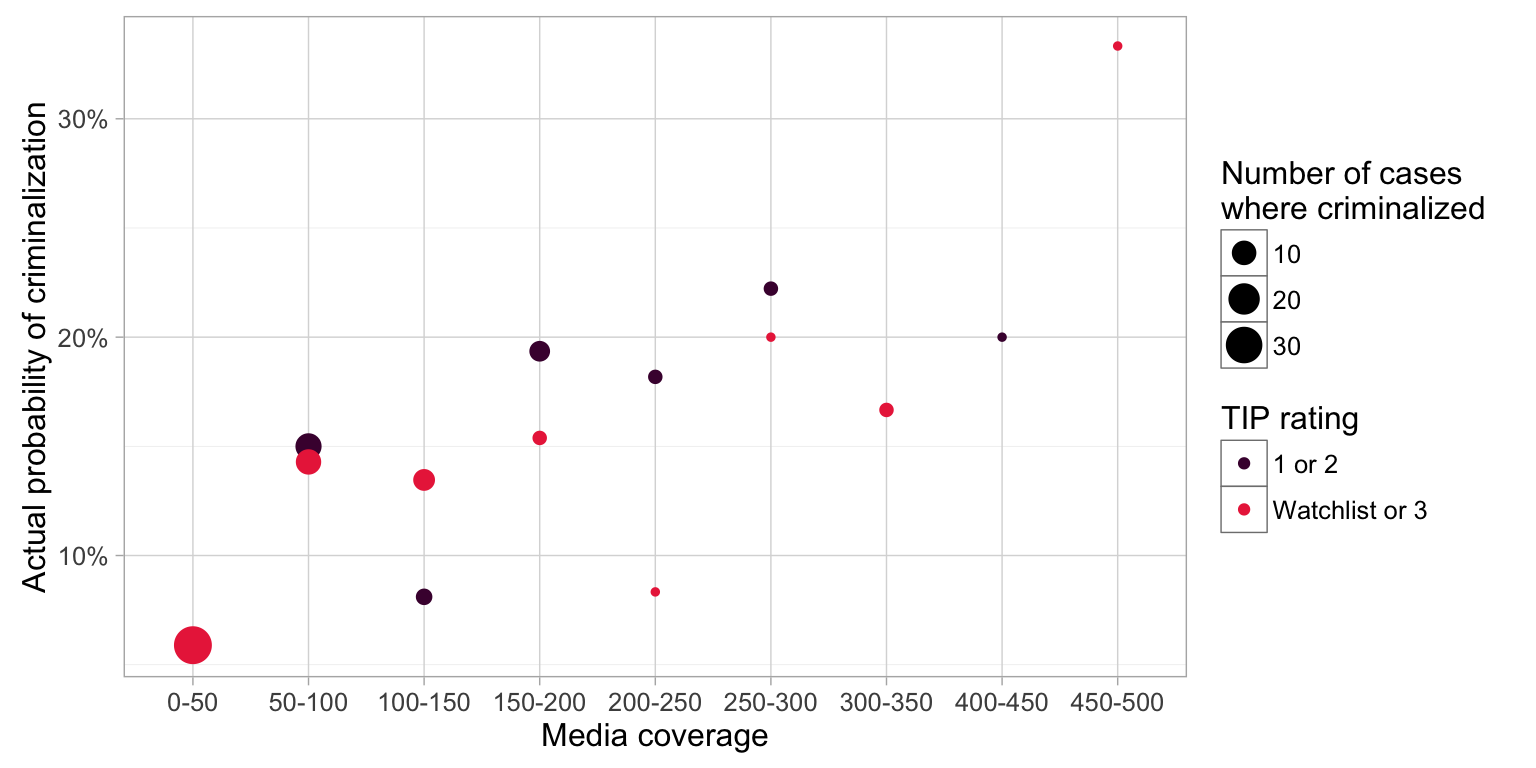
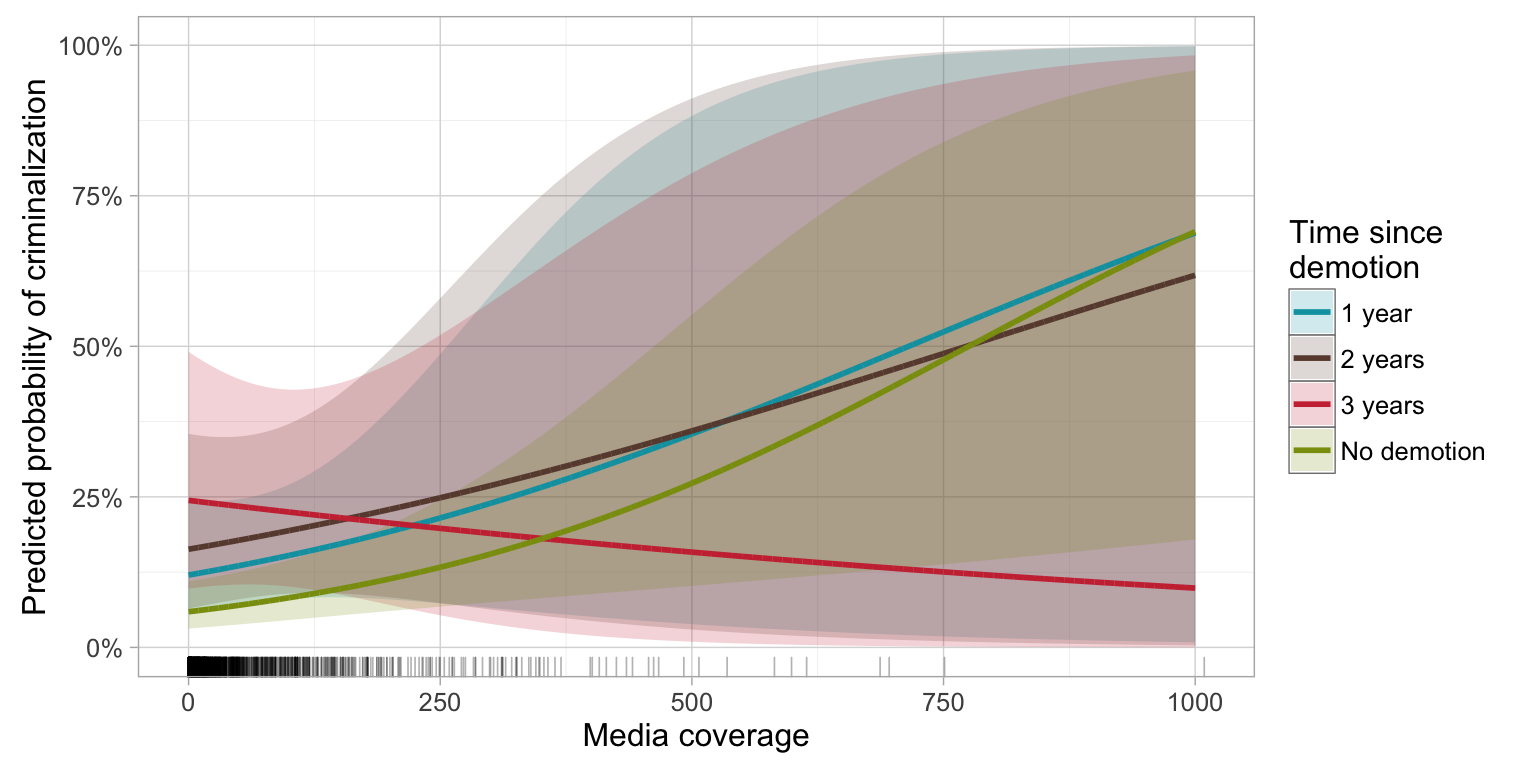
| Media coverage | Presence in the report appears to increase the probability of criminalization in the next year much faster when interacted with media coverage—that is, increased media coverage improves the likelihood of criminalization in general, but in cases where the country is included in the TIP report, that probability improves even more (see figure). | Increased media coverage does appear to increase the probability of criminalization in the next year slightly (Model 1: z = 2.19, p = 0.029) but the effect of the interaction of coverage and presence in the report is difficult to determine because no under-covered cases were ever not present in the report. This uncertainty is quite evident in the figure of predicted probabilities. |
| Foreign aid | Foreign aid has little apparent effect on the probability of criminalization in the next year—cases maintain approximately the same probability as logged foreign aid increases. However, for cases not included in the report, the probability of criminalization appears to decrease slightly as aid increases. Presence in the report thus may mitigate any negative effects aid might have (see figure). | The statistical model bears out this finding. For every increase in logged foreign aid, the probability of criminalization in the next year decreases by 8% (z = -1.97, p = 0.049), but presence in the TIP report has a counteracting significant positive effect (z = 1.66, p = 0.097). This is apparent in the figure of predicted probabilities, with the caveat that cases receiving no aid are driving some of this effect. |
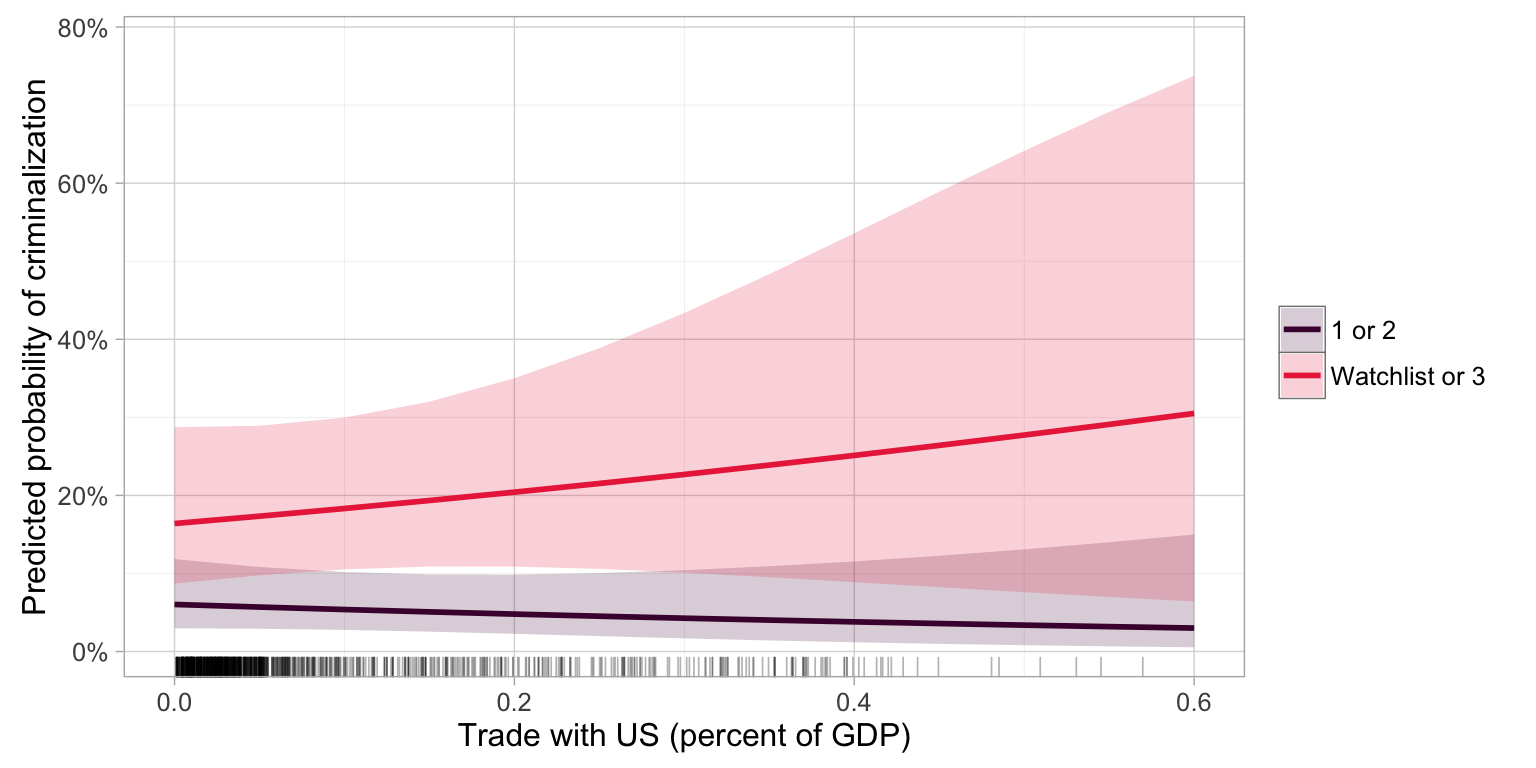
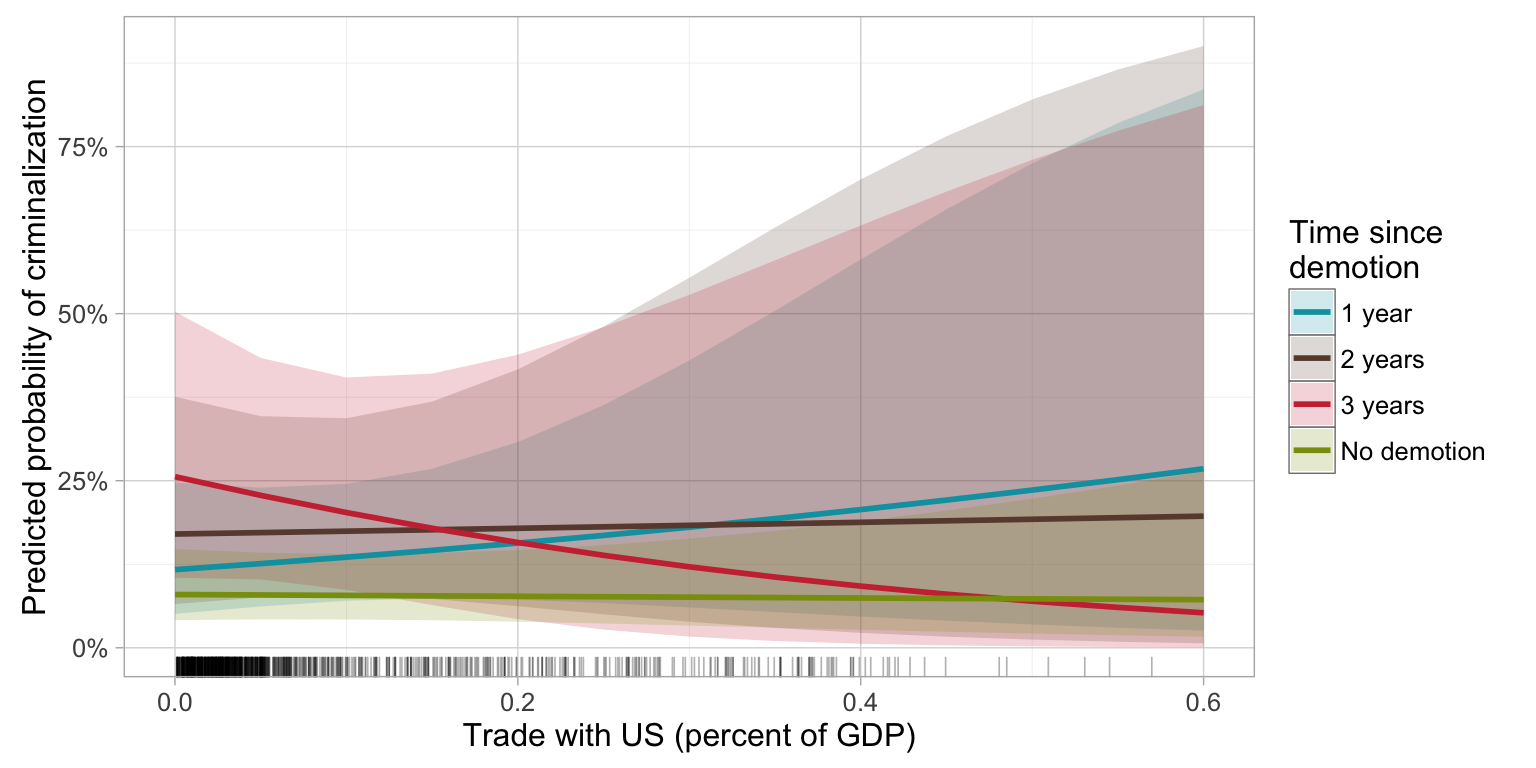
| US trade | In general, trade with the US alone does little to change the probability of criminalization in the next year, except in cases with the highest amounts of trade (where trade is 0.5–0.6% of the case’s GDP). Presence in the TIP report increases that probability at every level of trade. However, it does not appear that trade and presence in the report interact (see figure). | Modeling the relationship confirms this hunch. Increased trade has no significant effect on the likelihood of criminalization in the next year (z = 0.32, p = 0.750), while presence in the report increases that probability by more than 4 times (z = 2.56, p = 0.010). The interaction between the two is insignificant (z = -0.10, p = 0.921), both mathematically and visually (see figure). |
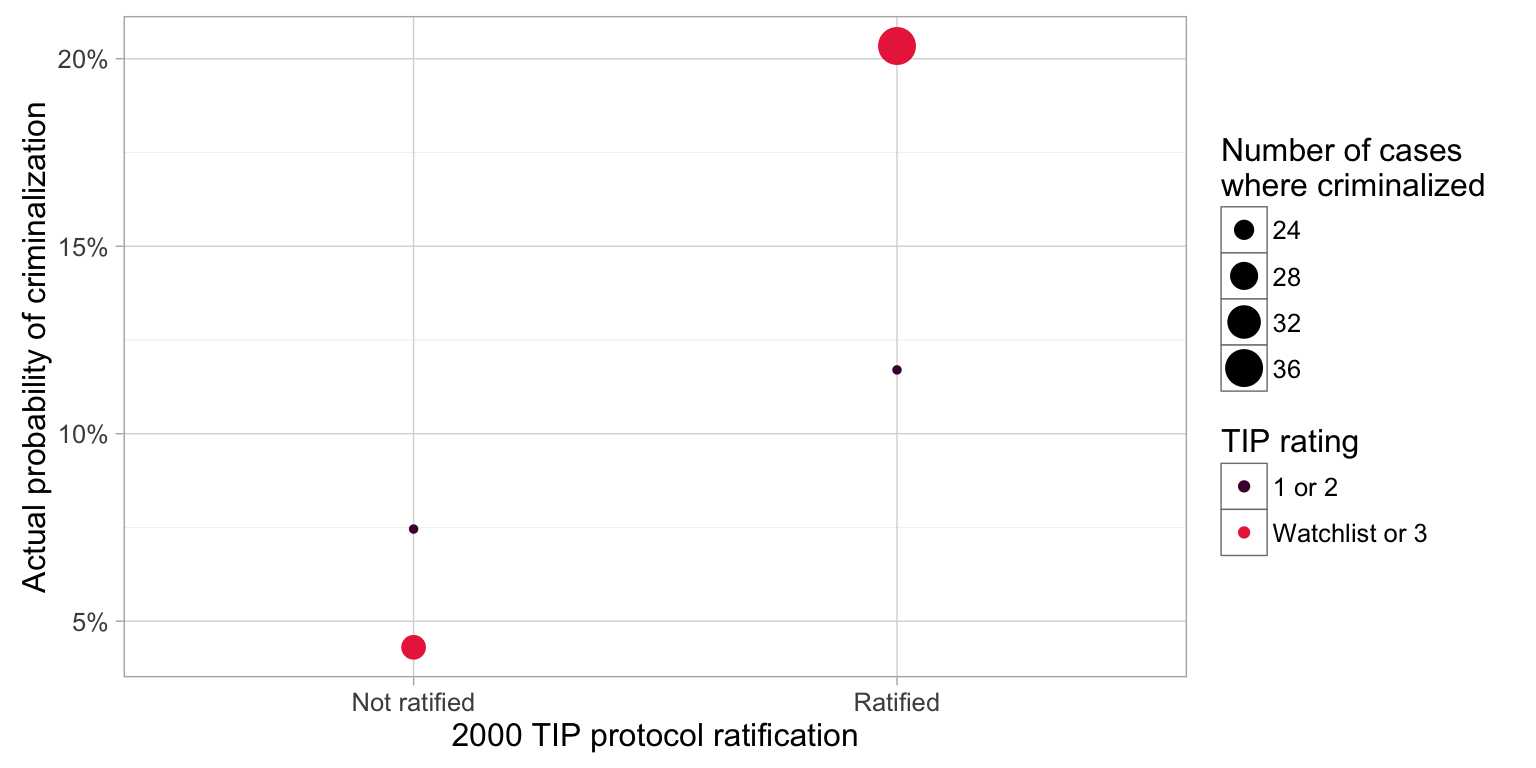
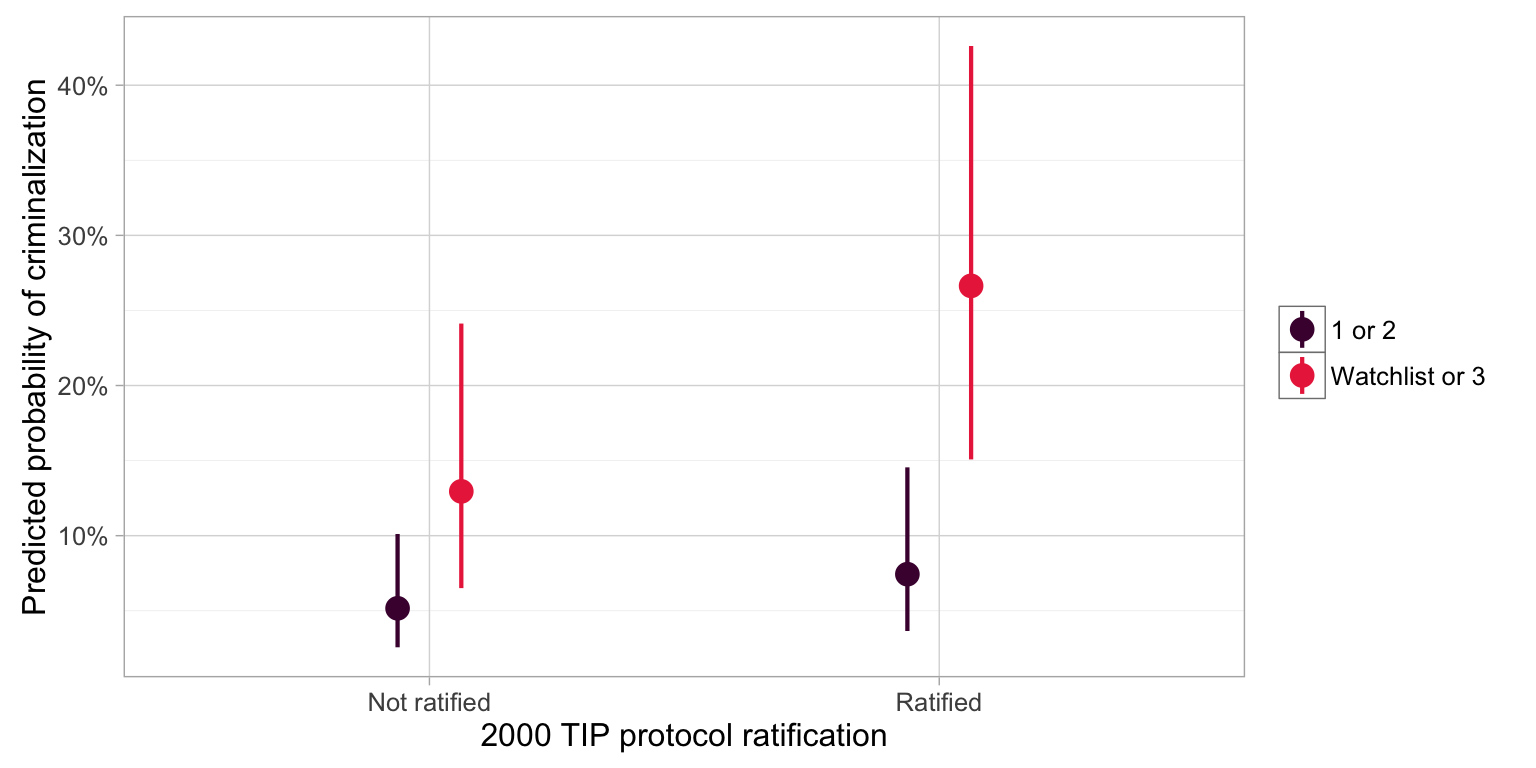
| 2000 protocol ratification | Ratification of the UN’s 2000 anti-TIP protocol appears to improve the probability of criminalization in the next year, and scorecard diplomacy increases that probability even more, as presence in the TIP report combined with protocol ratification yields the highest probability of criminalization (see figure) | Statistics confirm this finding, to some extent. Presence in the report increases the probability of criminalization in the next year by almost 4 times (z = 3.16, p = 0.002), while protocol ratification has a negligible positive effect (z = 0.33, p = 0.742; notably, this effect is significant when not interacting with the TIP report). The interaction term is positive, but insignificant (z = 0.39, p = 0.694) (see figure). |
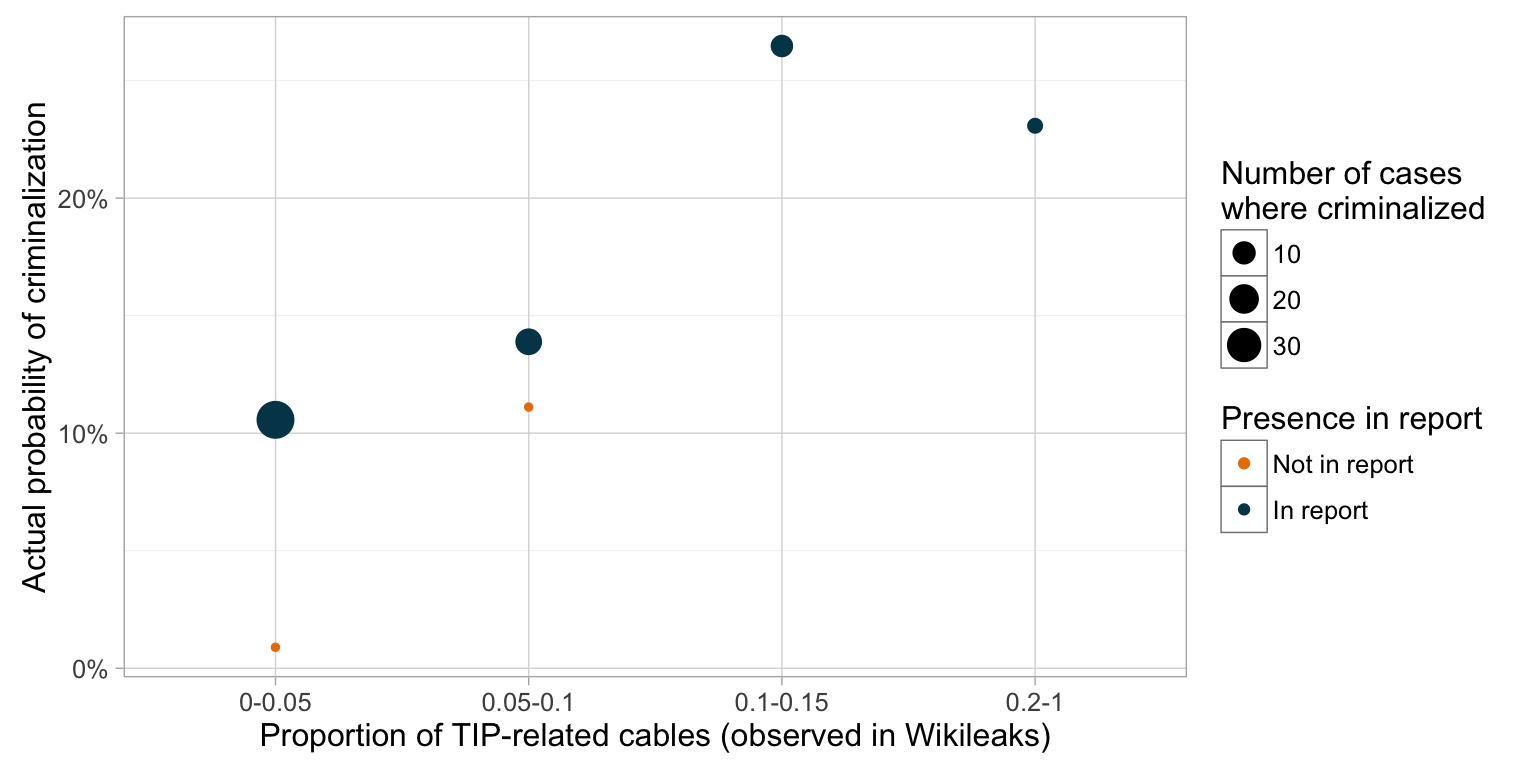
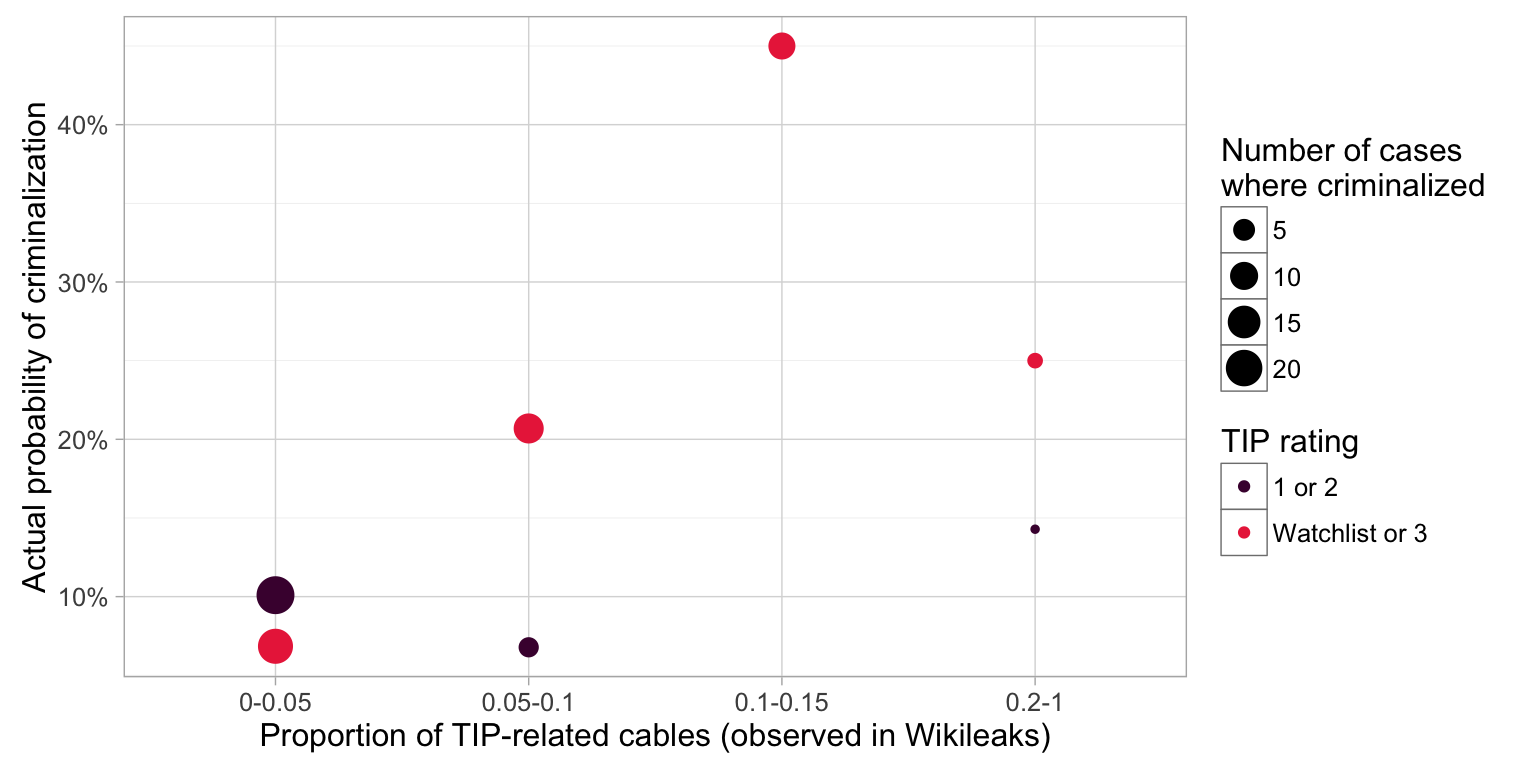
| US engagement (observed Wikileaks cables) | Increased US engagement in TIP issues in a country (as measured by TIP-related State Department cables observed in Wikileaks) at first appears to increase the probability of criminalization in the next year, but it is difficult to determine if engagement interacts with presence in the TIP report because there are so few cases of countries with observed cables that aren’t included in the report (see figure). | Statistical models again confirm that presence in the TIP report is a powerful predictor of criminalization in the next year (Model 2: z = 2.63, p = 0.008), but there is no relationship between observed US engagement and criminalization (z = -0.27, p = 0.784) or the interaction between engagement and presence in the report. This is confirmed graphically (see figure). |
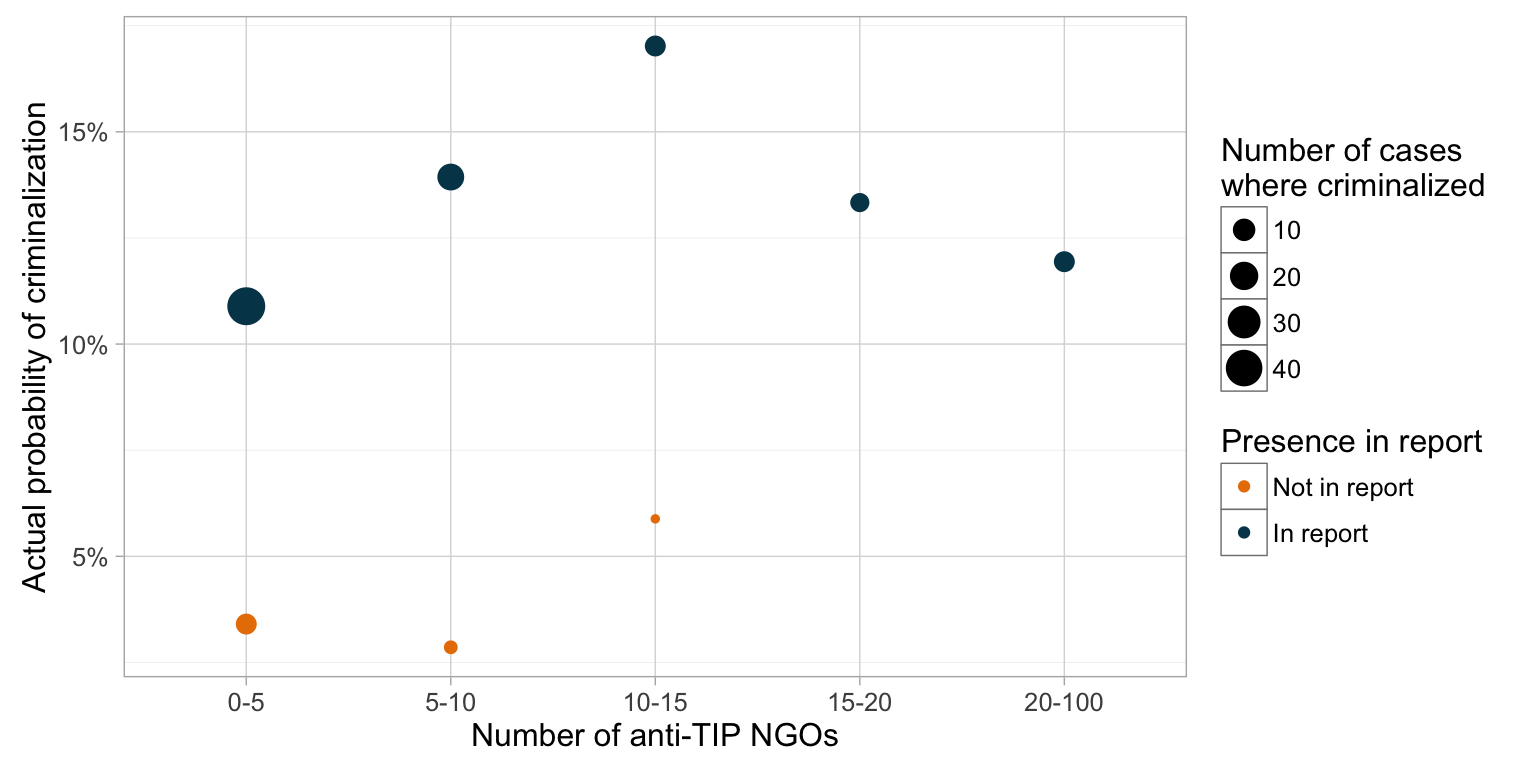
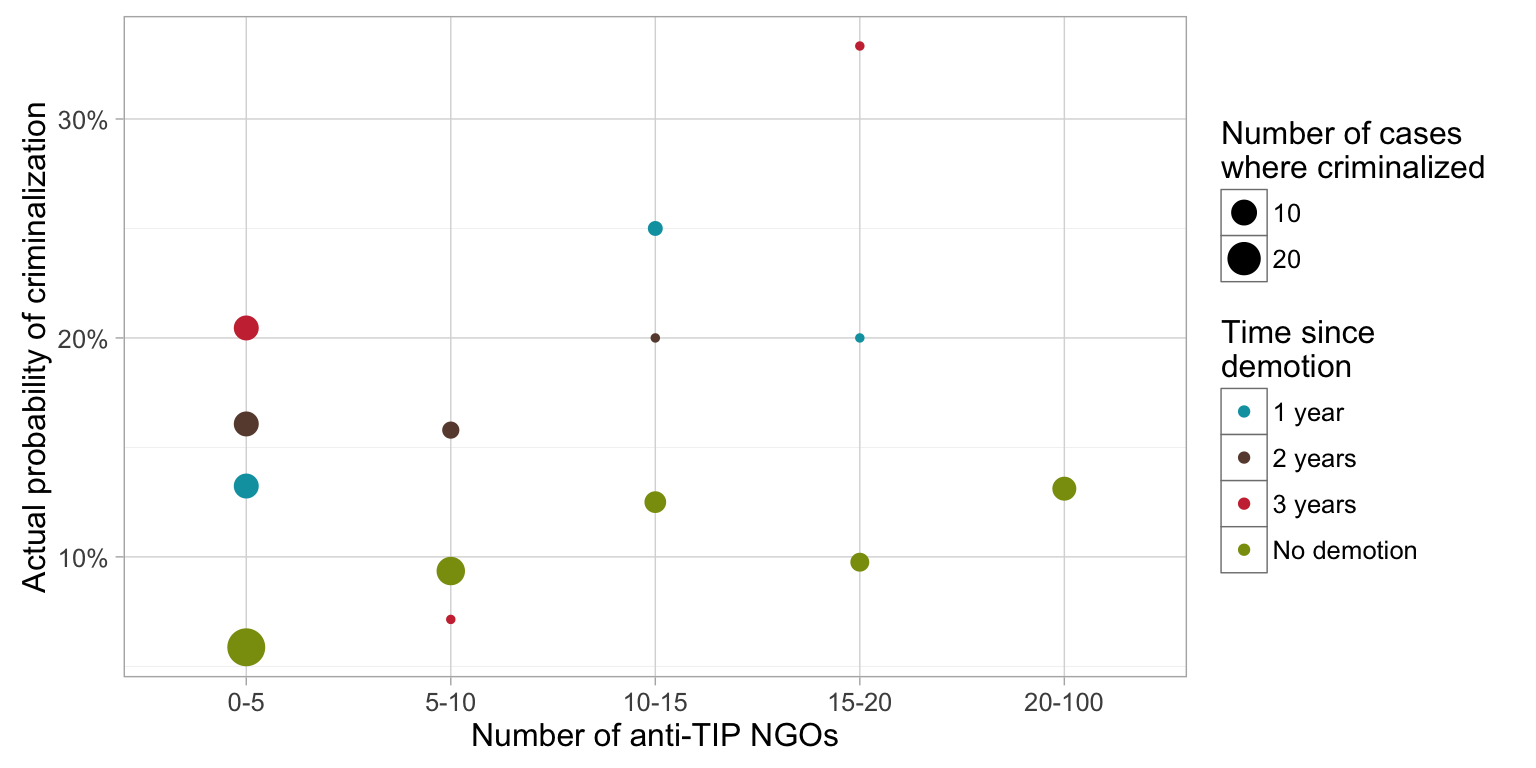
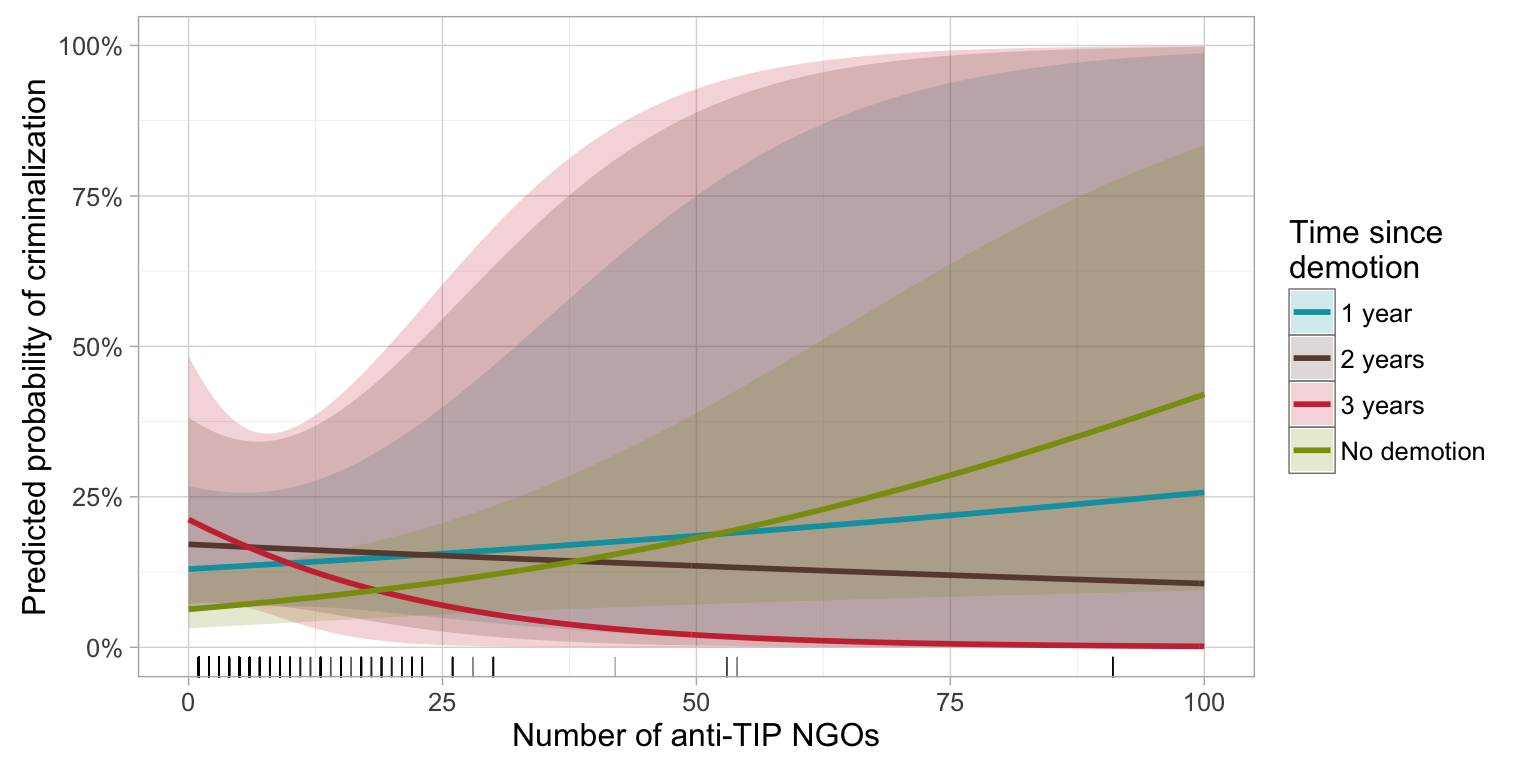
| TIP NGO count | The number of anti-TIP NGOs in a country (as measured by our own database of NGOs) descriptively appears to have an interactive effect with the TIP report on the probability of criminalization in the next year. In general, cases with more NGOs are more likely to criminalize, and cases where the country is included in the report are even more likely to do so (see figure). | Statistical models again confirm presence in the TIP report is a powerful predictor of criminalization in the next year (Model 2: z = 1.81, p = 0.071), but there is no relationship between the number of NGOs and criminalization (z = 0.00, p = 1.000) or the interaction between the number of NGOs and presence in the report. This finding may be driven by the fact that there are so few countries with high numbers of NGOs that aren’t included in the report (see the huge confidence intervals for the “not in report” predicted probabilities in the figure). |
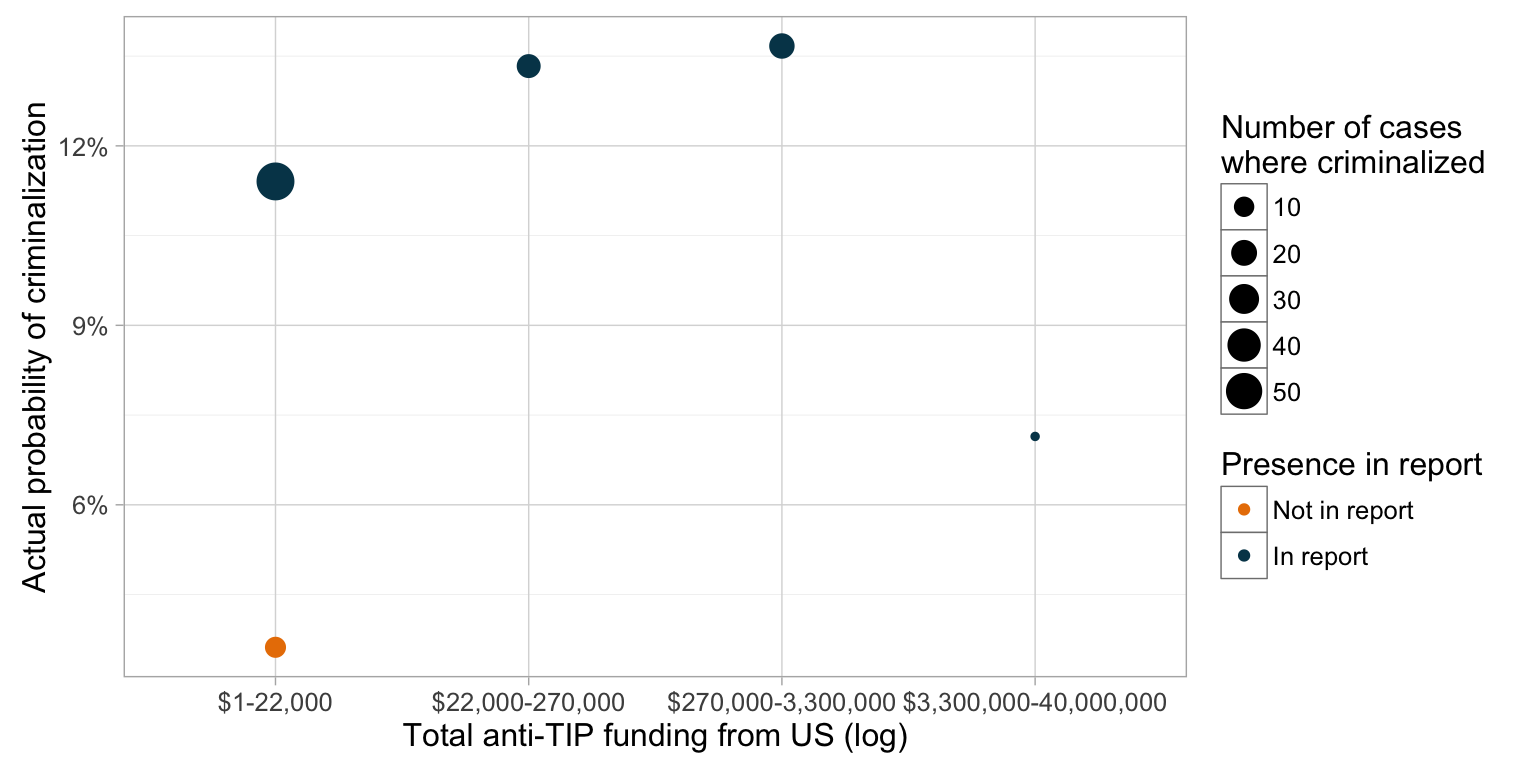
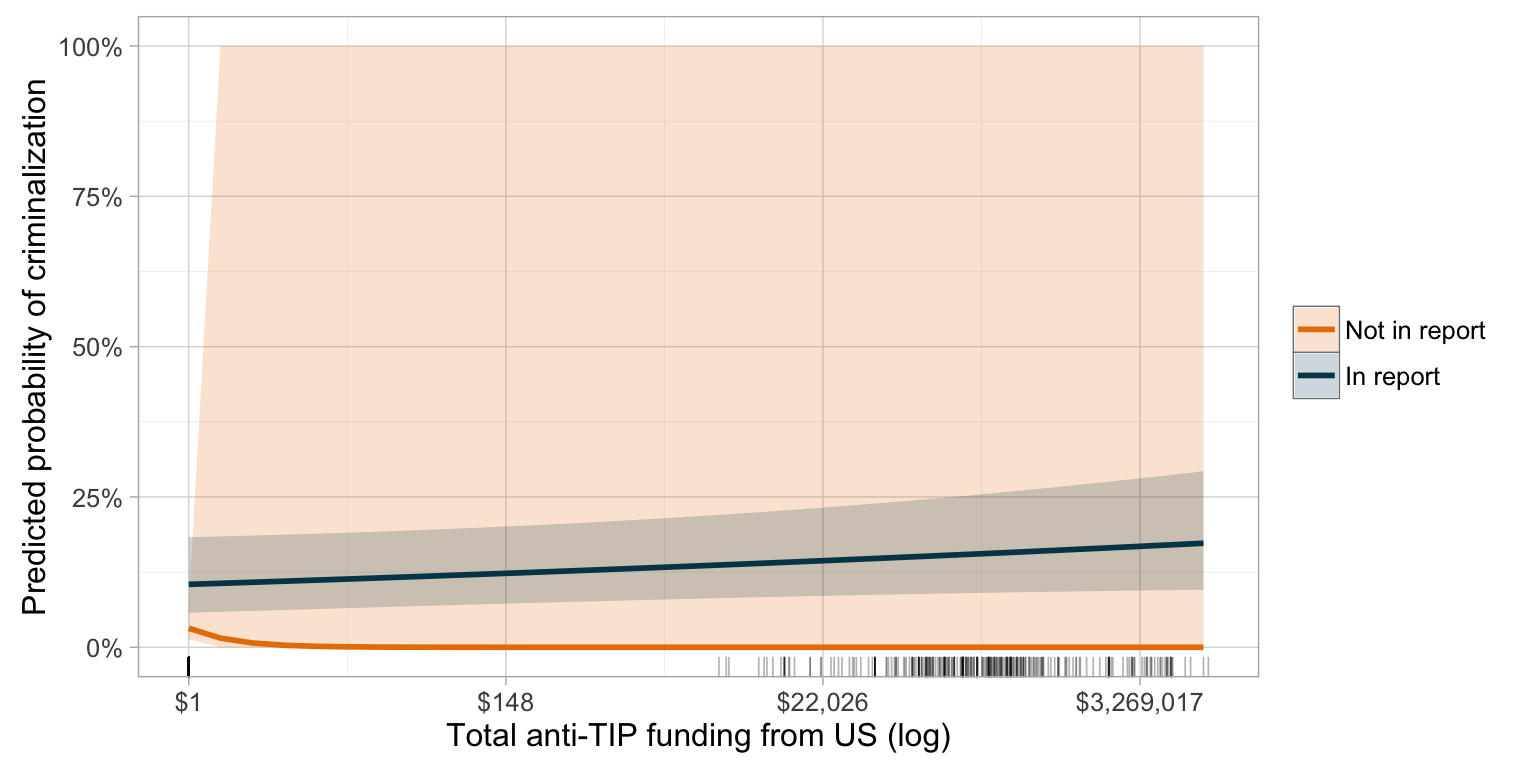
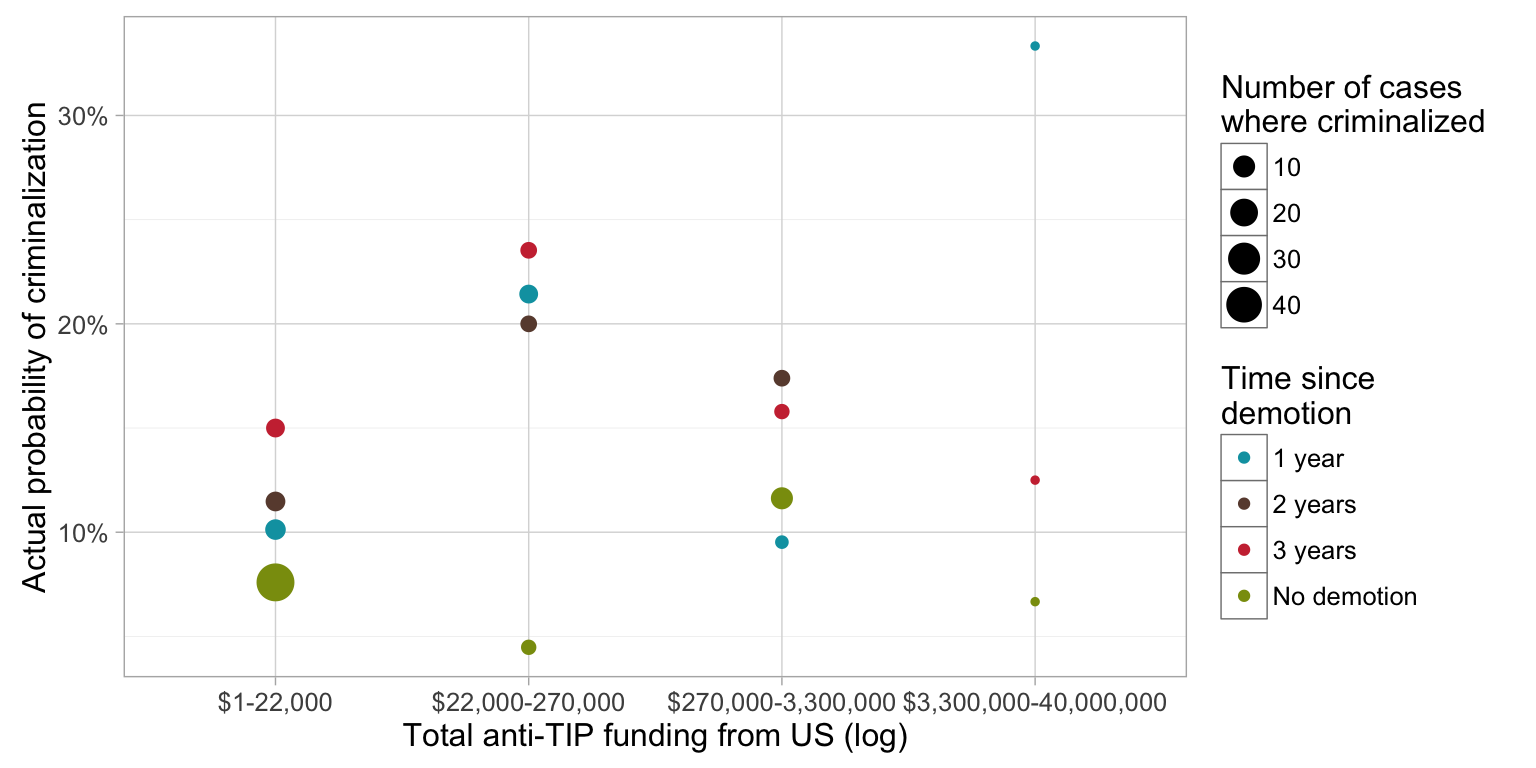
| TIP funding | Descriptively, more funding for anti-TIP endeavors appears to increase the probability of criminalization in the next year. However, determining the interaction between scorecard diplomacy and funding is difficult—no cases with substantial funding were not included in the TIP report (see figure). | When considering only funding and presence in the report, anti-TIP funding has an insignificant positive effect on the probability of criminalization in the next year (Model 1: z = 1.59, p = 0.113), while presence in the report boost that probability more that four times (Model1: z = 3.63, p < 0.001). When interacting the two variables, though, the funding effect disappears because of the instability of the interaction term (z = 0.02, p = 0.984)—the huge confidence intervals in the figure confirm this. There is no interactive relationship between the funding and presence in the report. |
4.2 Lower tier ratings
| Variable | Descriptive | Interactions |
|---|---|---|
| Democracy | Countries with better civil liberties are more likely to criminalize in the next year, and descriptively, receiving a lower tier rating (watchlist or tier 3) appears to change this probability somewhat. Assigning a lower rating to countries scoring a 1 in the Freedom House score does little to affect the probability of criminalization, but for worse values of civil liberties, countries with lower ratings are more likely to criminalize (see figure). | Statistically, however, this interactive effect is insignificant. Having worse democracy reduces the likelihood of criminalization in the next year by nearly 30% (z = -3.03, p = 0.002), and assignment to a lower tier offsets that by increasing the probability by nearly 4 times (z = 2.25, p = 0.025). The interaction between the two is positive, but not significant (z = 0.36, p = 0.721). The figure showing predicted probabilities confirms this, showing two parallel curves decreasing as civil liberties worsen. Shaming makes non-pure democracies more likely to criminalize, but does not have an effect on pure democracies. |
| NGO engagement | Descriptively, the relationship between NGO engagement, lower tier ratings, and TIP criminalization appears tenuous. The probability of criminalization in the next year increases slightly as NGOs are more engaged, but there is little apparent difference in probability in cases with lower tier ratings (see figure). | This findings hold up statistically. Assignment to a low tier is powerful predictor of criminalization in the next year (z = 3.72, p < 0.001), while NGO engagement is positively—but insignificantly—correlated with criminalization (z = 1.34, p = 0.180). The interaction between the two is insignificant and negative (z = -1.21, p = 0.225). The figure of predicted probabilities confirms this. |
| Media coverage | In general, increased media coverage of TIP issues increases the probability of criminalization in the next year, but that effect is uneven in cases with lower TIP ratings. At some levels of media coverage, cases with lower ratings are more likely to criminalize, but at others, cases with higher ratings have a higher probability of criminalization. There appears to be no interactive effect between the two variables (see figure). | Statistical models, however, do find a significant interactive effect. More media coverage has a tiny (yet significant) positive effect, increasing the probability of criminalization in the next year by 0.5% (z = 2.93, p = 0.003), and receiving a lower tier boosts that probably more than 6 times (z = 5.64, p < 0.001). The interaction between the two is significant and negative (z = -2.35, p = 0.019), but is difficult to interpret. The figure of predicted probabilities clearly demonstrates this interactive effect—combined with increased media coverage, receiving a lower rating does little to change the chance of criminalization, but cases with high media coverage and a higher TIP rating are far more likely to criminalize. |
| Foreign aid | Descriptively, it is difficult to determine the relationship between US aid, lower tier ratings, and criminalization. At extreme levels of aid, countries with higher tier ratings are more likely to criminalize in the next year, but that trend reverses with average amounts of aid, where cases with lower ratings are more likely to criminalize (see figure). | Statistical models confirm this lack of relationship. Assignment to a lower tier has an insignificant positive effect on criminalization in the next year (z = 0.76, p = 0.446), while logged aid (z = -1.39, p = 0.164) and the interaction of aid and lower ratings (z = 0.77, p = 0.441) have no explanatory power. The figure of predicted probabilities confirms this further. |
| US trade | Descriptively, there is no apparent relationship between trade and criminalization (except in outlier cases of high amounts of trade), and TIP rating has little effect on the probability of criminalization in the next year at any level of trade (see figure). | Again, statistical models confirm this finding. Assignment to the lowest tier boosts the likelihood of criminalization in the next year by more than three times (z = 3.69, p < 0.001), but trade (z = -0.77, p = 0.443) and the interaction of trade and tier assignment (z = 1.09, p = 0.275) do nothing in the model. The figure confirms this, showing a slight divergence in probabilities as trade increases. |
| 2000 protocol ratification | Descriptively, assignment to a lower rating appears to have a strong effect on the likelihood of criminalization in the next year when combined with ratifying the 2000 UN anti-TIP protocol. Cases that had not ratified the protocol and received low ratings were the least likely to criminalize, while cases that had ratified and received low ratings were the most likely (see figure). | This finding does not hold up well statistically, though. Receiving a low rating again boosts the probability of criminalization in the next year by more than three times (z = 3.22, p = 0.001), but both ratification (z = 1.14, p = 0.254) and the interaction (z = 1.03, p = 0.301) are positive and insignificant. Looking at predicted probabilities from the model reveals additional insight—lower ratings appear to increase the probability of criminalization more as countries ratify the TIP protocol, but the confidence intervals are too wide to have significance. |
| US engagement (observed Wikileaks cables) | Increased US engagement in anti-TIP discussion initially appears to have a more powerful effect on the likelihood of criminalization in the next year in cases where countries have worse tier ratings (see figure). | However, this finding is full of uncertainty and is incredibly unstable, as seen in the figure of predicted probabilities. (Another sign of this is the interaction term, which is insanely huge.) |
| TIP NGO count | Descriptively, there appears to be an inverse relationship between the number of anti-TIP NGOs, lower tier ratings, and the probability of criminalization in the next year. In cases with higher tier ratings, the likelihood of criminalization increases with more NGOs. However, in cases with lower tier ratings, that likelihood peaks when there are 10–15 NGOs and decreases dramatically with more NGOs—additional NGOs in countries with low ratings do little to improve the chance of criminalization in the next year (see figure). | This inverse relationship appears in statistical models too. In general, the probability of criminalization in the next year increases by 3% for each additional NGO (z = 2.95, p = 0.003), and assignment to the lowest tier boosts that probability by nearly six times (z = 5.17, p < 0.001), but the interaction between the two variables has a slightly negative effect (z = -2.06, p = 0.039). The figure of predicted probabilities demonstrates this visually. More NGOs decreases the likelihood of criminalization in countries receiving the lowest TIP ratings. |
| TIP funding | Descriptively, cases with low amounts of anti-TIP funding from the US and high tier ratings are more likely to criminalize in the next year. As funding increases, though, countries with low tier ratings criminalize far more often(see figure). | This inverse relationship disappears in the statistical models, though. Assignment to the lowest tier increases the chance of criminalization in the next year by more than five times (z = 4.47, p < 0.001), but there is no significant relationship between criminalization and funding (z = 1.48, p = 0.140) or the interaction of low ratings and funding (z = -0.60, p = 0.551). The parallel flat curves in the figure of predicted probabilities confirm this. |
4.3 Downgrading
| Variable | Descriptive | Interactions |
|---|---|---|
| Democracy | Receiving a demotion in TIP rating has different effects on criminalization at different levels of democracy. In the first year after a demotion, countries with better civil liberties are generally more likely to criminalize in the next year, while worse democracies are less likely to do so. However, by the third year after a demotion, that trend reverses, with worse democracies becoming more likely to criminalize (see figure). | This finding is borne out in statistical models and is very visible visually (see figure). Worse democracies are around 20–25% less likely to criminalize (Model 2: z = -2.87, p = 0.004), and TIP rating demotions have increasingly powerful effects on criminalization, boosting the likelihood by 2 times (after 1 year (z = 1.67, p = 0.095)), 2.5 times (after 2 years (z = 0.75, p = 0.451)), and 3 times (after 3 years (z = -0.89, p = 0.373)) when not interacting democracy with demotions. The interactions between democracy and demotion are negative in the first year after a demotion and positive thereafter, and significant in the third year (z = -0.76, p = 0.450). The predicted probabilities of criminalization clearly demonstrate this inverse relationship, with worse democracies most likely to criminalize the following year after the third year. |
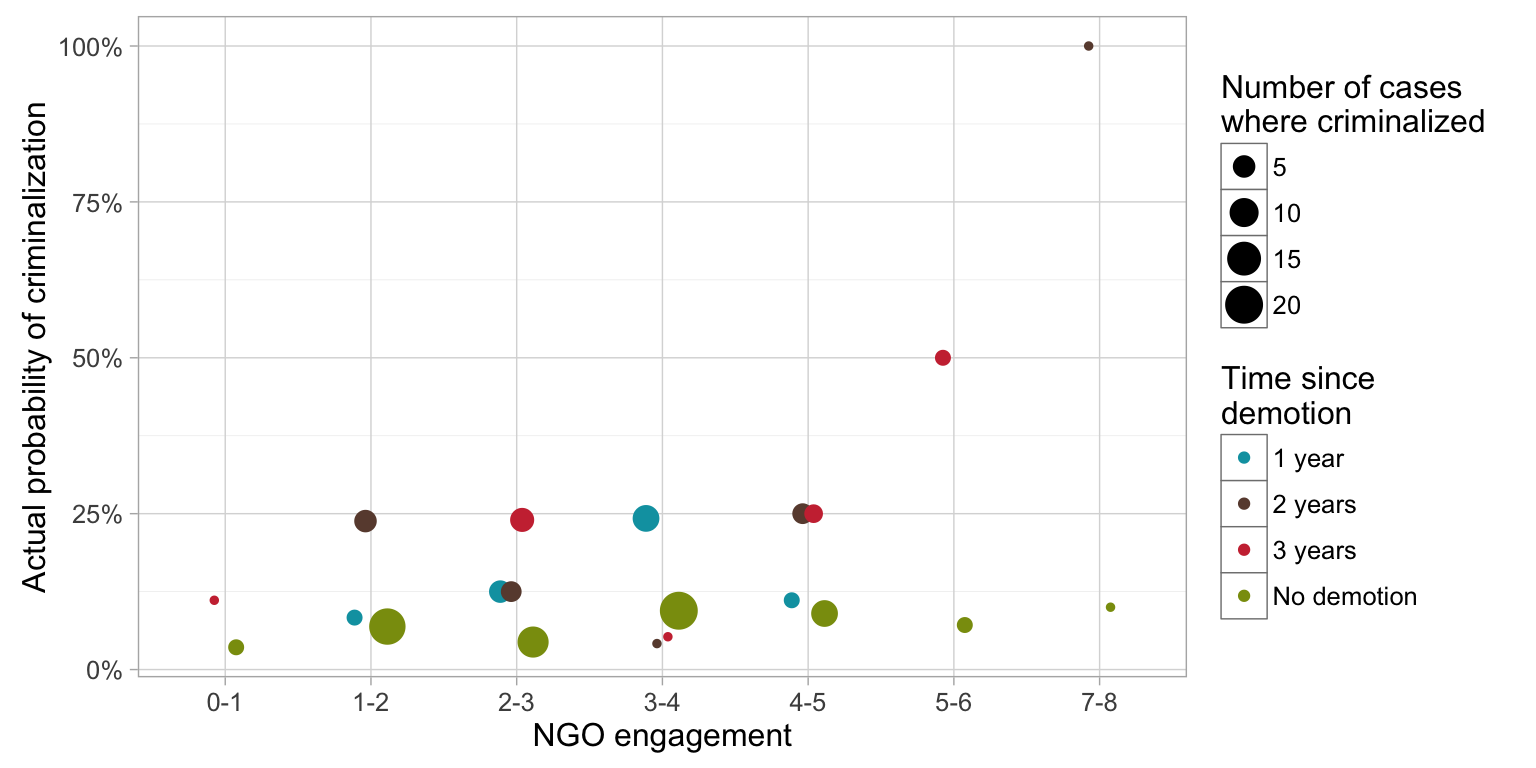
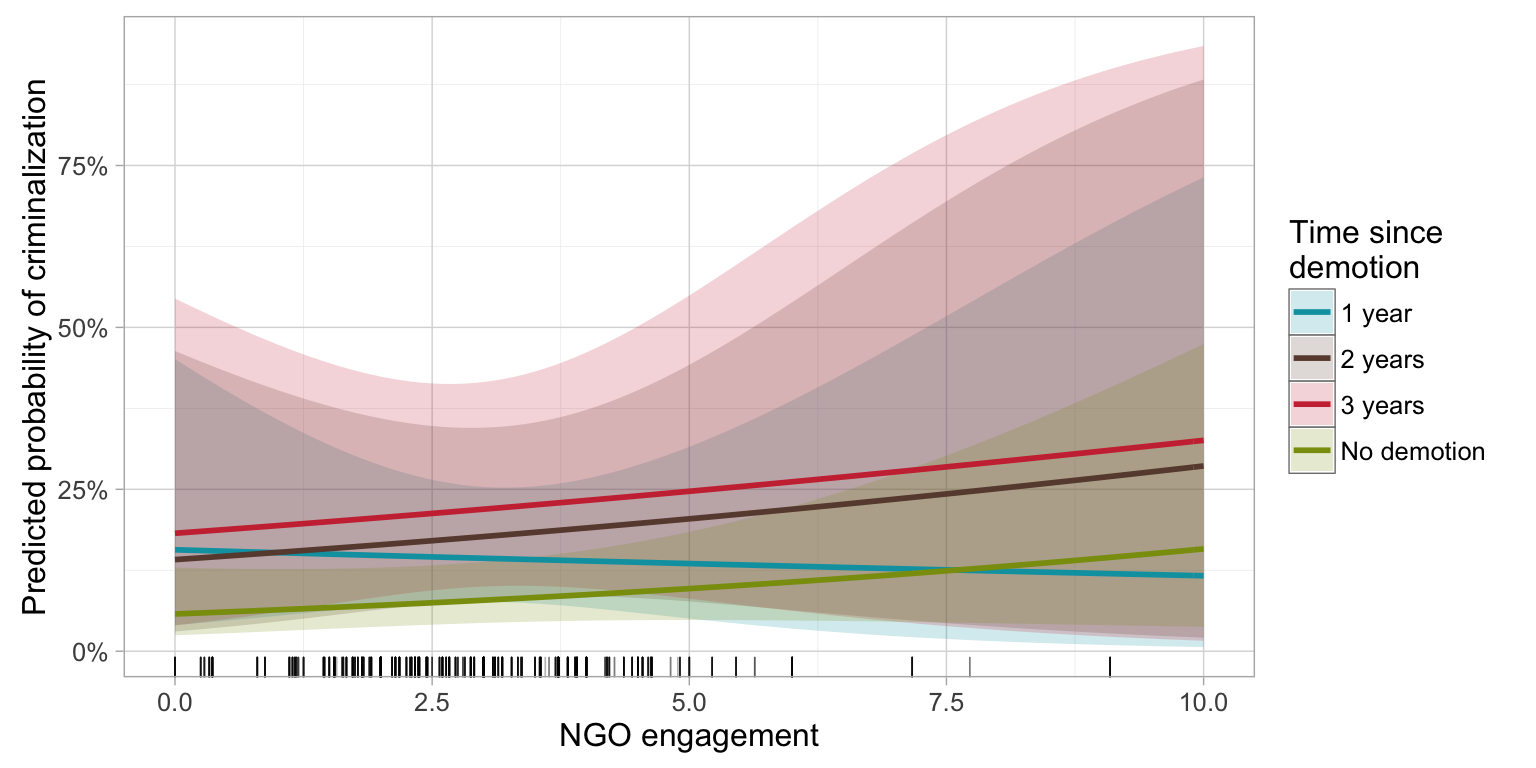
| NGO engagement | Descriptively, there is no clear relationship between demotion, NGO engagement and criminalization. The probability of criminalization in the next year does not increase with more NGO engagement, and the time since demotion does not consistently interact with more engagement (see figure). | There is no statistical relationship between these interaction terms and criminalization either. NGO engagement is not statistically significant (z = 1.06, p = 0.287), and though the coefficients for time since demotion generally follow the same order (i.e. the probability of criminalization increases as time since demotion increases), this has little substantial effect. This is apparent in the figure of predicted probabilities, which shows three nearly parallel flat curves. |
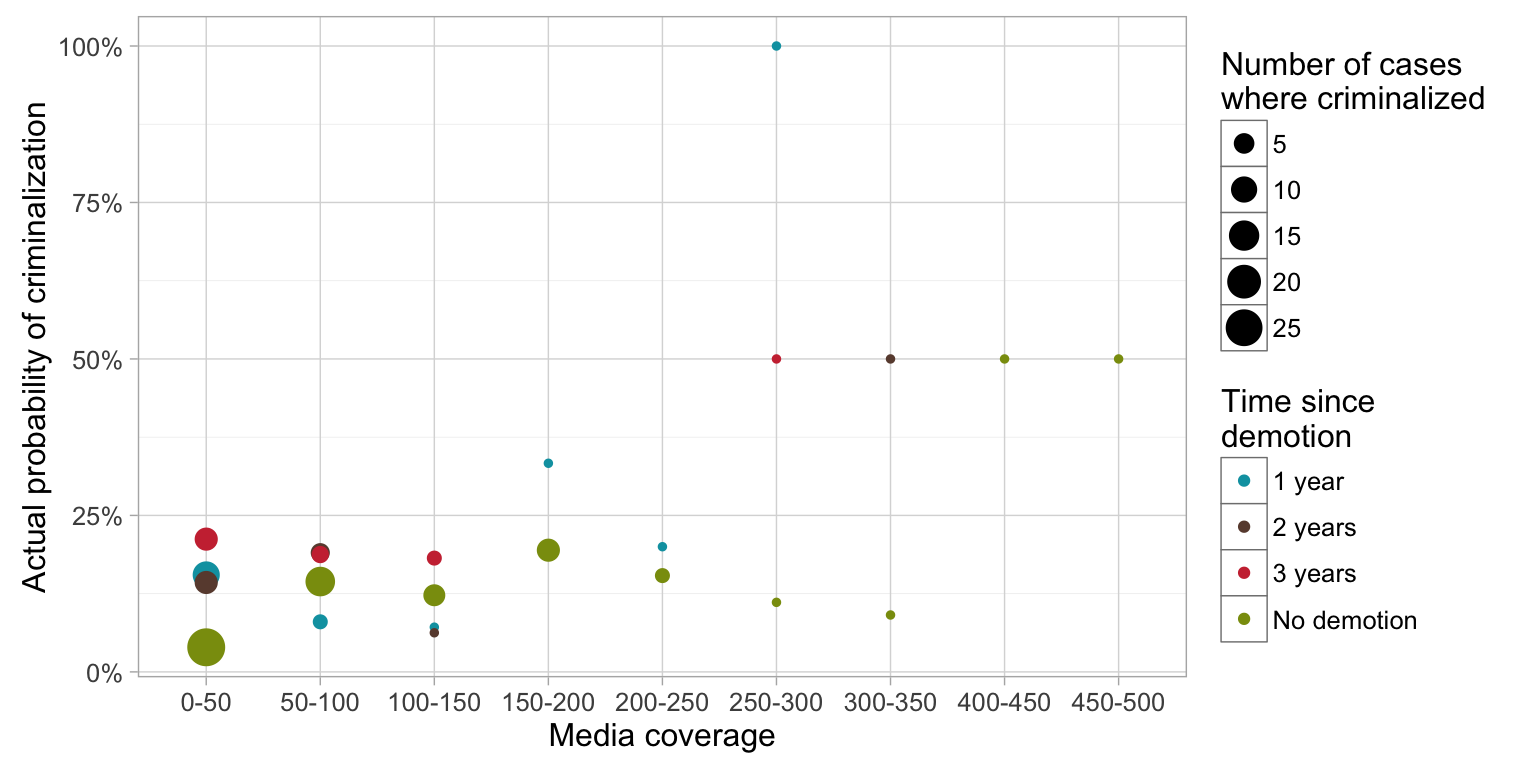
| Media coverage | In the third year after demotion, cases where media coverage is low are more likely to criminalize TIP, while cases with high media coverage are more likely to criminalize in the next year one year after demotion. Much of this effect is likely driven by outliers, though (see figure). | Statistical models confirm this finding. Increased media coverage has a marginally positive (yet significant) effect, boosting the probability of criminalization in the next year by 0.4% (z = 2.85, p = 0.004), and TIP rating demotion has an increasing and significant effect for each year since demotion (2 times after 1 year, 3 times after 2 years, nearly 5 times after 3 years). The interactions between these terms are insignificant, but indicate somewhat of a differential effect in the predicted probabilities, with cases with low media coverage three years after a demotion the most likely to criminalize. However, the huge standard errors make these models highly suspect. |
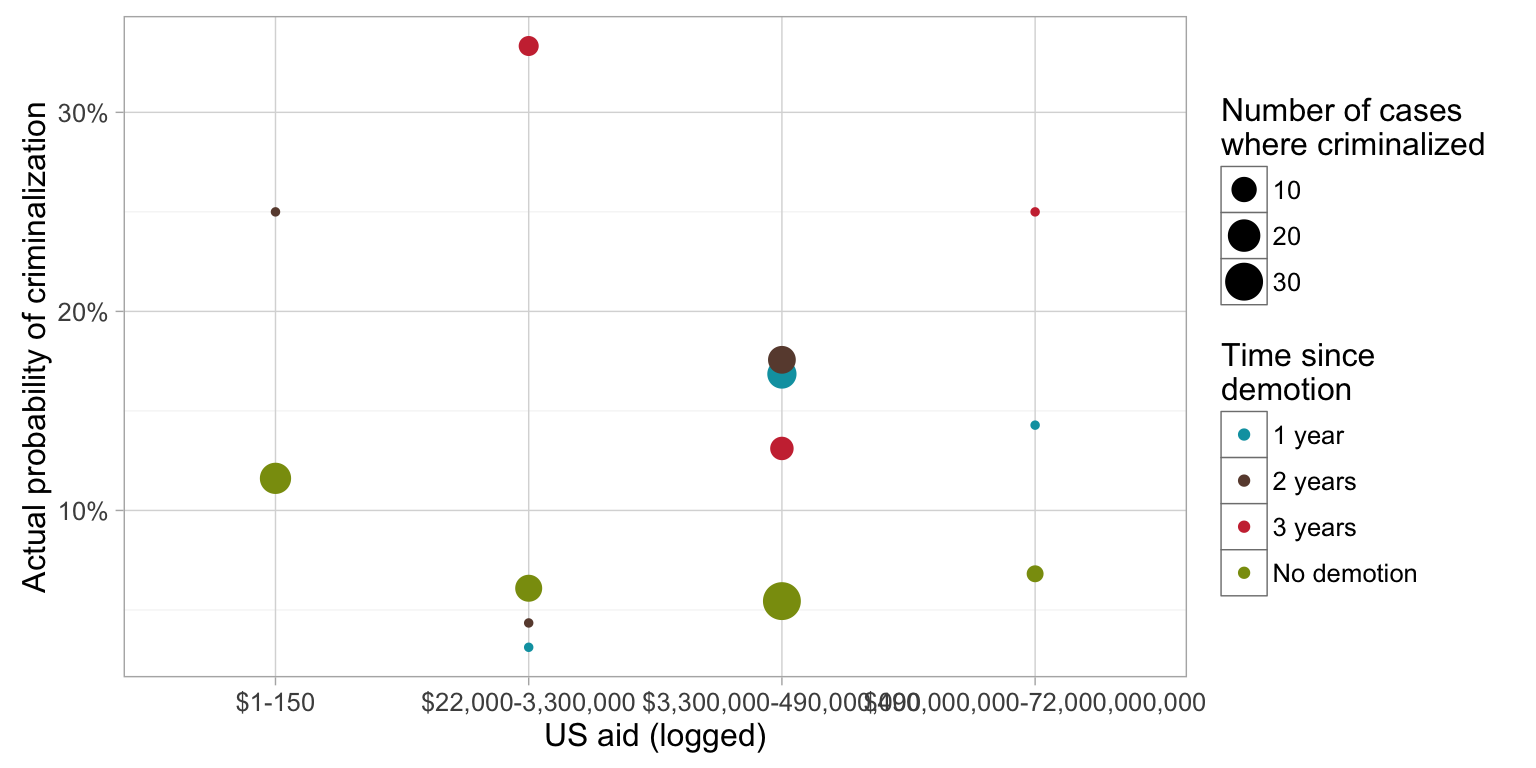
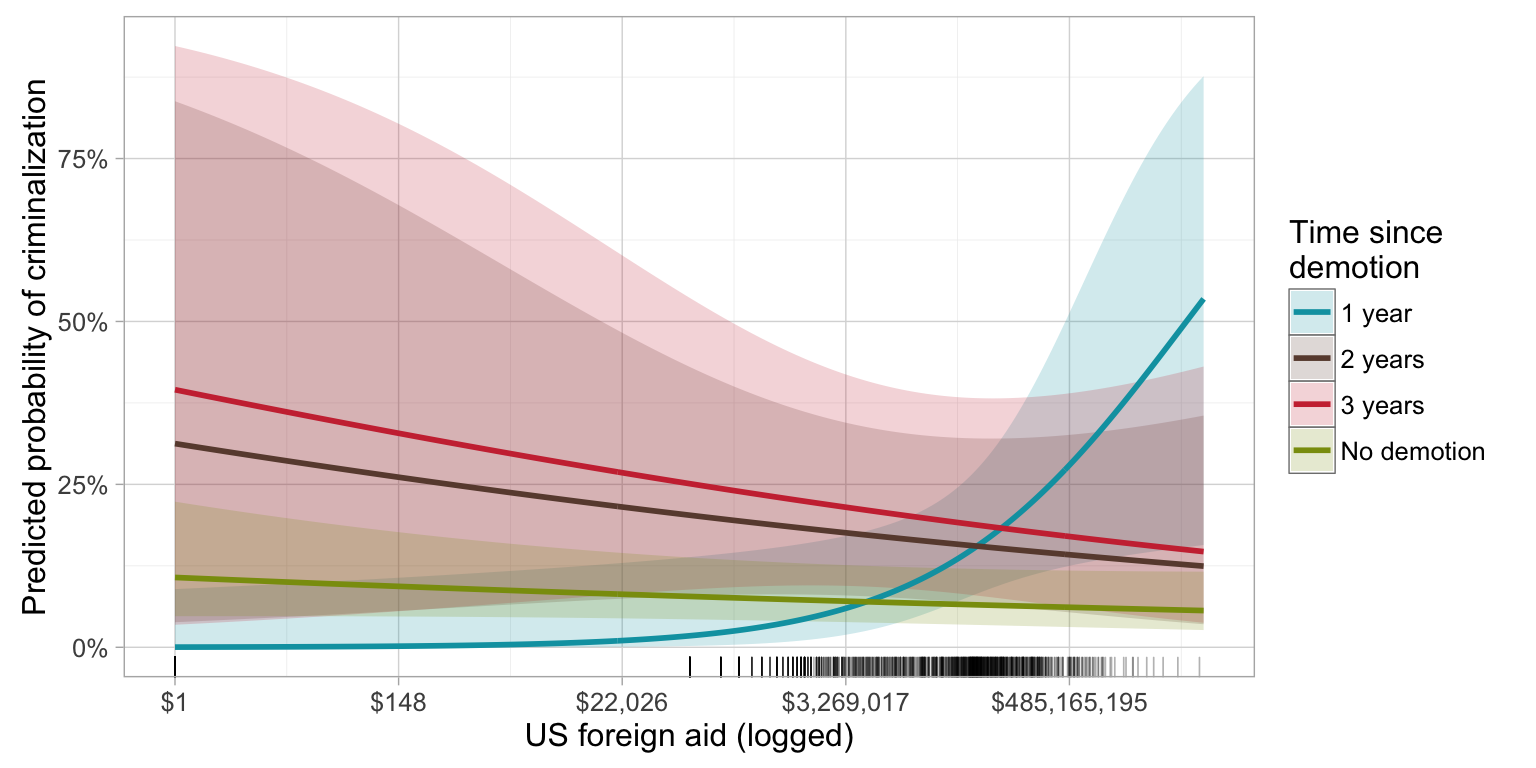
| Foreign aid | It is difficult to observe the interaction between US aid, time since demotion, and criminalization descriptively, as there appears to be no systematic relationship (see figure). | However, statistical models reveal more of the underlying relationship between the three variables. Increased US aid does not have a significant impact on the likelihood of criminalization in the next year (z = -1.27, p = 0.203), and when not interacting with aid, demotions increase the probability (2 times after 1 year, 2.5 times after 2 years, 3 times after 3 years). The interaction of aid and time since demotion is significant after only the first year (z = 2.36, p = 0.018) and is clearly visible in the predicted probabilities. Countries receiving more aid are most likely to criminalize TIP in the first year after a demotion. That is, if a country gets demoted, it is more likely to criminalize the following year if it gets lots of aid; or, the effect of demotion is more immediately potent in countries receiving lots of aid. |
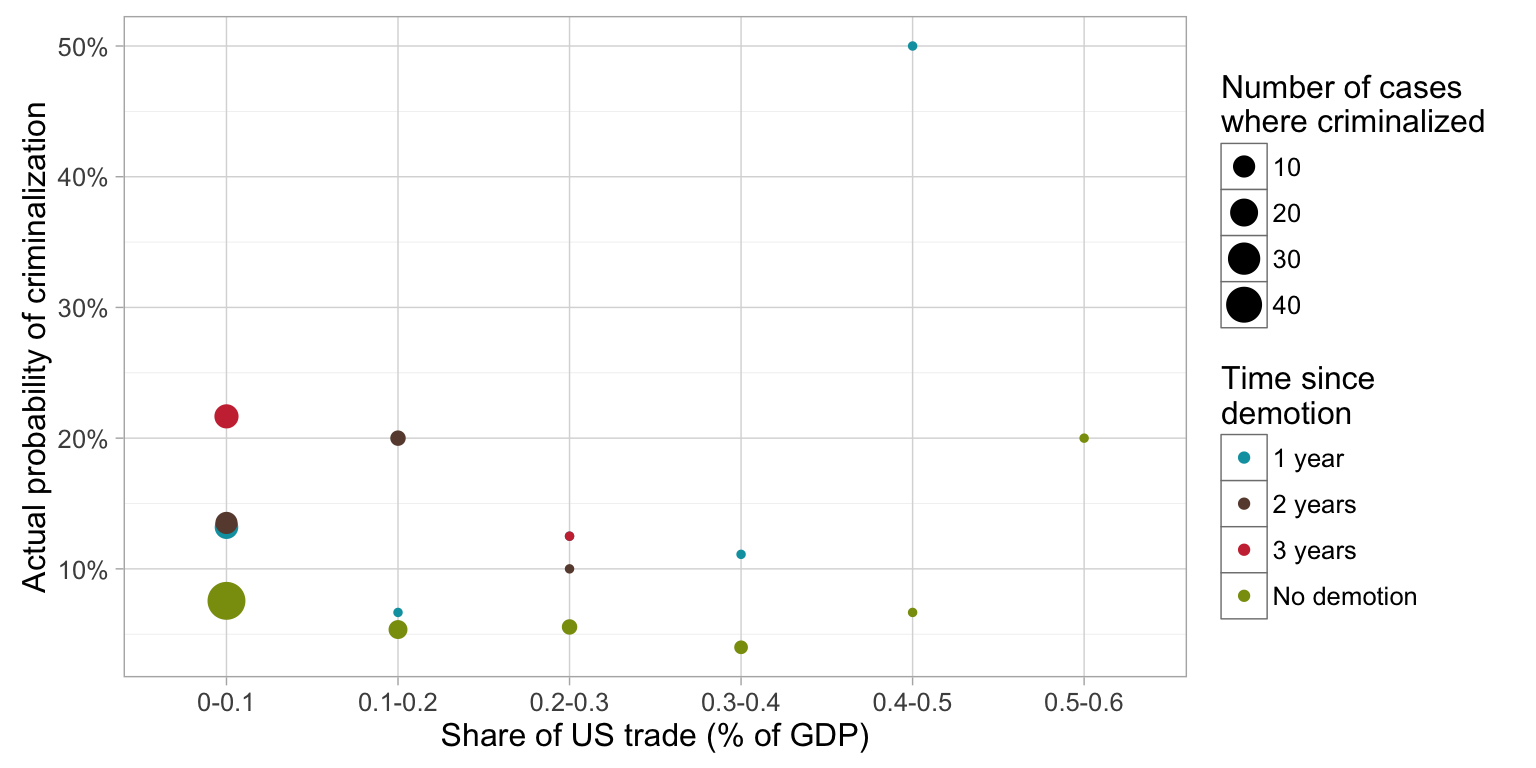
| US trade | As with aid, there is no clear relationship between trade with the US, time since demotion, and criminalization—increased trade with the US has little apparent effect on criminalization, and time since demotion does not influence that probability systematically as trade increases (see figure). | Unlike aid, there is no underlying statistical relationship between the three variables. Increased trade does not affect the probability of criminalization in the next year (z = -0.13, p = 0.894), and demotions only influence that likelihood after three years (z = 2.81, p = 0.005). No interaction terms are significant, as is visible in the predicted probabilities, which show three mostly parallel flat lines with incredibly large confidence intervals. |
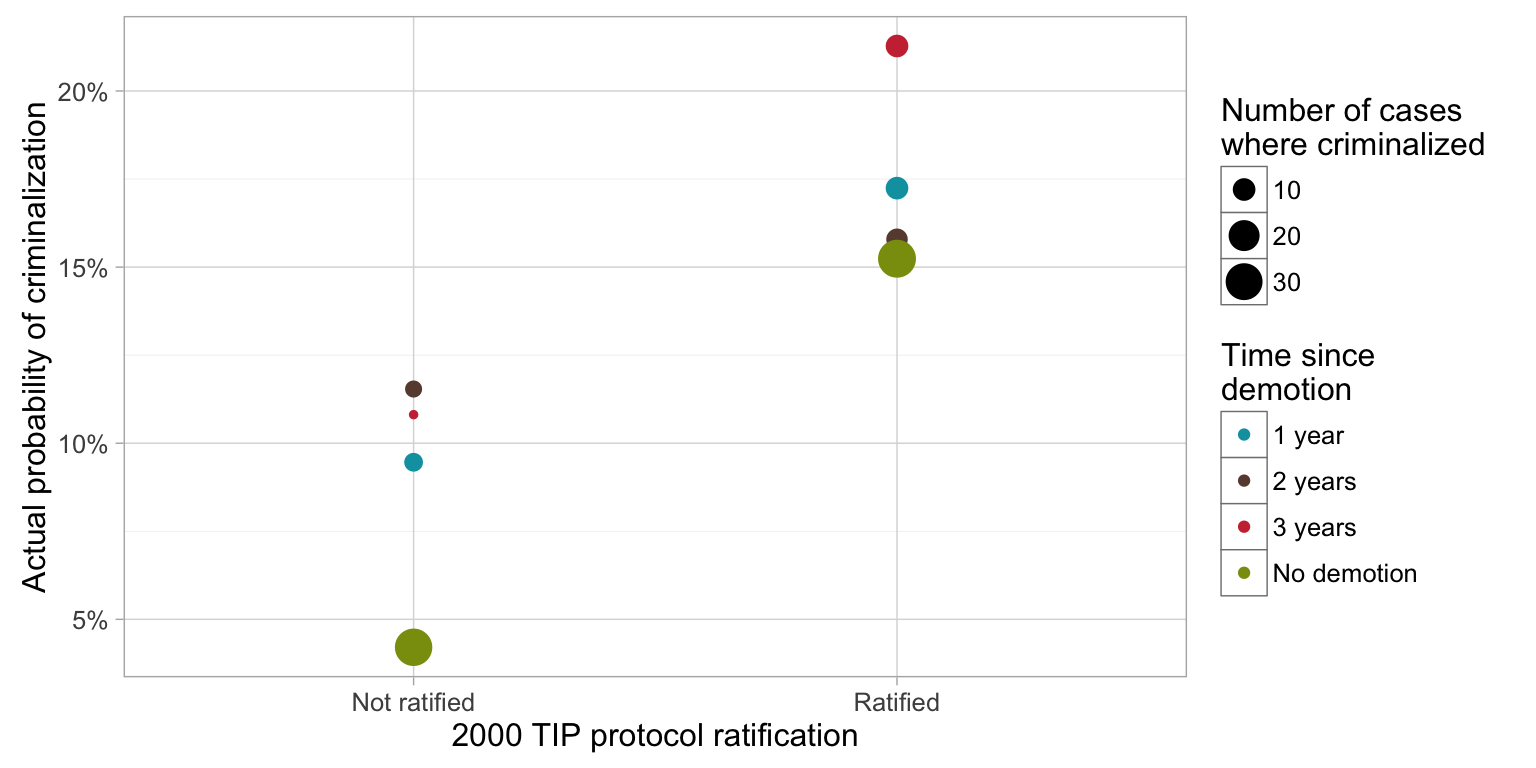
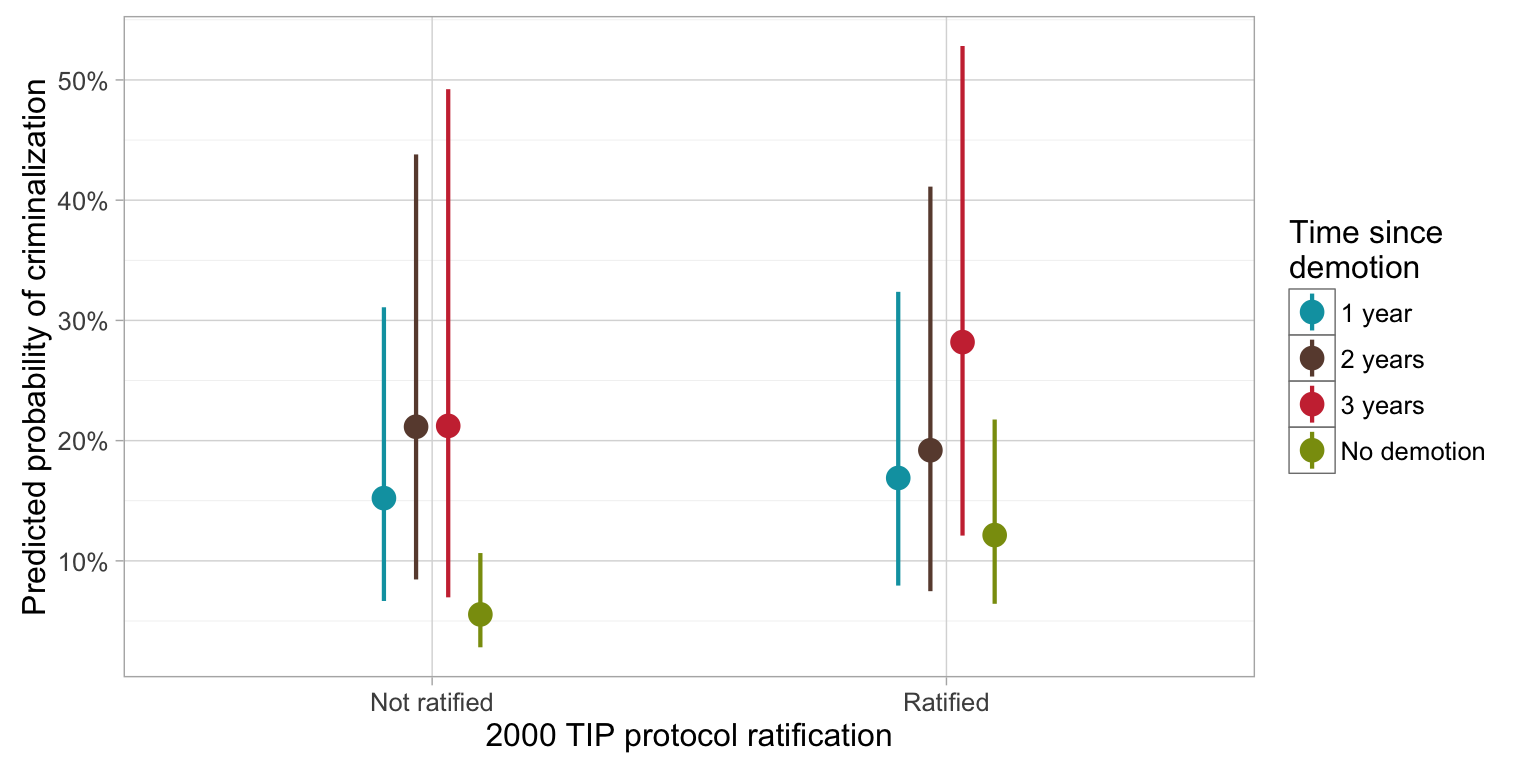
| 2000 protocol ratification | Descriptively, cases that have ratified the 2000 UN anti-TIP protocol are far more likely to criminalize TIP, regardless of tier rating demotion. Countries that have ratified the protocol are the most likely to criminalize in the next year three years after a demotion, while countries that have not ratified the protocol are more likely to criminalize two years after a demotion. It thus appears that time since demotion has some interactive effect on the likelihood of criminalization (see figure). | Statistically, however, there is no interactive relationship. Protocol ratification more than doubles the probability of criminalization in the next year (z = 2.62, p = 0.009), and demotion boosts that chance even more (3 times after 1 year, 4.5 times after 2 and 3 years), but no interaction terms are significant. This is apparent in the predicted probabilities, which show no rank reordering in the different times since demotion. |
| US engagement (observed Wikileaks cables) | Descriptively, it appears that increased US engagement in anti-TIP discussions increase the likelihood of criminalization, and this effect seems to increase faster in the second year after a TIP tier demotion (see figure). | However, this effect disappears in the statistical models because of large amounts of uncertainty. The plot of predicted probabilities shows this clearly—cases in the third year after criminalization are more likely to criminalize as US engagement increases (and less likely to do so when engagement is low), but the confidence intervals for each type of demotion yield rather useless results. |
| TIP NGO count | Again, it is difficult to see any systematic interactive relationship between the number of anti-TIP NGOs in a country, TIP tier demotion, and criminalization. In the third year after a demotion, cases with few NGOs are more likely to criminalize the following year, while cases with more NGOs are more likely to criminalize in years 1 or 2 (see figure). | The statistical model confirms this lack of relationship. The number of anti-TIP NGOs does have a small and significant effect, increasing the likelihood of criminalization in the next year by 2% (z = 2.31, p = 0.021), and time since demotion boosts that chance even more (2 times after 1 year, nearly 3 times after 2 years, and nearly 4 times after 3 years), but substantively those coefficients mean little. As seen in the predicted probabilities, the three times since demotion are statistically indistinguishable, and while there is a change in rank ordering (indicating an interactive effect), it is insignificant. |
| TIP funding | Descriptively, it appears that cases three years after receiving a TIP rating demotion are more likely to criminalize when when receiving lower amounts of anti-TIP funding from the US, possibly because it takes longer to criminalize in the absence of US assistance. Cases with more funding seem more likely to criminalize the following year after either one or two years since a demotion (see figure). | This finding does not hold up statistically, however. Though time since demotion does change the likelihood of criminalization in the next year (boosting—similar to all other models—by 2 times after 1 and 2 years and 4 times after 3 years), anti-TIP funding does not improve that probability (z = 1.48, p = 0.139). Additionally, no interaction terms are statistically significant, which is apparent in the predicted probabilities. While some changes in rank ordering of time since demotion occur as anti-TIP funding increase, none of those shifts are significantly different from each other. |