
Online appendix for “Pandemic Pass? Treaty Derogations and Human Rights Practices During COVID-19”
(Research note)
Modeling approach
We use Stan 2.34.1 (Stan Development Team 2023) through R 4.4.0 (R Core Team 2023) and {brms} 2.21.0 (Bürkner 2017) to estimate our models. We generate 4 MCMC chains for each model with 2,000 iterations in each chain, 1,000 of which are used for warmup. All chains converge; we assess convergence with visual inspection.
Complete results from all the models, along with posterior predictive checks, goodness-of-fit measures, and prediction diagnostics are all available at a companion statistical analysis compendium at https://doi.org/10.17605/OSF.IO/7GVDA.
Priors
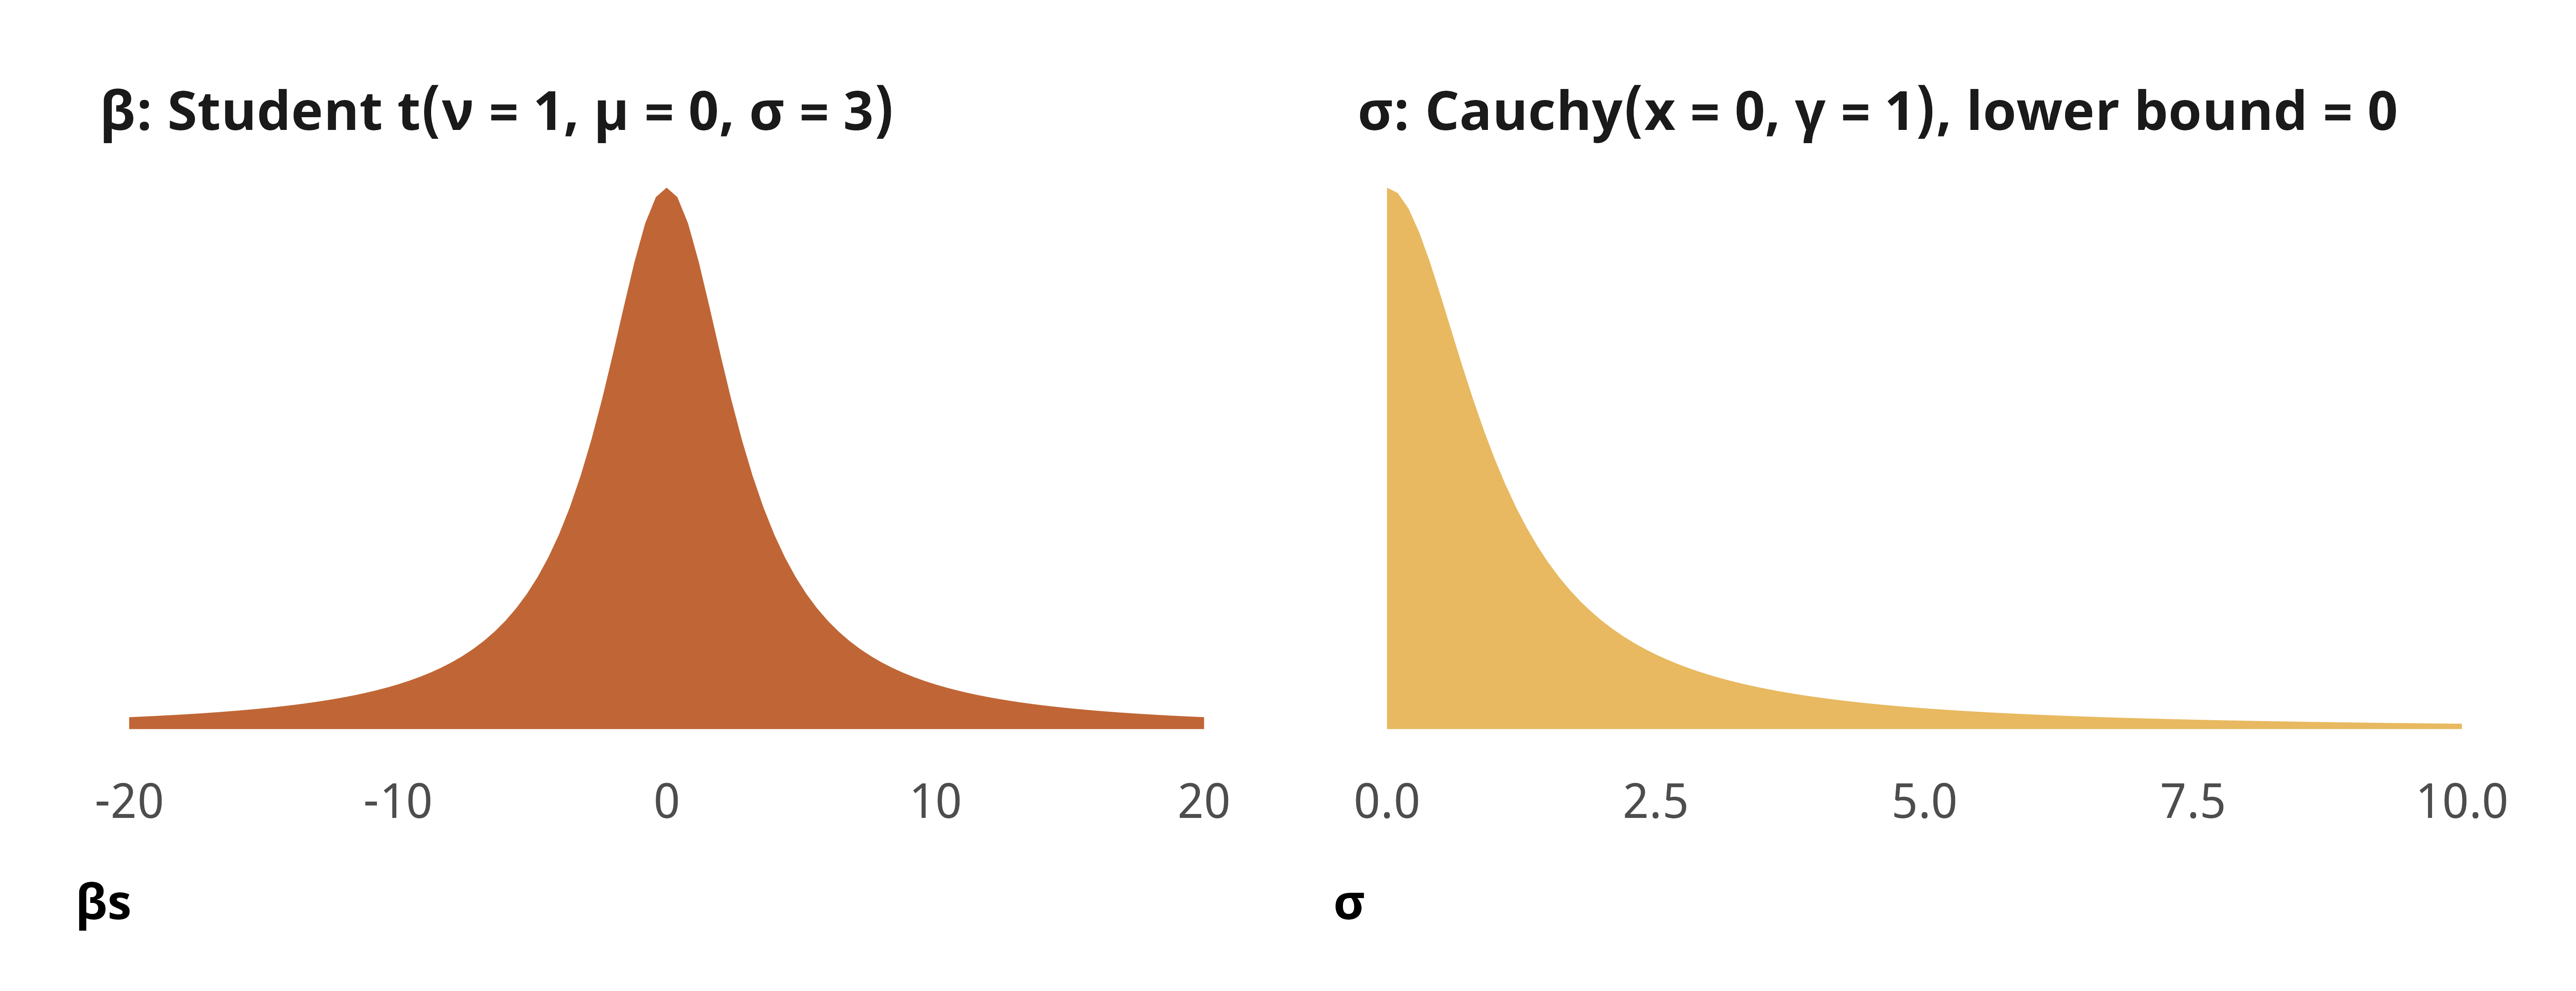
We follow the suggestion of Gelman et al. (2008) and use weakly informative priors for our logistic and ordered logistic regression models. For consistency with prior specification, and for computation efficiency, we mean-center all nonbinary variables so that parameter estimates represent changes from the mean. We use two general priors (see Figure 1):
- For all \(\beta\) terms, we use a Student t distribution with a mean of 0 and a standard deviation of 3. This keeps most parameter estimates around −5 to 5, with thicker tails that allow for some possibility of extreme values.
- For \(\sigma\) terms related to the variance or standard deviation of parameter distributions, which must be positive, we use a half Cauchy distribution, centered at 0 with a \(\gamma\) of 1
These priors give more weight to realistic areas of parameter values and downweight values in unrealistic spaces. For instance, since logit-scale coefficient values greater than 4 or 5 are highly unlikely, our Student t prior puts more weight on smaller values. Additionally, weakly informative priors allow reasonable and considerable uncertainty in possible parameter estimates.
Model definitions
H1: Logistic regression

\[ \begin{aligned} &\ \mathrlap{\textbf{Binary outcome $i$ across week $t$ within each country $j$}} \\ \text{Outcome}_{it_j} \sim&\ \operatorname{Bernoulli}(\pi_{it_j}) \\[0.75em] &\ \textbf{Distribution parameters} \\ \pi_{it_j} =&\ (\beta_0 + b_{0_j}) + \beta_1 \text{Derogation in effect}_{it} + \\ &\ \beta_2\ \text{New cases}_{it}\ + \beta_3\ \text{Cumulative cases}_{it}\ + \\ &\ \beta_4\ \text{New deaths}_{it}\ + \beta_5\ \text{Cumulative deaths}_{it}\ + \\ &\ \beta_6\ \text{Past ICCPR derogation}_{it}\ + \beta_7\ \text{Past ICCPR action}_{it}\ + \\ &\ \beta_8\ \text{Rule of law index}_{it}\ + \beta_9\ \text{Civil liberties index}_{it}\ + \\ &\ \beta_{10}\ \text{Core civil society index}_{it}\ + \beta_{11}\ \text{Week number}_{it} \\ b_{0_j} \sim&\ \mathcal{N}(0, \sigma_0) \\[0.75em] &\ \textbf{Priors} \\ \beta_{0 \dots 11} \sim&\ \operatorname{Student\ t}(\nu = 1, \mu = 0, \sigma = 3) \\ \sigma_0 \sim&\ \operatorname{Cauchy}(x = 0, \gamma = 1) \text{, lower bound} = 0 \end{aligned} \]
The actual R code for these models is included in the replication code at https://doi.org/10.17605/OSF.IO/ANONYMIZED-FOR-NOW This is a simplified representation of the {brms} (Bürkner 2017) model code:
# H1: Logistic regression for binary outcomes
brm(
  bf(outcome ~ derogation_ineffect +
      new_cases_z + cumulative_cases_z +
      new_deaths_z + cumulative_deaths_z +
      prior_iccpr_derogations + prior_iccpr_other_action +
      v2x_rule + v2x_civlib + v2xcs_ccsi +
      year_week_num + (1 | country_name)),
  family = bernoulli(),
  prior = c(
    prior(student_t(1, 0, 3), class = Intercept),
    prior(student_t(1, 0, 3), class = b),
    prior(cauchy(0, 1), class = sd, lb = 0)),
  ...
)H2: Ordered logistic regression

\[ \begin{aligned} &\ \mathrlap{\textbf{Model of outcome level $i$ across quarter $t$ within each region $j$}} \\ \text{Outcome}_{it_j} \sim&\ \operatorname{Ordered\ logit}(\phi_{it_j}, \alpha_k) \\[0.75em] &\ \textbf{Models for distribution parameters} \\ \phi_{it_j} =&\ (\beta_0 + b_{0_j}) + \beta_1 \text{Derogation in effect}_{it} + \\ &\ \beta_2\ \text{New cases}_{it}\ + \beta_3\ \text{Cumulative cases}_{it}\ + \\ &\ \beta_4\ \text{New deaths}_{it}\ + \beta_5\ \text{Cumulative deaths}_{it}\ + \\ &\ \beta_6\ \text{Past ICCPR derogation}_{it}\ + \beta_7\ \text{Past ICCPR action}_{it}\ + \\ &\ \beta_8\ \text{Rule of law index}_{it}\ + \beta_9\ \text{Civil liberties index}_{it}\ + \\ &\ \beta_{10}\ \text{Core civil society index}_{it}\ + \beta_{11}\ \text{Quarter number}_{it} \\ b_{0_j} \sim&\ \mathcal{N}(0, \sigma_0) \\[0.75em] &\ \textbf{Priors} \\ \beta_{0 \dots 11} \sim&\ \operatorname{Student\ t}(\nu = 1, \mu = 0, \sigma = 3) \\ \sigma_0 \sim&\ \operatorname{Cauchy}(x = 0, \gamma = 1) \text{, lower bound} = 0 \\ \alpha_k \sim&\ \mathcal{N}(0, 1) \end{aligned} \]
The actual R code for these models is included in the replication code at https://doi.org/10.17605/OSF.IO/ANONYMIZED-FOR-NOW This is a simplified representation of the {brms} (Bürkner 2017) model code:
# H2: Ordinal logistic regression for ordered outcomes
brm(
  bf(outcome ~ derogation_ineffect +
      new_cases_z + cumulative_cases_z +
      new_deaths_z + cumulative_deaths_z +
      prior_iccpr_derogations + prior_iccpr_other_action +
      v2x_rule + v2x_civlib + v2xcs_ccsi +
      year_quarter_num + (1 | who_region)),
  family = cumulative(),
  prior = c(
    prior(student_t(1, 0, 3), class = Intercept),
    prior(student_t(1, 0, 3), class = b),
    prior(cauchy(0, 1), class = sd, lb = 0)),
  ...
)H1: Derogations and emergency policies
Predicted probabilities and group contrasts
| Predicted probabilities | Smallest difference | Largest difference | ||||||
|---|---|---|---|---|---|---|---|---|
| Derogation | March 2020 | June 2021 | Week | \(\Delta\) | p > 0 | Week | \(\Delta\) | p > 0 |
| No | 0.98 [0.95–0.99] |
0.93 [0.82–0.97] |
2020-03-09 | 0.02 [0.01–0.05] |
1.000 | 2021-06-28 | 0.07 [0.03–0.17] |
1.000 |
| Yes | 1.00 [0.99–1.00] |
1.00 [0.98–1.00] |
||||||
| No | 0.91 [0.79–0.96] |
0.89 [0.77–0.95] |
2020-03-09 | 0.09 [0.04–0.21] |
1.000 | 2021-06-28 | 0.11 [0.05–0.23] |
1.000 |
| Yes | 1.00 [1.00–1.00] |
1.00 [1.00–1.00] |
||||||
| No | 0.49 [0.33–0.65] |
0.32 [0.20–0.48] |
2020-03-09 | 0.23 [0.15–0.32] |
1.000 | 2021-03-29 | 0.25 [0.15–0.34] |
1.000 |
| Yes | 0.73 [0.56–0.86] |
0.58 [0.39–0.76] |
||||||
| No | 0.66 [0.49–0.80] |
0.18 [0.10–0.30] |
2020-03-09 | 0.25 [0.15–0.36] |
1.000 | 2021-02-01 | 0.39 [0.28–0.49] |
1.000 |
| Yes | 0.91 [0.82–0.96] |
0.54 [0.34–0.74] |
||||||
| No | 0.99 [0.93–1.00] |
1.00 [1.00–1.00] |
2021-06-28 | 0.00 [0.00–0.00] |
0.999 | 2020-03-09 | 0.01 [0.00–0.07] |
0.999 |
| Yes | 1.00 [1.00–1.00] |
1.00 [1.00–1.00] |
||||||
Complete model results
| Cancel Public Events | Gathering Restrictions | Close Public Transit | Movement | International Travel | |
|---|---|---|---|---|---|
| Note: Estimates are median posterior log odds from ordered logistic and binary logistic regression models; 95% credible intervals (highest density posterior interval, or HDPI) in brackets. Total \(R^2\) considers the variance of both population and group effects; marginal \(R^2\) only takes population effects into account. | |||||
| Derogation in effect | 3.4 | 11 | 1.04 | 1.7 | 7.27 |
| [1.3, 5.9] | [3, 57] | [0.64, 1.45] | [1.2, 2.2] | [0.08, 40.80] | |
| New cases (standardized) | 2.19 | 8.5 | -0.68 | 0.75 | 6.41 |
| [-0.53, 5.76] | [5.8, 11.4] | [-0.88, -0.48] | [0.31, 1.25] | [-0.34, 16.49] | |
| Cumulative cases (standardized) | 3.3 | 4.7 | -0.367 | -0.18 | 1.4 |
| [1.3, 5.6] | [2.9, 6.7] | [-0.810, 0.035] | [-0.57, 0.23] | [-6.0, 13.6] | |
| New deaths (standardized) | 8.2 | 2.4 | 1.24 | 0.74 | -1.62 |
| [4.9, 11.3] | [1.1, 3.9] | [0.97, 1.54] | [0.38, 1.12] | [-3.24, -0.31] | |
| Cumulative deaths (standardized) | -0.899 | -2.7 | 0.70 | 0.17 | 6.07 |
| [-1.864, 0.089] | [-3.6, -1.8] | [0.29, 1.15] | [-0.23, 0.58] | [0.42, 11.59] | |
| Past ICCPR derogation | 0.38 | -1.29 | 0.081 | 0.16 | -1.2 |
| [-0.75, 1.63] | [-2.37, -0.19] | [-0.704, 0.837] | [-0.69, 0.93] | [-3.4, 1.0] | |
| Past ICCPR action | -0.14 | 0.17 | -0.18 | 0.072 | 0.31 |
| [-1.13, 1.00] | [-0.80, 1.10] | [-0.92, 0.56] | [-0.719, 0.812] | [-1.73, 2.47] | |
| Rule of law | 3.3 | 0.72 | -0.81 | -0.77 | -0.066 |
| [1.3, 5.5] | [-1.18, 2.38] | [-2.15, 0.54] | [-2.12, 0.63] | [-4.058, 3.360] | |
| Civil liberties | -3.99 | 1.2 | 1.1 | -0.68 | 0.87 |
| [-7.70, -0.65] | [-1.4, 4.4] | [-1.3, 3.4] | [-3.10, 1.51] | [-4.33, 7.96] | |
| Core civil society index | 0.26 | -0.022 | -0.76 | -0.57 | -1.9 |
| [-1.90, 2.75] | [-2.017, 2.149] | [-2.58, 0.87] | [-2.22, 1.00] | [-7.7, 2.2] | |
| Constant | 8.1 | 4.8 | 1.29 | 3.6 | 10.8 |
| [6.6, 9.5] | [3.7, 6.0] | [0.47, 2.02] | [2.6, 4.4] | [7.3, 15.5] | |
| Year-week | -0.021 | -0.0030 | -0.0103 | -0.032 | 0.050 |
| [-0.026, -0.015] | [-0.0079, 0.0021] | [-0.0131, -0.0073] | [-0.035, -0.029] | [0.031, 0.068] | |
| Country random effects σ | 2.4 | 2.3 | 1.8 | 1.9 | 3.9 |
| [2.0, 2.9] | [2.0, 2.7] | [1.5, 2.1] | [1.7, 2.2] | [2.6, 5.5] | |
| N | 9453 | 9522 | 8832 | 9246 | 9591 |
| \(R^2\) (total) | 0.31 | 0.41 | 0.36 | 0.40 | 0.32 |
| \(R^2\) (marginal) | 0.01 | 0.03 | 0.07 | 0.12 | 0.00 |
H2: Derogations and human rights
Predicted probabilities and group contrasts
| Predicted probabilities | Smallest difference | Largest difference | |||||||
|---|---|---|---|---|---|---|---|---|---|
| Derogation | Level | 2020-Q2 | 2021-Q2 | Week | \(\Delta\) | p > 0 | Week | \(\Delta\) | p > 0 |
| No | None | 0.87 [0.79–0.93] |
0.94 [0.89–0.97] |
2021-Q2 | 0.02 [-0.04–0.06] |
0.81600 | 2020-Q2 | 0.04 [-0.08–0.13] |
0.81600 |
| Yes | None | 0.92 [0.78–0.98] |
0.96 [0.89–0.99] |
||||||
| No | Minor | 0.06 [0.03–0.10] |
0.03 [0.01–0.05] |
2020-Q2 | -0.02 [-0.06–0.03] |
0.18400 | 2021-Q2 | -0.01 [-0.03–0.02] |
0.18400 |
| Yes | Minor | 0.04 [0.01–0.10] |
0.02 [0.00–0.06] |
||||||
| No | Moderate | 0.01 [0.01–0.02] |
0.01 [0.00–0.01] |
2020-Q2 | 0.00 [-0.01–0.01] |
0.18400 | 2021-Q2 | 0.00 [-0.01–0.00] |
0.18400 |
| Yes | Moderate | 0.01 [0.00–0.02] |
0.00 [0.00–0.01] |
||||||
| No | Major | 0.05 [0.03–0.10] |
0.02 [0.01–0.05] |
2020-Q2 | -0.02 [-0.06–0.03] |
0.18400 | 2021-Q2 | -0.01 [-0.03–0.02] |
0.18400 |
| Yes | Major | 0.03 [0.01–0.10] |
0.01 [0.00–0.05] |
||||||
| No | — | 0.03 [0.01–0.06] |
0.02 [0.01–0.04] |
2021-Q2 | 0.00 [-0.02–0.04] |
0.54075 | 2020-Q2 | 0.00 [-0.03–0.06] |
0.54075 |
| Yes | — | 0.03 [0.01–0.10] |
0.02 [0.00–0.07] |
||||||
| No | None | 0.66 [0.55–0.76] |
0.61 [0.49–0.71] |
2020-Q2 | 0.22 [0.11–0.33] |
0.99975 | 2021-Q2 | 0.25 [0.12–0.36] |
0.99975 |
| Yes | None | 0.89 [0.76–0.95] |
0.86 [0.71–0.94] |
||||||
| No | Minor | 0.02 [0.01–0.03] |
0.02 [0.01–0.03] |
2020-Q2 | -0.01 [-0.02–0.00] |
0.00025 | 2021-Q2 | -0.01 [-0.02–0.00] |
0.00025 |
| Yes | Minor | 0.01 [0.00–0.02] |
0.01 [0.00–0.02] |
||||||
| No | Moderate | 0.32 [0.23–0.43] |
0.37 [0.27–0.49] |
2021-Q2 | -0.24 [-0.35–-0.11] |
0.00025 | 2020-Q2 | -0.21 [-0.32–-0.10] |
0.00025 |
| Yes | Moderate | 0.11 [0.04–0.22] |
0.13 [0.05–0.28] |
||||||
| No | None | 0.66 [0.55–0.75] |
0.92 [0.88–0.95] |
2020-Q2 | -0.05 [-0.19–0.08] |
0.23250 | 2021-Q2 | -0.02 [-0.09–0.02] |
0.23250 |
| Yes | None | 0.60 [0.44–0.76] |
0.90 [0.81–0.95] |
||||||
| No | Minor | 0.19 [0.15–0.24] |
0.05 [0.03–0.08] |
2021-Q2 | 0.01 [-0.01–0.05] |
0.76750 | 2020-Q2 | 0.02 [-0.03–0.08] |
0.76750 |
| Yes | Minor | 0.21 [0.14–0.28] |
0.06 [0.03–0.12] |
||||||
| No | Moderate | 0.11 [0.07–0.16] |
0.02 [0.01–0.04] |
2021-Q2 | 0.01 [-0.01–0.03] |
0.76750 | 2020-Q2 | 0.02 [-0.03–0.08] |
0.76750 |
| Yes | Moderate | 0.13 [0.07–0.21] |
0.03 [0.01–0.06] |
||||||
| No | Major | 0.04 [0.02–0.06] |
0.01 [0.00–0.01] |
2021-Q2 | 0.00 [0.00–0.01] |
0.76750 | 2020-Q2 | 0.01 [-0.01–0.05] |
0.76750 |
| Yes | Major | 0.05 [0.02–0.10] |
0.01 [0.00–0.02] |
||||||
Complete model results
| Discriminatory Policy | Non-Derogable Rights | No Time Limit Measures | Abusive Enforcement | |
|---|---|---|---|---|
| Note: Estimates are median posterior log odds from ordered logistic and binary logistic regression models; 95% credible intervals (highest density posterior interval, or HDPI) in brackets. Total \(R^2\) considers the variance of both population and group effects; marginal \(R^2\) only takes population effects into account. | ||||
| Derogation in effect | -0.49 | 0.066 | -1.4 | 0.22 |
| [-1.73, 0.59] | [-1.262, 1.174] | [-2.3, -0.6] | [-0.37, 0.76] | |
| New cases (standardized) | 0.26 | 0.051 | -0.12 | 0.028 |
| [-0.49, 1.09] | [-1.596, 1.614] | [-0.98, 0.69] | [-0.510, 0.640] | |
| Cumulative cases (standardized) | -0.11 | -0.11 | -0.49 | 0.17 |
| [-1.04, 0.98] | [-2.04, 1.78] | [-1.43, 0.40] | [-0.51, 0.95] | |
| New deaths (standardized) | -0.27 | -0.056 | 0.089 | 0.21 |
| [-1.16, 0.54] | [-1.223, 1.151] | [-0.526, 0.639] | [-0.33, 0.81] | |
| Cumulative deaths (standardized) | 0.12 | -0.42 | 0.26 | -0.29 |
| [-0.91, 1.13] | [-2.16, 0.94] | [-0.44, 0.99] | [-1.03, 0.39] | |
| Past ICCPR derogation | 0.95 | 0.36 | 0.13 | 0.457 |
| [0.41, 1.53] | [-0.42, 1.07] | [-0.32, 0.56] | [0.064, 0.852] | |
| Past ICCPR action | 0.27 | 1.38 | -0.53 | 0.04 |
| [-0.27, 0.75] | [0.77, 2.01] | [-0.99, -0.12] | [-0.35, 0.42] | |
| Rule of law | 1.04 | 0.88 | 0.72 | -0.75 |
| [-0.26, 2.38] | [-0.84, 2.59] | [-0.26, 1.67] | [-1.66, 0.14] | |
| Civil liberties | 1.2 | -3.93 | -1.39 | 0.24 |
| [-1.1, 3.7] | [-7.15, -0.89] | [-3.37, 0.46] | [-1.56, 2.01] | |
| Core civil society index | -2.24 | 0.6 | -0.28 | -0.3 |
| [-3.92, -0.73] | [-1.5, 2.8] | [-1.57, 1.08] | [-1.6, 1.0] | |
| Constant | -1.33 | |||
| [-2.59, -0.17] | ||||
| Cut 1 | 1.26 | 0.54 | -0.71 | |
| [-0.25, 2.75] | [-0.50, 1.48] | [-1.53, 0.05] | ||
| Cut 2 | 1.98 | 0.62 | 0.38 | |
| [0.46, 3.50] | [-0.43, 1.54] | [-0.41, 1.15] | ||
| Cut 3 | 2.20 | 1.9 | ||
| [0.52, 3.55] | [1.0, 2.7] | |||
| Region random effects σ | 1.30 | 0.71 | 0.83 | 0.57 |
| [0.58, 2.60] | [0.17, 1.62] | [0.34, 1.67] | [0.23, 1.17] | |
| N | 834 | 834 | 834 | 834 |
| \(R^2\) (total) | 0.15 | 0.11 | 0.07 | 0.15 |
| \(R^2\) (marginal) | 0.08 | 0.08 | 0.04 | 0.10 |
| AFRO: Regional Office for Africa |
| Algeria, Angola, Benin, Botswana, Burkina Faso, Burundi, Cape Verde, Cameroon, Central African Republic, Chad, Comoros, Congo - Brazzaville, Côte d’Ivoire, Congo - Kinshasa, Equatorial Guinea, Eritrea, Eswatini, Ethiopia, Gabon, Gambia, Ghana, Guinea, Guinea-Bissau, Kenya, Lesotho, Liberia, Madagascar, Malawi, Mali, Mauritania, Mauritius, Mozambique, Namibia, Niger, Nigeria, Rwanda, St. Helena, São Tomé & Príncipe, Senegal, Seychelles, Sierra Leone, South Africa, South Sudan, Togo, Uganda, Tanzania, Zambia, and Zimbabwe |
| AMRO: Regional Office for the Americas |
| Anguilla, Antigua & Barbuda, Argentina, Aruba, Bahamas, Barbados, Belize, Bermuda, Bolivia, Brazil, British Virgin Islands, Canada, Cayman Islands, Chile, Colombia, Costa Rica, Cuba, Curaçao, Dominica, Dominican Republic, Ecuador, El Salvador, French Guiana, Grenada, Guatemala, Guyana, Haiti, Honduras, Jamaica, Mexico, Nicaragua, Panama, Paraguay, Peru, St. Barthélemy, St. Kitts & Nevis, St. Lucia, Saint Martin (French part), St. Vincent & Grenadines, Sint Maarten, Suriname, Trinidad & Tobago, Turks & Caicos Islands, United States, Uruguay, and Venezuela |
| EMRO: Regional Office for the Eastern Mediterranean |
| Afghanistan, Bahrain, Djibouti, Egypt, Iran, Iraq, Jordan, Kuwait, Lebanon, Libya, Morocco, Palestinian Territories, Oman, Pakistan, Qatar, Saudi Arabia, Somalia, Sudan, Syria, Tunisia, United Arab Emirates, and Yemen |
| EURO: Regional Office for Europe |
| Albania, Andorra, Armenia, Austria, Azerbaijan, Belarus, Belgium, Bosnia & Herzegovina, Bulgaria, Croatia, Cyprus, Czechia, Denmark, Estonia, Finland, France, Georgia, Germany, Greece, Hungary, Iceland, Ireland, Israel, Italy, Kazakhstan, Kosovo, Kyrgyzstan, Latvia, Liechtenstein, Lithuania, Luxembourg, Malta, Monaco, Montenegro, Netherlands, North Macedonia, Norway, Poland, Portugal, Moldova, Romania, Russia, San Marino, Serbia, Slovakia, Slovenia, Spain, Sweden, Switzerland, Tajikistan, United Kingdom, Türkiye, Turkmenistan, Ukraine, and Uzbekistan |
| SEARO: Regional Office for South-East Asia |
| Bangladesh, Bhutan, North Korea, India, Indonesia, Maldives, Myanmar (Burma), Nepal, Sri Lanka, Thailand, and Timor-Leste |
| WPRO: Regional Office for the Western Pacific |
| American Samoa, Australia, Brunei, Cambodia, China, Cook Islands, Fiji, French Polynesia, Japan, Kiribati, Laos, Malaysia, Marshall Islands, Micronesia (Federated States of), Mongolia, Nauru, New Zealand, Palau, Papua New Guinea, Philippines, South Korea, Samoa, Singapore, Solomon Islands, Tonga, Tuvalu, Vanuatu, and Vietnam |
| States that derogated from the ACHR | Also submitted ICCPR derogation | States that derogated from the ECHR | Also submitted ICCPR derogation |
|---|---|---|---|
| ACHR = American Convention on Human Rights; ECHR = European Convention on Human Rights | |||
| Argentina | Yes | Albania | No |
| Bolivia | No | Armenia | Yes |
| Chile | Yes | Azerbaijan | Yes |
| Colombia | Yes | Estonia | Yes |
| Dominican Republic | Yes | Georgia | Yes |
| Ecuador | Yes | Latvia | Yes |
| El Salvador | Yes | Moldova | Yes |
| Guatemala | Yes | North Macedonia | No |
| Honduras | No | Romania | Yes |
| Jamaica | No | San Marino | Yes |
| Panama | No | Serbia | No |
| Paraguay | Yes | ||
| Peru | Yes | ||
| Suriname | No | ||
| Venezuela | No | ||
| Model 1 | Model 2 | |
|---|---|---|
| Dependent variable = derogation submission | ||
| Logistic regression models; odds ratios (standard error) | ||
| * p < 0.1, ** p < 0.05, *** p < 0.01 | ||
| Intercept | 0.00217 (0.00093)*** | 0.0044 (0.0021)*** |
| Pandemic backsliding (PanBack) | 7.1 (6.5)** | |
| Pandemic violations of democratic standards (PanDem) | 0.29 (0.29) | |
| New cases (standardized) | 0.33 (0.40) | 0.42 (0.51) |
| New deaths (standardized) | 1.66 (0.44)* | 1.64 (0.43)* |
| Cumulative cases (standardized) | 0.015 (0.033)* | 0.0067 (0.0152)** |
| Cumulative deaths (standardized) | 3.6 (1.7)*** | 4.3 (2.1)*** |
| Rule of law index | 1.99 (0.87) | 1.27 (0.58) |
| N | 9591 | 9591 |
References
Bürkner, Paul-Christian. 2017. “brms: An R Package for Bayesian Multilevel Models Using Stan.” Journal of Statistical Software 80 (1): 1–28. https://doi.org/10.18637/jss.v080.i01.
Chaudhry, Suparna, Audrey L. Comstock, and Andrew Heiss. 2024. “Derogations, Democratic Backsliding, and International Human Rights During the COVID-19 Pandemic.” Working paper. https://doi.org/10.31235/osf.io/g3z6n.
Gelman, Andrew, Aleks Jakulin, Maria Grazia Pittau, and Yu-Sung Su. 2008. “A Weakly Informative Default Prior Distribution for Logistic and Other Regression Models.” The Annals of Applied Statistics 2 (4). https://doi.org/10.1214/08-AOAS191.
R Core Team. 2023. “R: A Language and Environment for Statistical Computing.” Vienna, Austria: R Foundation for Statistical Computing. https://www.r-project.org/.
Stan Development Team. 2023. “Stan Modeling Language Users Guide and Reference Manual.” Manual. http://mc-stan.org.