Analysis
Meredith Conroy and Andrew Heiss
December 28, 2017
knitr::opts_chunk$set(cache=FALSE, fig.retina=2,
                      tidy.opts=list(width.cutoff=120),  # For code
options(width=120)) # For outputlibrary(tidyverse)
library(haven)
library(stargazer)
library(xtable)
library(DT)
library(broom)
library(ggstance)
library(forcats)
library(stringr)
library(psych)
library(here)
source(file.path(here(), "Analysis", "graphics.R"))
stargazer2word <- FALSE
unlabelled <- function(x) {
if (!haven:::is.labelled(x))
return(x)
attributes(x) <- NULL
x
}df.raw <- read_sav(file.path(here(), "Data", "personality 2016.sav")) %>%
mutate_all(funs(unlabelled(.))) %>%
mutate(KKKFrame_CivLibs.factor = factor(KKKFrame_CivLibs, levels=0:1,
labels=c("Public safety frame",
"Civil liberties frame")),
GunFrame_CivLibs.factor = factor(GunFrame_CivLibs, levels=0:1,
labels=c("Public safety frame",
"Civil liberties frame"))) %>%
mutate(sex = factor(PPGENDER, levels=c(1, 0), ordered=TRUE,
labels=c("Male", "Female")),
age = factor(ppagect4, levels=1:4, ordered=TRUE,
labels=c("18–29", "30–44", "45–59", "60+")),
race = factor(PPETHM, levels=c(1, 0), ordered=TRUE,
labels=c("White/non-Hispanic", "Other race specified")),
education = factor(PPEDUCAT, levels=1:4, ordered=TRUE,
labels=c("Less than high school", "High school",
"Some college", "Bachelor’s degree or above")))
saveRDS(df.raw, file.path(here(), "Data", "survey_clean.rds"))
df.small <- df.raw %>%
select(caseid, weight, KKK_Support, Gun_Support,
OPENNESS, CONSCIENTIOUSNESS, EXTRAVERSION, AGREEABLENESS, NEUROTICISM,
POLITICAL_KNOWLEDGE, NC, KKKFrame_CivLibs, GunFrame_CivLibs)Table 1
Text-based; not generated with code
Table 2: Participant demographics
dem.sex <- df.raw %>%
  group_by(sex) %>%
  summarise(Frequency = n()) %>%
  mutate(Percentage = Frequency / sum(Frequency),
         `Cumulative %` = cumsum(Percentage)) %>%
  mutate(Demographics = as.character(sex)) %>%
  select(Demographics, everything(), -sex)

dem.age <- df.raw %>%
  group_by(age) %>%
  summarise(Frequency = n()) %>%
  mutate(Percentage = Frequency / sum(Frequency),
         `Cumulative %` = cumsum(Percentage)) %>%
  mutate(Demographics = as.character(age)) %>%
  select(Demographics, everything(), -age)

dem.race <- df.raw %>%
  group_by(race) %>%
  summarise(Frequency = n()) %>%
  mutate(Percentage = Frequency / sum(Frequency),
         `Cumulative %` = cumsum(Percentage)) %>%
  mutate(Demographics = as.character(race)) %>%
  select(Demographics, everything(), -race)

dem.education <- df.raw %>%
  group_by(education) %>%
  summarise(Frequency = n()) %>%
  mutate(Percentage = Frequency / sum(Frequency),
         `Cumulative %` = cumsum(Percentage)) %>%
  mutate(Demographics = as.character(education)) %>%
  select(Demographics, everything(), -education)

title.row <- function(x) {
  data_frame(Demographics = as.character(x), Frequency = NA,
             Percentage = NA, `Cumulative %` = NA)
}

dem.full <- bind_rows(title.row("Sex"), dem.sex,
                      title.row("Age"), dem.age,
                      title.row("Race/Ethnicity"), dem.race,
                      title.row("Education"), dem.education) %>%
  mutate(Percentage = ifelse(!is.na(Frequency),
                             scales::percent(Percentage), NA),
         `Cumulative %` = ifelse(!is.na(Frequency),
                                 scales::percent(`Cumulative %`), NA),
         Demographics = ifelse(is.na(Frequency),
                               pandoc.strong.return(Demographics),
                               Demographics))
caption <- "Participant demographics"
tbl.demographics <- pandoc.table.return(dem.full, caption=caption,
justify="lccc")
cat(tbl.demographics)| Demographics | Frequency | Percentage | Cumulative % |
|---|---|---|---|
| Sex | |||
| Male | 396 | 48.9% | 48.9% |
| Female | 413 | 51.1% | 100.0% |
| Age | |||
| 18–29 | 123 | 15.2% | 15.2% |
| 30–44 | 204 | 25.2% | 40.4% |
| 45–59 | 241 | 29.8% | 70.2% |
| 60+ | 241 | 29.8% | 100.0% |
| Race/Ethnicity | |||
| White/non-Hispanic | 579 | 71.6% | 71.6% |
| Other race specified | 230 | 28.4% | 100.0% |
| Education | |||
| Less than high school | 97 | 12.0% | 12.0% |
| High school | 256 | 31.6% | 43.6% |
| Some college | 223 | 27.6% | 71.2% |
| Bachelor’s degree or above | 233 | 28.8% | 100.0% |
Information about survey distribution
The 809 participants were distributed amongst three slightly different surveys (Group 1 N = 267, Group 2 N = 273, Group 3 N = 269).
Table 3: Civil liberties and public safety frames
Text-based; not generated with code
Table 4: Personality mean scores for entire sample
df.personality.raw <- df.raw %>%
  select(OPENNESS, CONSCIENTIOUSNESS, EXTRAVERSION, AGREEABLENESS, NEUROTICISM)

personality.alphas <- psych::alpha(as.data.frame(df.personality.raw),
                                   check.keys=TRUE, warnings=FALSE)$alpha.drop %>%
  select(raw_alpha) %>%
  mutate(Trait = gsub("-", "", rownames(.)))

df.personality <- df.personality.raw %>%
  summarise_all(funs(mean = mean(., na.rm=TRUE),
                     SD = sd(., na.rm=TRUE),
                     N = sum(!is.na(.)))) %>%
  mutate_all(as.numeric) %>%
  gather(key, value) %>%
  separate(key, c("Trait", "key"), sep="_") %>%
  spread(key, value) %>%
  left_join(personality.alphas, by="Trait") %>%
  mutate(Trait = str_to_title(Trait)) %>%
  mutate(Trait = factor(Trait, levels=c("Openness", "Conscientiousness",
                                        "Extraversion", "Agreeableness",
                                        "Neuroticism"),
                        ordered=TRUE)) %>%
  arrange(Trait) %>%
  select(Trait, `Sample mean` = mean, SD, `Cronbach’s α` = raw_alpha, N)
caption <- "Personality mean scores for entire sample"
tbl.personality <- pandoc.table.return(df.personality, caption=caption,
justify="lcccc", digits=2)
cat(tbl.personality)| Trait | Sample mean | SD | Cronbach’s α | N |
|---|---|---|---|---|
| Openness | 0.72 | 0.13 | 0.65 | 760 |
| Conscientiousness | 0.78 | 0.13 | 0.61 | 763 |
| Extraversion | 0.63 | 0.16 | 0.68 | 755 |
| Agreeableness | 0.79 | 0.12 | 0.62 | 753 |
| Neuroticism | 0.54 | 0.16 | 0.59 | 771 |
Table 5: Framing effects for KKK rally and concealed handgun law
# KKK experiment
kkk.summary <- df.raw %>%
  filter(!is.na(KKKFrame_CivLibs.factor)) %>%
  group_by(KKKFrame_CivLibs.factor) %>%
  summarise(N = n(),
            Mean = Hmisc::wtd.mean(KKK_Support, weight, na.rm=TRUE),
            SD = sqrt(Hmisc::wtd.var(KKK_Support, weight, na.rm=TRUE))) %>%
  rename(Frame = KKKFrame_CivLibs.factor) %>%
  arrange(rev(Frame))

# ANOVA
kkk.anova <- aov(KKK_Support ~ KKKFrame_CivLibs.factor,
                 weights=weight, data=df.raw)

# Round to nearest ten-thousandth
kkk.sig <- ceiling(tidy(kkk.anova)[1,]$p.value * 10000) / 10000

kkk.summary.sig <- kkk.summary %>%
  mutate(`Sig.` = c(NA, kkk.sig),
         Issue = c("Public KKK rally", NA)) %>%
  select(Issue, everything())
# Guns experiment
guns.summary <- df.raw %>%
filter(!is.na(GunFrame_CivLibs.factor)) %>%
group_by(GunFrame_CivLibs.factor) %>%
summarise(N = n(),
Mean = Hmisc::wtd.mean(Gun_Support, weight, na.rm=TRUE),
SD = sqrt(Hmisc::wtd.var(Gun_Support, weight, na.rm=TRUE))) %>%
rename(Frame = GunFrame_CivLibs.factor) %>%
arrange(rev(Frame))
# ANOVA
guns.anova <- aov(Gun_Support ~ GunFrame_CivLibs.factor,
weights=weight, data=df.raw)
# Round to nearest thousandth
guns.sig <- ceiling(tidy(guns.anova)[1,]$p.value * 1000) / 1000
guns.summary.sig <- guns.summary %>%
mutate(`Sig.` = c(NA, guns.sig),
Issue = c("Concealed handgun law", NA)) %>%
select(Issue, everything())# Everything in one table
framing.summary <- bind_rows(kkk.summary.sig, guns.summary.sig)
caption <- "Framing effects for KKK rally and concealed handgun law"
tbl.framing <- pandoc.table.return(framing.summary, caption=caption,
justify="llcccc", digits=3)
notes <- c("*Notes*: “Mean” table entries are average responses, where minimum response is 1, and maximum response is 7, where 7 is maximum support.",
"",
"Question measuring support for the KKK rally: In general, do you oppose or support allowing members of the Ku Klux Klan to hold public rallies? Question measuring support for the concealed handgun law: How strongly do you support or oppose a proposed state law allowing citizens to carry concealed handguns?")
tbl.framing.notes <- pandoc.p.return(notes)
cat(tbl.framing)| Issue | Frame | N | Mean | SD | Sig. |
|---|---|---|---|---|---|
| Public KKK rally | Civil liberties frame | 267 | 3.25 | 2.17 | |
| Public safety frame | 273 | 2.67 | 1.88 | 0.001 | |
| Concealed handgun law | Civil liberties frame | 269 | 4.22 | 2.27 | |
| Public safety frame | 273 | 3.39 | 2.28 | 0.001 |
Notes: “Mean” table entries are average responses, where minimum response is 1, and maximum response is 7, where 7 is maximum support.
Question measuring support for the KKK rally: In general, do you oppose or support allowing members of the Ku Klux Klan to hold public rallies? Question measuring support for the concealed handgun law: How strongly do you support or oppose a proposed state law allowing citizens to carry concealed handguns?
Table 6: Susceptibility to KKK rally frames
model.small.kkk <- lm(KKK_Support ~ KKKFrame_CivLibs +
                        OPENNESS * KKKFrame_CivLibs +
                        CONSCIENTIOUSNESS * KKKFrame_CivLibs +
                        EXTRAVERSION * KKKFrame_CivLibs +
                        AGREEABLENESS * KKKFrame_CivLibs +
                        NEUROTICISM * KKKFrame_CivLibs,
                      data=df.small, weights=weight)

model.expanded.kkk <- lm(KKK_Support ~ KKKFrame_CivLibs +
                           OPENNESS * KKKFrame_CivLibs +
                           CONSCIENTIOUSNESS * KKKFrame_CivLibs +
                           EXTRAVERSION * KKKFrame_CivLibs +
                           AGREEABLENESS * KKKFrame_CivLibs +
                           NEUROTICISM * KKKFrame_CivLibs +
                           POLITICAL_KNOWLEDGE * KKKFrame_CivLibs +
                           NC * KKKFrame_CivLibs,
                         data=df.small, weights=weight)
coef.names.kkk <- names(coef(model.small.kkk))
coef.plot.kkk <- bind_rows(mutate(tidy(model.small.kkk, conf.int=TRUE),
model="Simple"),
mutate(tidy(model.expanded.kkk, conf.int=TRUE),
model="Full")) %>%
mutate(low = estimate - std.error,
high = estimate + std.error) %>%
left_join(coef.names, by=c("term" = "coef.name")) %>%
mutate(coef.clean = fct_rev(fct_inorder(coef.clean)),
model = factor(model, levels=c("Simple", "Full"),
labels=c("Simple ", "Full")))
stargazer.labs <- coef.plot.kkk %>%
distinct(term, coef.clean) %>%
mutate(coef.clean = as.character(coef.clean)) %>%
mutate(term = recode(term, `(Intercept)` = "Constant"),
term = paste0("^", term, "$"))
title <- "Susceptibility to KKK rally frames"
out.file <- file.path(here(), "Output", "table_kkk_results.html")
stargazer(model.small.kkk, model.expanded.kkk,
type="html", intercept.bottom=FALSE, digits=2,
title=title, out=out.file,
column.labels=c("Simple", "Full"),
dep.var.caption="", dep.var.labels.include=FALSE,
report="vc*s", order=stargazer.labs$term,
covariate.labels=stargazer.labs$coef.clean)| Simple | Full | |
| (1) | (2) | |
| Intercept | 2.27 | -0.09 |
| (1.61) | (1.69) | |
| KKK frame | 1.52 | 2.28 |
| (2.20) | (2.45) | |
| Openness | 0.30 | -1.58 |
| (1.15) | (1.41) | |
| Conscientiousness | 1.78 | 1.89 |
| (1.34) | (1.36) | |
| Extraversion | -0.95 | 0.12 |
| (0.91) | (0.92) | |
| Agreeableness | -0.96 | -0.95 |
| (1.32) | (1.33) | |
| Neuroticism | 0.33 | 1.70 |
| (0.98) | (1.03) | |
| Openness × frame | 3.90** | 5.23*** |
| (1.61) | (1.97) | |
| Conscientiousness × frame | -5.10*** | -4.92*** |
| (1.78) | (1.83) | |
| Extraversion × frame | -1.22 | -2.29* |
| (1.27) | (1.31) | |
| Agreeableness × frame | 1.58 | 0.79 |
| (1.86) | (1.94) | |
| Neuroticism × frame | -0.47 | -1.78 |
| (1.37) | (1.45) | |
| Political knowledge | 2.66*** | |
| (0.55) | ||
| Need for cognition | 0.33 | |
| (1.11) | ||
| Political knowledge × frame | -0.95 | |
| (0.80) | ||
| Need for cognition × frame | 1.15 | |
| (1.66) | ||
| Observations | 447 | 398 |
| R2 | 0.08 | 0.17 |
| Adjusted R2 | 0.06 | 0.14 |
| Residual Std. Error | 2.02 (df = 435) | 1.98 (df = 382) |
| F Statistic | 3.42*** (df = 11; 435) | 5.30*** (df = 15; 382) |
| Note: | p<0.1; p<0.05; p<0.01 | |
coef.kkk <- ggplot(coef.plot.kkk, aes(x=estimate, y=coef.clean, colour=model)) +
  geom_vline(xintercept=0, colour="black") +
  geom_pointrangeh(aes(xmin=low, xmax=high), size=0.25,
                   position=position_dodgev(0.5)) +
  scale_colour_manual(values=framing.palette("palette.bw1"), name=NULL) +
  labs(x="Coefficient", y=NULL) +
  theme_framing() + theme(legend.position="bottom")
coef.kkk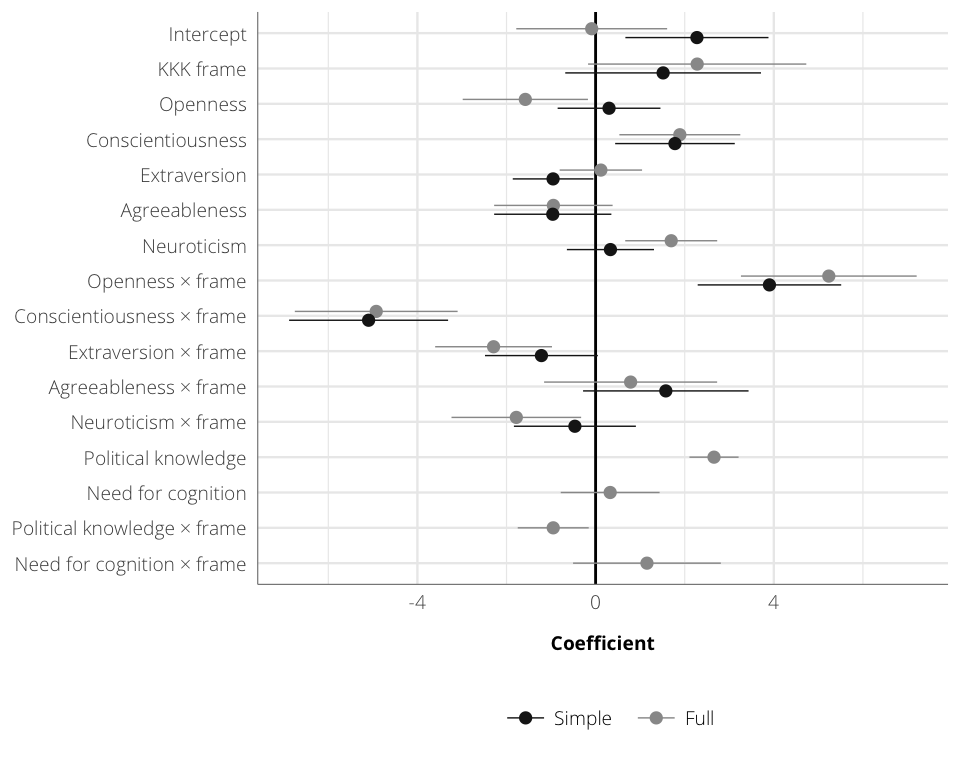
Table 7: Susceptibility to concealed handgun frames
model.small.guns <- lm(Gun_Support ~ GunFrame_CivLibs +
                         GunFrame_CivLibs * OPENNESS +
                         CONSCIENTIOUSNESS * GunFrame_CivLibs +
                         EXTRAVERSION * GunFrame_CivLibs +
                         AGREEABLENESS * GunFrame_CivLibs +
                         NEUROTICISM * GunFrame_CivLibs,
                       data=df.small, weights=weight)

model.expanded.guns <- lm(Gun_Support ~ GunFrame_CivLibs +
                            OPENNESS * GunFrame_CivLibs +
                            CONSCIENTIOUSNESS * GunFrame_CivLibs +
                            EXTRAVERSION * GunFrame_CivLibs +
                            AGREEABLENESS * GunFrame_CivLibs +
                            NEUROTICISM * GunFrame_CivLibs +
                            POLITICAL_KNOWLEDGE * GunFrame_CivLibs +
                            NC * GunFrame_CivLibs,
                          data=df.small, weights=weight)
coef.names.guns <- names(coef(model.small.guns))
coef.plot.guns <- bind_rows(mutate(tidy(model.small.guns, conf.int=TRUE),
model="Simple"),
mutate(tidy(model.expanded.guns, conf.int=TRUE),
model="Full")) %>%
mutate(low = estimate - std.error,
high = estimate + std.error) %>%
left_join(coef.names, by=c("term" = "coef.name")) %>%
mutate(coef.clean = fct_rev(fct_inorder(coef.clean)),
model = factor(model, levels=c("Simple", "Full"),
labels=c("Simple ", "Full")))
stargazer.labs <- coef.plot.guns %>%
distinct(term, coef.clean) %>%
mutate(coef.clean = as.character(coef.clean)) %>%
mutate(term = recode(term, `(Intercept)` = "Constant"),
term = paste0("^", term, "$"))
title <- "Susceptibility to concealed handgun frames"
out.file <- file.path(here(), "Output", "table_guns_results.html")
stargazer(model.small.guns, model.expanded.guns,
type="html", intercept.bottom=FALSE, digits=2,
title=title, out=out.file,
column.labels=c("Simple", "Full"),
dep.var.caption="", dep.var.labels.include=FALSE,
report="vc*s", order=stargazer.labs$term,
covariate.labels=stargazer.labs$coef.clean)| Simple | Full | |
| (1) | (2) | |
| Intercept | 2.27 | 1.72 |
| (1.85) | (1.99) | |
| Guns frame | 5.86** | 7.63** |
| (2.75) | (2.97) | |
| Openness | 2.00 | 2.03 |
| (1.36) | (1.65) | |
| Conscientiousness | 0.53 | 0.44 |
| (1.54) | (1.60) | |
| Extraversion | -0.47 | -0.03 |
| (1.04) | (1.09) | |
| Agreeableness | -0.07 | -0.21 |
| (1.51) | (1.57) | |
| Neuroticism | -0.74 | -0.12 |
| (1.12) | (1.22) | |
| Openness × frame | -1.56 | -3.94 |
| (1.95) | (2.51) | |
| Conscientiousness × frame | -1.46 | -1.04 |
| (2.18) | (2.28) | |
| Extraversion × frame | 0.97 | 0.81 |
| (1.53) | (1.61) | |
| Agreeableness × frame | -3.71* | -4.33* |
| (2.11) | (2.22) | |
| Neuroticism × frame | -0.86 | -2.12 |
| (1.67) | (1.78) | |
| Political knowledge | 0.78 | |
| (0.66) | ||
| Need for cognition | -0.64 | |
| (1.31) | ||
| Political knowledge × frame | -1.46 | |
| (0.92) | ||
| Need for cognition × frame | 2.85 | |
| (1.96) | ||
| Observations | 453 | 408 |
| R2 | 0.06 | 0.08 |
| Adjusted R2 | 0.04 | 0.04 |
| Residual Std. Error | 2.31 (df = 441) | 2.32 (df = 392) |
| F Statistic | 2.57*** (df = 11; 441) | 2.17*** (df = 15; 392) |
| Note: | p<0.1; p<0.05; p<0.01 | |
coef.guns <- ggplot(coef.plot.guns, aes(x=estimate, y=coef.clean, colour=model)) +
  geom_vline(xintercept=0, colour="black") +
  geom_pointrangeh(aes(xmin=low, xmax=high), size=0.25,
                   position=position_dodgev(0.5)) +
  scale_colour_manual(values=framing.palette("palette.bw1"), name=NULL) +
  labs(x="Coefficient", y=NULL) +
  theme_framing() + theme(legend.position="bottom")
coef.guns
Figure 1: Predicted means of KKK support across frames and personality types
# Get just the means of personality types
personality.means <- model.expanded.kkk$model %>%
  summarise_at(vars(OPENNESS, CONSCIENTIOUSNESS, EXTRAVERSION, AGREEABLENESS,
                    NEUROTICISM, POLITICAL_KNOWLEDGE, NC),
               mean)

# Create rows of personality types with all 0s and all 1s
personality.1 <- data_frame(personality = colnames(personality.means),
                            value = 1) %>%
  spread(personality, value)
personality.0 <- data_frame(personality = colnames(personality.means),
                            value = 0) %>%
  spread(personality, value)

# Create base matrix of possible personality type values (mean, 0, and 1)
personality.possibilities <- bind_rows(personality.means,
                                       personality.0, personality.1)

# Expand the personality possibilities matrix to include all combinations of
# all variables, then filter out all rows where there are multiple 0 and 1
# values
new.data.personalities <- expand.grid(personality.possibilities) %>%
  mutate(id = row_number()) %>%
  gather(key, value, -id) %>%
  group_by(id) %>%
  # Select only rows where there's one 0 value and no 1 value, or one 1 value
  # and no 0 value
  filter(sum(value == 0) == 1 & !any(value == 1) |
           sum(value == 1) == 1 & !any(value == 0)) %>%
  spread(key, value) %>%
  mutate(index = 1)

# Create matrix of possible framing conditions
new.data.kkk <- data_frame(KKKFrame_CivLibs = 0:1, index = 1,
                           `(weights)` = 1) %>%
  left_join(new.data.personalities, by="index") %>%
  select(-index, -id)

plot.predict.kkk <- augment(model.expanded.kkk, newdata=new.data.kkk) %>%
  gather(key, value, one_of(colnames(personality.means))) %>%
  left_join(coef.names, by=c("key" = "coef.name")) %>%
  filter(value %in% c(0, 1)) %>%
  mutate(value = factor(value, levels=c(0, 1),
                        labels=c("Low (0)    ", "High (1)"),
                        ordered=TRUE),
         KKKFrame_CivLibs = factor(KKKFrame_CivLibs, levels=c(0, 1),
                                   labels=c("Public safety", "Civil liberties"),
                                   ordered=TRUE),
coef.clean = fct_inorder(coef.clean))pandoc.table(select(plot.predict.kkk, Personality = coef.clean, Value = value,
Frame = KKKFrame_CivLibs, `Fitted value` = .fitted, `SE` = .se.fit))| Personality | Value | Frame | Fitted value | SE |
|---|---|---|---|---|
| Openness | Low (0) | Public safety | 3.95 | 1.04 |
| Openness | High (1) | Public safety | 2.38 | 0.401 |
| Openness | Low (0) | Civil liberties | 0.636 | 1.01 |
| Openness | High (1) | Civil liberties | 4.29 | 0.412 |
| Conscientiousness | Low (0) | Public safety | 1.32 | 1.07 |
| Conscientiousness | High (1) | Public safety | 3.21 | 0.322 |
| Conscientiousness | Low (0) | Civil liberties | 5.67 | 0.963 |
| Conscientiousness | High (1) | Civil liberties | 2.63 | 0.306 |
| Extraversion | Low (0) | Public safety | 2.73 | 0.602 |
| Extraversion | High (1) | Public safety | 2.85 | 0.365 |
| Extraversion | Low (0) | Civil liberties | 4.67 | 0.601 |
| Extraversion | High (1) | Civil liberties | 2.5 | 0.374 |
| Agreeableness | Low (0) | Public safety | 3.57 | 1.08 |
| Agreeableness | High (1) | Public safety | 2.62 | 0.294 |
| Agreeableness | Low (0) | Civil liberties | 3.41 | 1.12 |
| Agreeableness | High (1) | Civil liberties | 3.25 | 0.336 |
| Neuroticism | Low (0) | Public safety | 1.89 | 0.578 |
| Neuroticism | High (1) | Public safety | 3.58 | 0.49 |
| Neuroticism | Low (0) | Civil liberties | 3.33 | 0.567 |
| Neuroticism | High (1) | Civil liberties | 3.25 | 0.497 |
| Political knowledge | Low (0) | Public safety | 0.734 | 0.437 |
| Political knowledge | High (1) | Public safety | 3.39 | 0.193 |
| Political knowledge | Low (0) | Civil liberties | 1.95 | 0.463 |
| Political knowledge | High (1) | Civil liberties | 3.66 | 0.196 |
| Need for cognition | Low (0) | Public safety | 2.58 | 0.794 |
| Need for cognition | High (1) | Public safety | 2.9 | 0.355 |
| Need for cognition | Low (0) | Civil liberties | 2.23 | 0.9 |
| Need for cognition | High (1) | Civil liberties | 3.71 | 0.373 |
plot.pred.kkk <- ggplot(plot.predict.kkk,
                        aes(x=KKKFrame_CivLibs, y=.fitted,
                            colour=value, group=value)) +
  geom_line(size=1) +
  geom_ribbon(aes(ymax=.fitted + (qnorm(0.975) * .se.fit),
                  ymin=.fitted + (qnorm(0.025) * .se.fit),
                  fill=value),
              alpha=0.3, colour=NA) +
  labs(x=NULL, y="Average KKK support") +
  scale_colour_manual(values=framing.palette("palette.bw2"), name=NULL) +
  scale_fill_manual(values=framing.palette("palette.bw2"), name=NULL) +
  coord_cartesian(ylim=c(0, 8)) +
  scale_y_continuous(breaks=c(1, 3, 5, 7)) +
  facet_wrap(~ coef.clean, ncol=2) +
  theme_framing() + theme(panel.grid.minor=element_blank(),
                          panel.grid.major.x=element_blank(),
                          strip.text=element_text(size=rel(0.8)))
plot.pred.kkk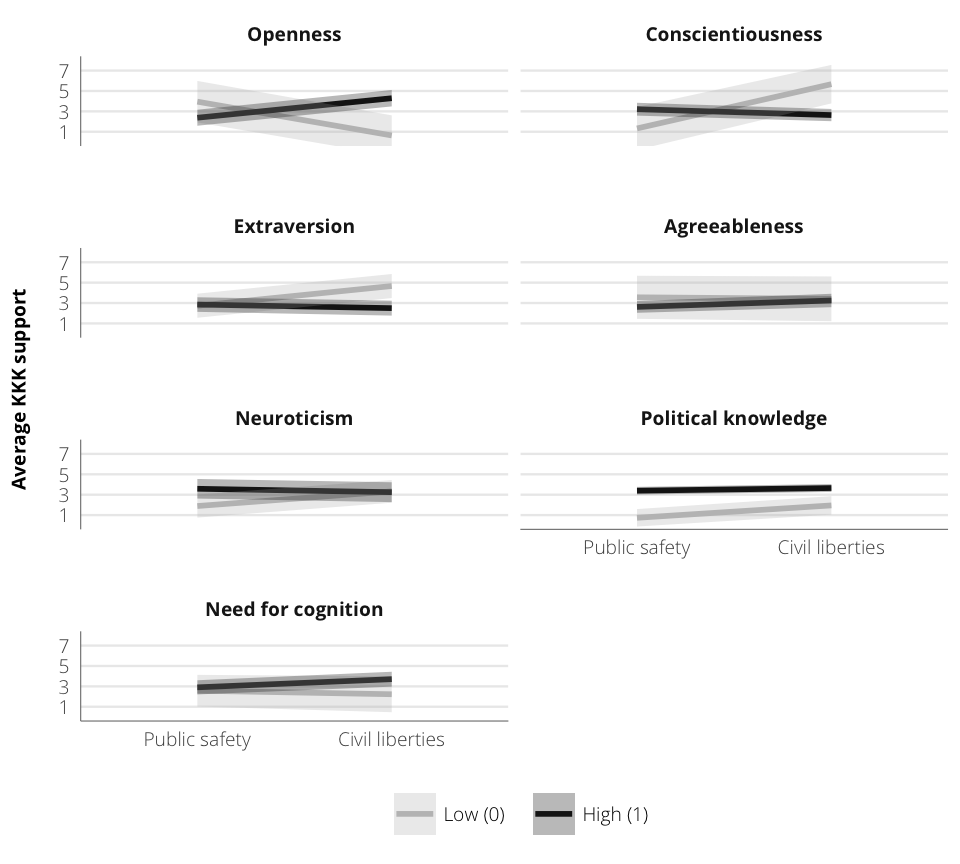
Figure 2: Predicted means of concealed handgun support across frames and personality types
personality.means <- model.expanded.guns$model %>%
  summarise_at(vars(OPENNESS, CONSCIENTIOUSNESS, EXTRAVERSION, AGREEABLENESS,
                    NEUROTICISM, POLITICAL_KNOWLEDGE, NC),
               mean)

personality.1 <- data_frame(personality = colnames(personality.means),
                            value = 1) %>%
  spread(personality, value)
personality.0 <- data_frame(personality = colnames(personality.means),
                            value = 0) %>%
  spread(personality, value)

personality.possibilities <- bind_rows(personality.means,
                                       personality.0, personality.1)

new.data.personalities <- expand.grid(personality.possibilities) %>%
  mutate(id = row_number()) %>%
  gather(key, value, -id) %>%
  group_by(id) %>%
  filter(sum(value == 0) == 1 & !any(value == 1) |
           sum(value == 1) == 1 & !any(value == 0)) %>%
  spread(key, value) %>%
  mutate(index = 1)

new.data.guns <- data_frame(GunFrame_CivLibs = 0:1, index = 1,
                            `(weights)` = 1) %>%
  left_join(new.data.personalities, by="index") %>%
  select(-index, -id)

plot.predict.guns <- augment(model.expanded.guns, newdata=new.data.guns) %>%
  gather(key, value, one_of(colnames(personality.means))) %>%
  left_join(coef.names, by=c("key" = "coef.name")) %>%
  filter(value %in% c(0, 1)) %>%
  mutate(value = factor(value, levels=c(0, 1),
                        labels=c("Low (0)    ", "High (1)"),
                        ordered=TRUE),
         GunFrame_CivLibs = factor(GunFrame_CivLibs, levels=c(0, 1),
                                   labels=c("Public safety", "Civil liberties"),
                                   ordered=TRUE),
coef.clean = fct_inorder(coef.clean))pandoc.table(select(plot.predict.guns, Personality = coef.clean, Value = value,
Frame = GunFrame_CivLibs, `Fitted value` = .fitted, `SE` = .se.fit))| Personality | Value | Frame | Fitted value | SE |
|---|---|---|---|---|
| Openness | Low (0) | Public safety | 1.96 | 1.22 |
| Openness | High (1) | Public safety | 3.99 | 0.472 |
| Openness | Low (0) | Civil liberties | 5.6 | 1.38 |
| Openness | High (1) | Civil liberties | 3.68 | 0.546 |
| Conscientiousness | Low (0) | Public safety | 3.07 | 1.27 |
| Conscientiousness | High (1) | Public safety | 3.52 | 0.376 |
| Conscientiousness | Low (0) | Civil liberties | 4.69 | 1.31 |
| Conscientiousness | High (1) | Civil liberties | 4.09 | 0.369 |
| Extraversion | Low (0) | Public safety | 3.44 | 0.711 |
| Extraversion | High (1) | Public safety | 3.41 | 0.427 |
| Extraversion | Low (0) | Civil liberties | 3.72 | 0.754 |
| Extraversion | High (1) | Civil liberties | 4.5 | 0.486 |
| Agreeableness | Low (0) | Public safety | 3.59 | 1.27 |
| Agreeableness | High (1) | Public safety | 3.38 | 0.343 |
| Agreeableness | Low (0) | Civil liberties | 7.82 | 1.25 |
| Agreeableness | High (1) | Civil liberties | 3.29 | 0.377 |
| Neuroticism | Low (0) | Public safety | 3.49 | 0.683 |
| Neuroticism | High (1) | Public safety | 3.37 | 0.575 |
| Neuroticism | Low (0) | Civil liberties | 5.42 | 0.72 |
| Neuroticism | High (1) | Civil liberties | 3.18 | 0.625 |
| Political knowledge | Low (0) | Public safety | 2.82 | 0.522 |
| Political knowledge | High (1) | Public safety | 3.6 | 0.226 |
| Political knowledge | Low (0) | Civil liberties | 4.74 | 0.513 |
| Political knowledge | High (1) | Civil liberties | 4.05 | 0.232 |
| Need for cognition | Low (0) | Public safety | 3.88 | 0.932 |
| Need for cognition | High (1) | Public safety | 3.24 | 0.419 |
| Need for cognition | Low (0) | Civil liberties | 2.63 | 1.07 |
| Need for cognition | High (1) | Civil liberties | 4.84 | 0.445 |
plot.pred.guns <- ggplot(plot.predict.guns,
                         aes(x=GunFrame_CivLibs, y=.fitted,
                             colour=value, group=value)) +
  geom_line(size=1) +
  geom_ribbon(aes(ymax=.fitted + (qnorm(0.975) * .se.fit),
                  ymin=.fitted + (qnorm(0.025) * .se.fit),
                  fill=value),
              alpha=0.3, colour=NA) +
  labs(x=NULL, y="Average concealed carry support") +
  scale_colour_manual(values=framing.palette("palette.bw2"), name=NULL) +
  scale_fill_manual(values=framing.palette("palette.bw2"), name=NULL) +
  coord_cartesian(ylim=c(0, 8)) +
  scale_y_continuous(breaks=c(1, 3, 5, 7)) +
  facet_wrap(~ coef.clean, ncol=2) +
  theme_framing() + theme(panel.grid.minor=element_blank(),
                          panel.grid.major.x=element_blank(),
                          strip.text=element_text(size=rel(0.8)))
plot.pred.guns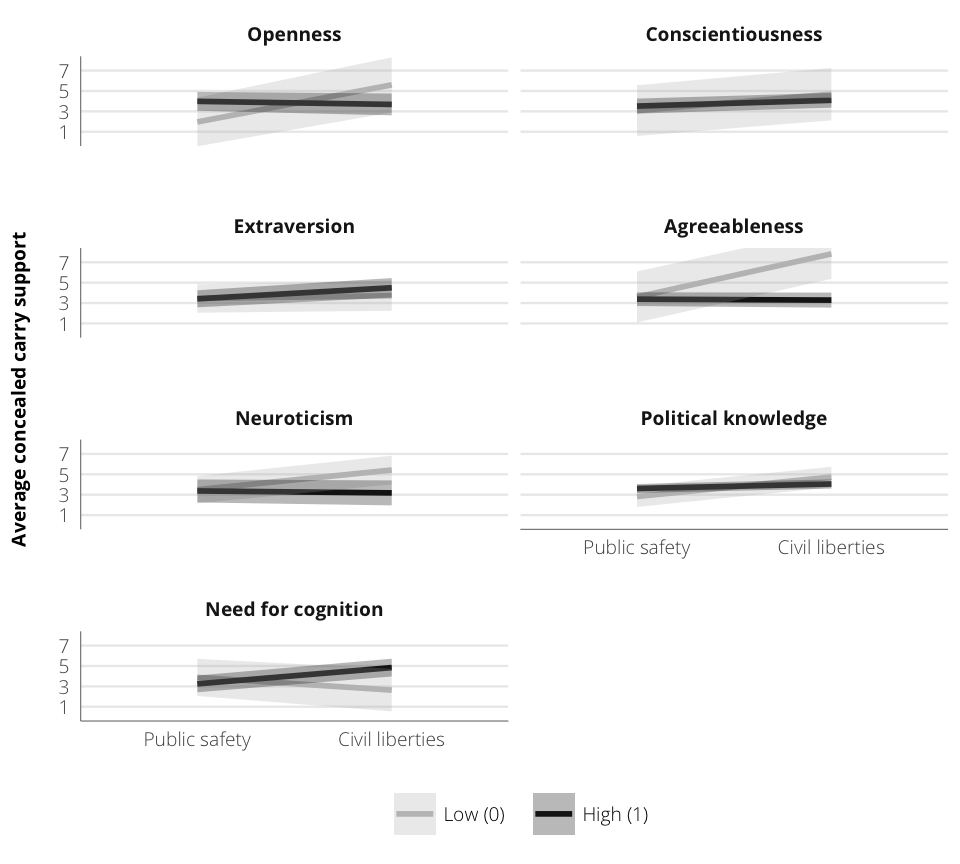
Final output
In Output/ you can find:
- Word versions of all tables (saved as
.docxfiles) - Print-ready PDF versions of all figures (saved as
.pdffiles) - High quality PNG versions of all figures (for use in Word and PowerPoint; saved as
.pngfiles) - Captions for all figures (saved as
.txtfiles)
# Convert Markdown tables to docx
capture.output({
  Sys.glob(file.path(here(), "Output", "*.md")) %>%
    map(~ Pandoc.convert(., format="docx", footer=FALSE,
                         proc.time=FALSE, open=FALSE))
}, file="/dev/null")

# Convert stargazer HTML tables to docx (macOS only)
if (Sys.info()['sysname'] == "Darwin" & stargazer2word) {
  change.dir <- paste('cd "', file.path(here(), "bin"), '"', sep="")
  command <- paste("python3 stargazer2docx.py")
  full.command <- paste(change.dir, command, sep="; ")
  system(full.command)
}