Survey summary
Andrew Heiss
August 16, 2016
Load clean data
knitr::opts_chunk$set(fig.retina=2)

library(dplyr)
library(tidyr)
library(purrr)
library(ggplot2)
library(ggstance)
library(stringr)
library(magrittr)
library(DT)
library(scales)
library(countrycode)
library(tm)

source(file.path(PROJHOME, "Analysis", "lib", "graphic_functions.R"))

# Load cleaned, country-based survey data (*with* the Q4\* loop)
survey.clean.all <- readRDS(file.path(PROJHOME, "Data", "data_processed",
                                      "survey_clean_all.rds"))

# Load cleaned, organization-based data (without the Q4 loop)
survey.orgs.clean <- readRDS(file.path(PROJHOME, "Data", "data_processed",
                                       "survey_orgs_clean.rds"))

# Load cleaned, country-based data (only the Q4 loop)
survey.countries.clean <- readRDS(file.path(PROJHOME, "Data", "data_processed",
                                            "survey_countries_clean.rds"))

# Load Robinson map projection
countries.ggmap <- readRDS(file.path(PROJHOME, "Data", "data_processed",
                                     "countries110_robinson_ggmap.rds"))

# All possible countries (to fix the South Sudan issue)
possible.countries <- data_frame(id = unique(as.character(countries.ggmap$id)))
General questions
How many NGOs responded?
nrow(survey.orgs.clean) ## [1] 641How many respondents answered questions for more than one country?
survey.countries.clean %>% filter(loop.number > 1) %>% nrow %T>%
  {print(percent(. / nrow(survey.orgs.clean)))}
## [1] "2.81%"## [1] 18Who in the organization responded to the survey?
df.plot.respondents <- survey.orgs.clean %>%
  group_by(Q2.3) %>%
  summarise(num = n()) %>%
  arrange(num) %>%
  mutate(question = factor(Q2.3, levels=Q2.3, ordered=TRUE))

plot.respondents <- ggplot(df.plot.respondents, aes(x=num, y=question)) +
  geom_barh(stat="identity") +
  scale_x_continuous(expand=c(0, 0)) +
  labs(x="Number of respondents", y=NULL,
       title="Who filled out the survey?",
       subtitle="Q2.3: What is your position in your organization?") +
  theme_ath()

plot.respondents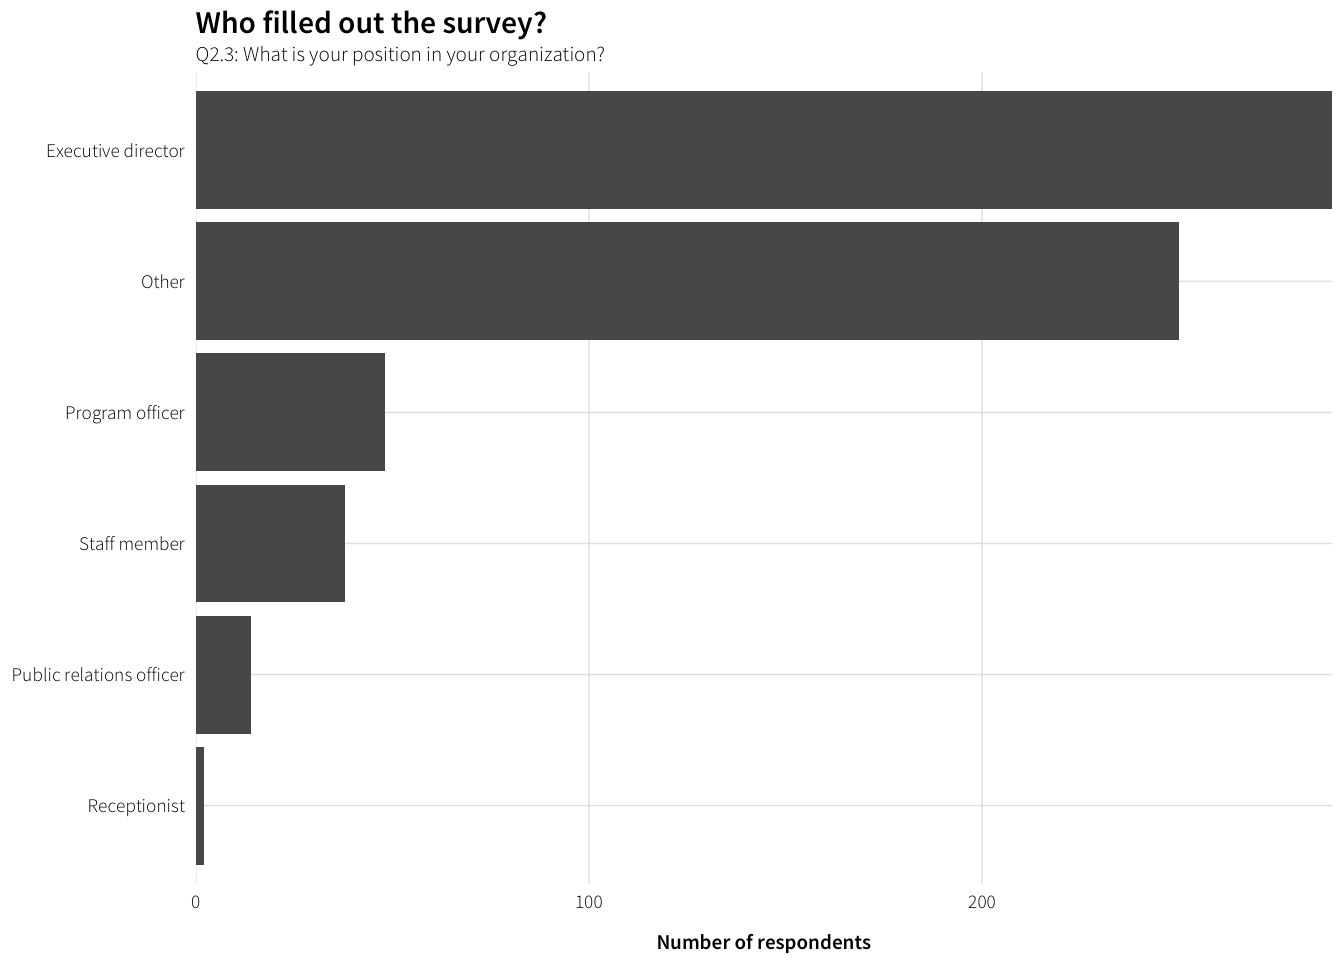
Lots of others. Who are the others?
# Table
position.in.org <- survey.orgs.clean %>%
  filter(!is.na(Q2.3_TEXT)) %>%
  mutate(position.in.org = str_to_title(Q2.3_TEXT)) %>%
  group_by(position.in.org) %>%
  summarise(num = n()) %>%
  arrange(desc(num))

datatable(position.in.org)
# Figure
df.plot.respondents.other <- position.in.org %>%
filter(num >= 5) %>%
mutate(question = factor(position.in.org,
levels=rev(position.in.org), ordered=TRUE))
plot.respondents.other <- ggplot(df.plot.respondents.other,
aes(x=num, y=question)) +
geom_barh(stat="identity") +
scale_x_continuous(expand=c(0, 0)) +
labs(x="Number of respondents", y=NULL,
title="What are the positions of those who answered “Other”?",
subtitle="Q2.3: What is your position in your organization?: Free responses to “Other”") +
theme_ath()
plot.respondents.other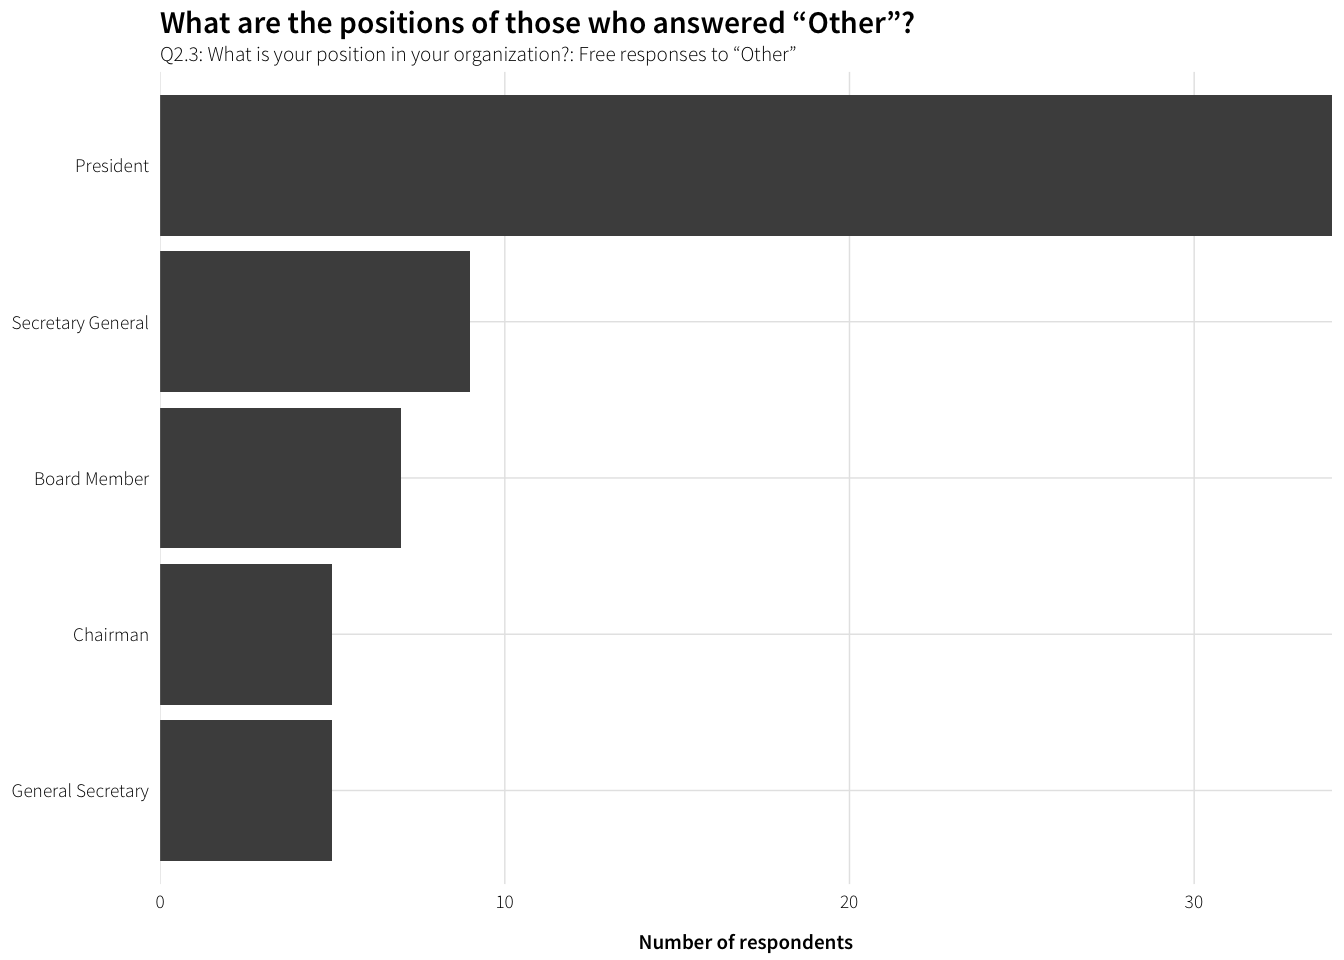
How are these NGOs distributed by HQ?
df.hq.countries <- survey.orgs.clean %>%
  group_by(Q2.2_iso3) %>%
  summarise(num.ngos = n()) %>%
  ungroup() %>%
  # Combine with list of all possible mappable countries
  right_join(possible.countries, by=c("Q2.2_iso3"="id")) %>%
  mutate(num.ceiling = ifelse(num.ngos >= 50, 50, num.ngos),
         prop = num.ngos / sum(num.ngos, na.rm=TRUE),
         country.name = countrycode(Q2.2_iso3, "iso3c", "country.name"),
         presence = num.ngos >= 1) %>%
  arrange(desc(num.ngos))

datatable(df.hq.countries)
Number of unique HQ countries
sum(df.hq.countries$presence, na.rm=TRUE)## [1] 93Regional distribution of HQ countries
df.hq.regions <- df.hq.countries %>%
  filter(!is.na(num.ngos)) %>%
  mutate(region = countrycode(Q2.2_iso3, "iso3c", "continent"),
         region = ifelse(Q2.2_iso3 == "TWN", "Asia", region)) %>%
  group_by(region) %>%
  summarise(num = sum(num.ngos, na.rm=TRUE)) %>% ungroup() %>%
  mutate(prop = num / sum(num)) %>%
  arrange(desc(num)) %>%
  mutate(region = factor(region, levels=rev(region), ordered=TRUE))
df.hq.regions
## # A tibble: 5 × 3
## region num prop
## <ord> <int> <dbl>
## 1 Europe 228 0.3613312
## 2 Americas 195 0.3090333
## 3 Africa 109 0.1727417
## 4 Asia 85 0.1347068
## 5 Oceania 14 0.0221870plot.hq.regions <- ggplot(df.hq.regions, aes(x=num, y=region)) +
geom_barh(stat="identity") +
scale_x_continuous(expand=c(0, 0)) +
labs(x="Number of respondents", y=NULL,
title="Region of headquarters",
subtitle="Q2.2: Where is your organization's headquarters? (summarized by region)") +
theme_ath()
plot.hq.regions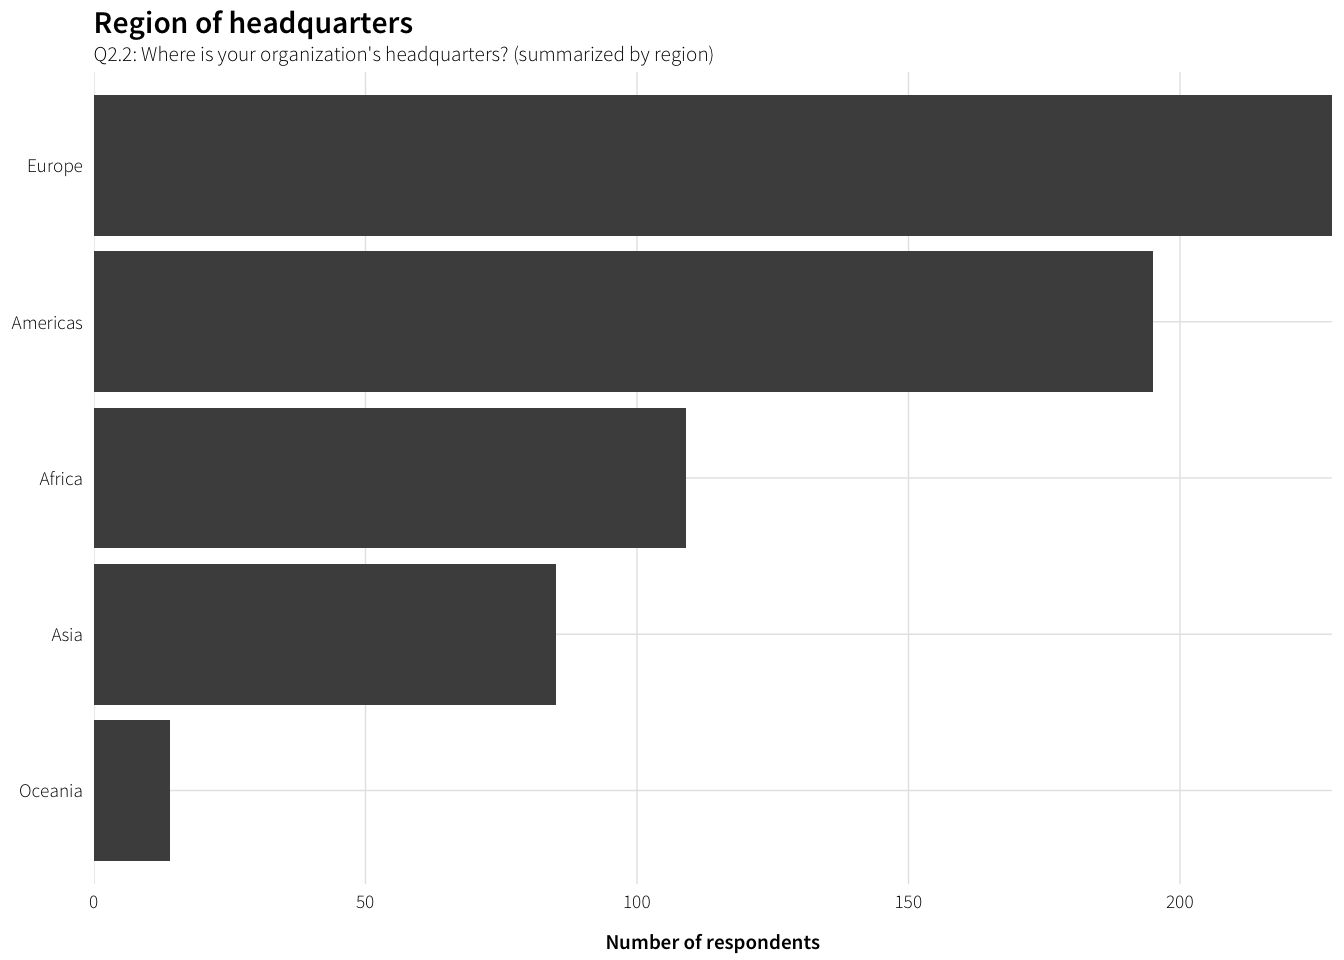
Countries with at least one response
plot.hq.map.presence <- ggplot(df.hq.countries, aes(fill=presence, map_id=Q2.2_iso3)) +
  geom_map(map=countries.ggmap, size=0.15, colour="black") +
  expand_limits(x=countries.ggmap$long, y=countries.ggmap$lat) +
  coord_equal() +
  scale_fill_manual(values=c("grey50", "#FFFFFF"), na.value="#FFFFFF", guide=FALSE) +
  labs(title="Countries with at least one response",
       subtitle="Q2.2: Where is your organization's headquarters?") +
  theme_ath_map()
plot.hq.map.presence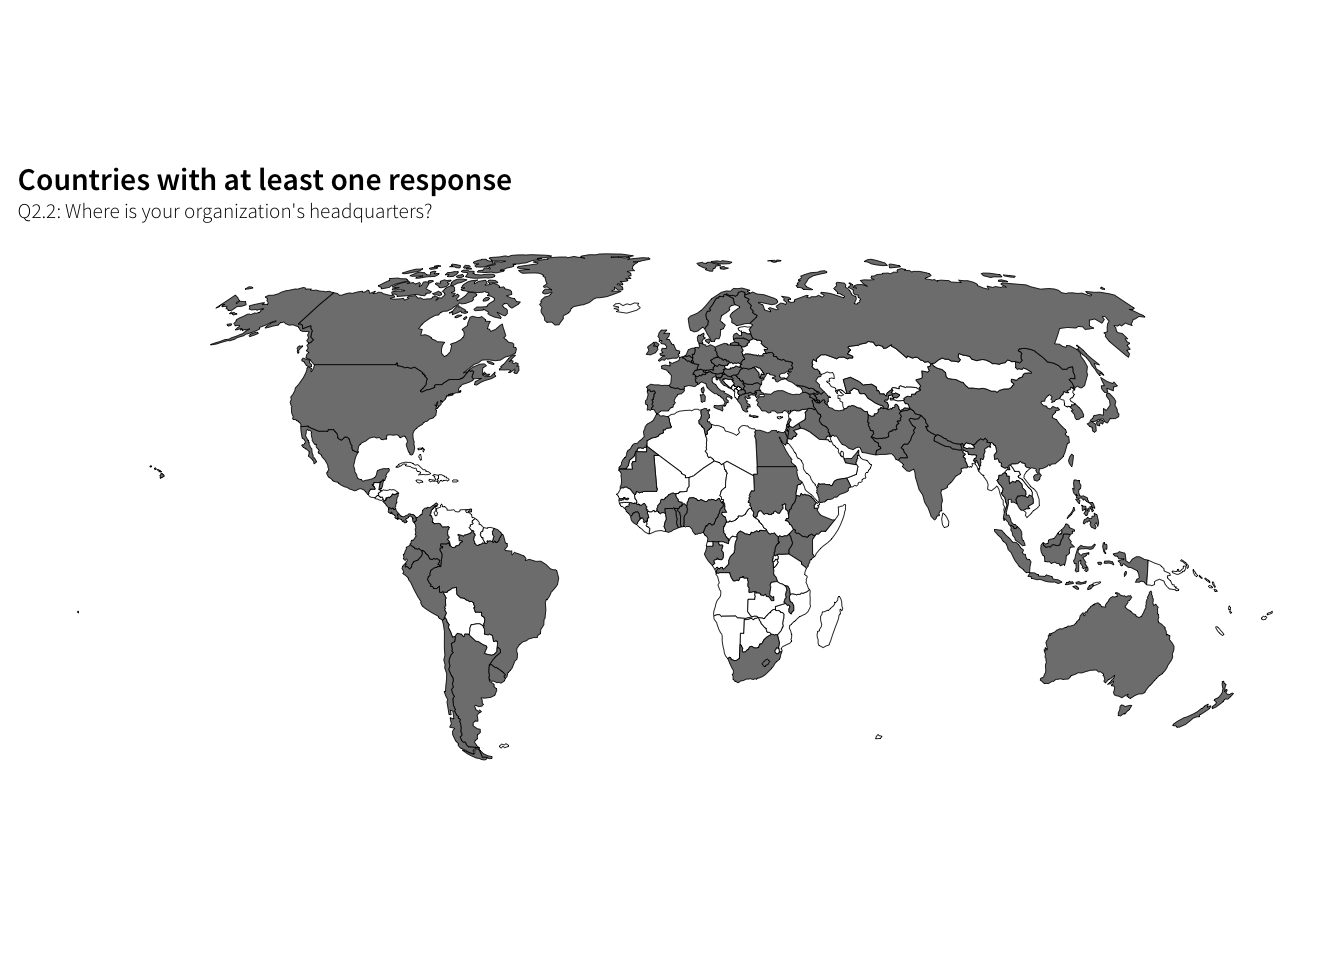
Responses per country (50 NGO ceiling)
plot.hq.map.scale <- ggplot(df.hq.countries, aes(fill=num.ceiling, map_id=Q2.2_iso3)) +
  geom_map(map=countries.ggmap, size=0.15, colour="black") +
  expand_limits(x=countries.ggmap$long, y=countries.ggmap$lat) +
  coord_equal() +
  scale_fill_gradient(low="grey95", high="grey20", breaks=seq(0, 50, 10),
                      labels=c(paste(seq(0, 40, 10), "  "), "50+"),
                      na.value="#FFFFFF", name="NGOs based in country",
                      guide=guide_colourbar(ticks=FALSE, barwidth=6)) +
  labs(title="Number of responding NGOs around the world",
       subtitle="Q2.2: Where is your organization's headquarters? (50 NGO ceiling)") +
  theme_ath_map() +
  theme(legend.position="bottom", legend.key.size=unit(0.65, "lines"),
        strip.background=element_rect(colour="#FFFFFF", fill="#FFFFFF"))
plot.hq.map.scale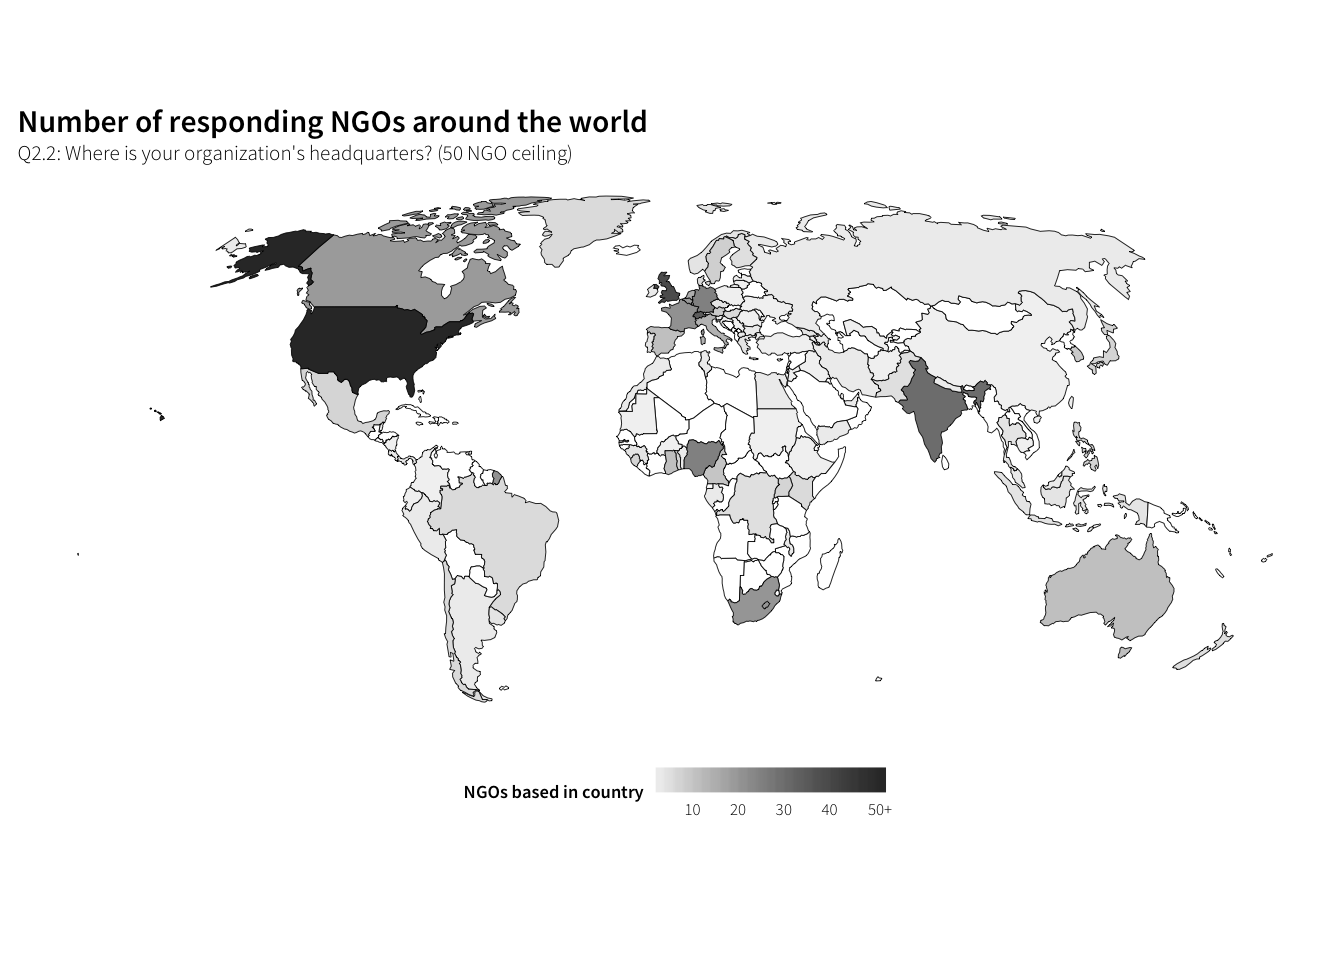
Where do these NGOs work?
df.work.countries.all <- survey.orgs.clean %>%
  unnest(Q2.5_iso3) %>%
  group_by(Q2.5_iso3) %>%
  summarise(num = n()) %>%
  ungroup() %>%
  # Combine with list of all possible mappable countries
  right_join(possible.countries, by=c("Q2.5_iso3"="id")) %>%
  mutate(prop = num / sum(num, na.rm=TRUE),
         country.name = countrycode(Q2.5_iso3, "iso3c", "country.name"),
         presence = num >= 1) %>%
  arrange(desc(num))

datatable(df.work.countries.all)
Regional distribution of countries where NGOs report working
df.work.regions.all <- survey.orgs.clean %>%
  unnest(Q2.5_iso3) %>%
  mutate(region = countrycode(Q2.5_iso3, "iso3c", "continent"),
         region = ifelse(Q2.5_iso3 == "TWN", "Asia", region),
         region = ifelse(Q2.5_iso3 == "XKX", "Europe", region)) %>%
  group_by(region) %>%
  summarise(num = n()) %>% ungroup() %>%
  mutate(prop = num / sum(num)) %>%
  arrange(desc(num))
df.work.regions.all
## # A tibble: 5 × 3
## region num prop
## <chr> <int> <dbl>
## 1 Europe 2988 0.2973430
## 2 Africa 2625 0.2612200
## 3 Asia 2346 0.2334561
## 4 Americas 1735 0.1726540
## 5 Oceania 355 0.0353269Not plotting because the organization-county-region unit is a little wonky.
Number of unique countries where work is reported
sum(df.work.countries.all$presence, na.rm=TRUE)## [1] 169That’s pretty much every country! There are 172 recognized countries in the map file, so mapping them out is kind of pointless.
Responses per country
plot.work.all.map.scale <- ggplot(df.work.countries.all,
                                  aes(fill=num, map_id=Q2.5_iso3)) +
  geom_map(map=countries.ggmap, size=0.15, colour="black") +
  expand_limits(x=countries.ggmap$long, y=countries.ggmap$lat) +
  coord_equal() +
  scale_fill_gradient(low="grey95", high="grey20", #breaks=seq(0, 200, 50),
                      # labels=c(paste(seq(0, 150, 50), "  "), "50+"),
                      na.value="#FFFFFF", name="NGOs reporting work in country",
                      guide=guide_colourbar(ticks=FALSE, barwidth=6)) +
  labs(title="Countries where NGOs work",
       subtitle="Q2.5: Besides 'home_country', where does your organization work?") +
  theme_ath_map() +
  theme(legend.position="bottom", legend.key.size=unit(0.65, "lines"),
        strip.background=element_rect(colour="#FFFFFF", fill="#FFFFFF"))
plot.work.all.map.scale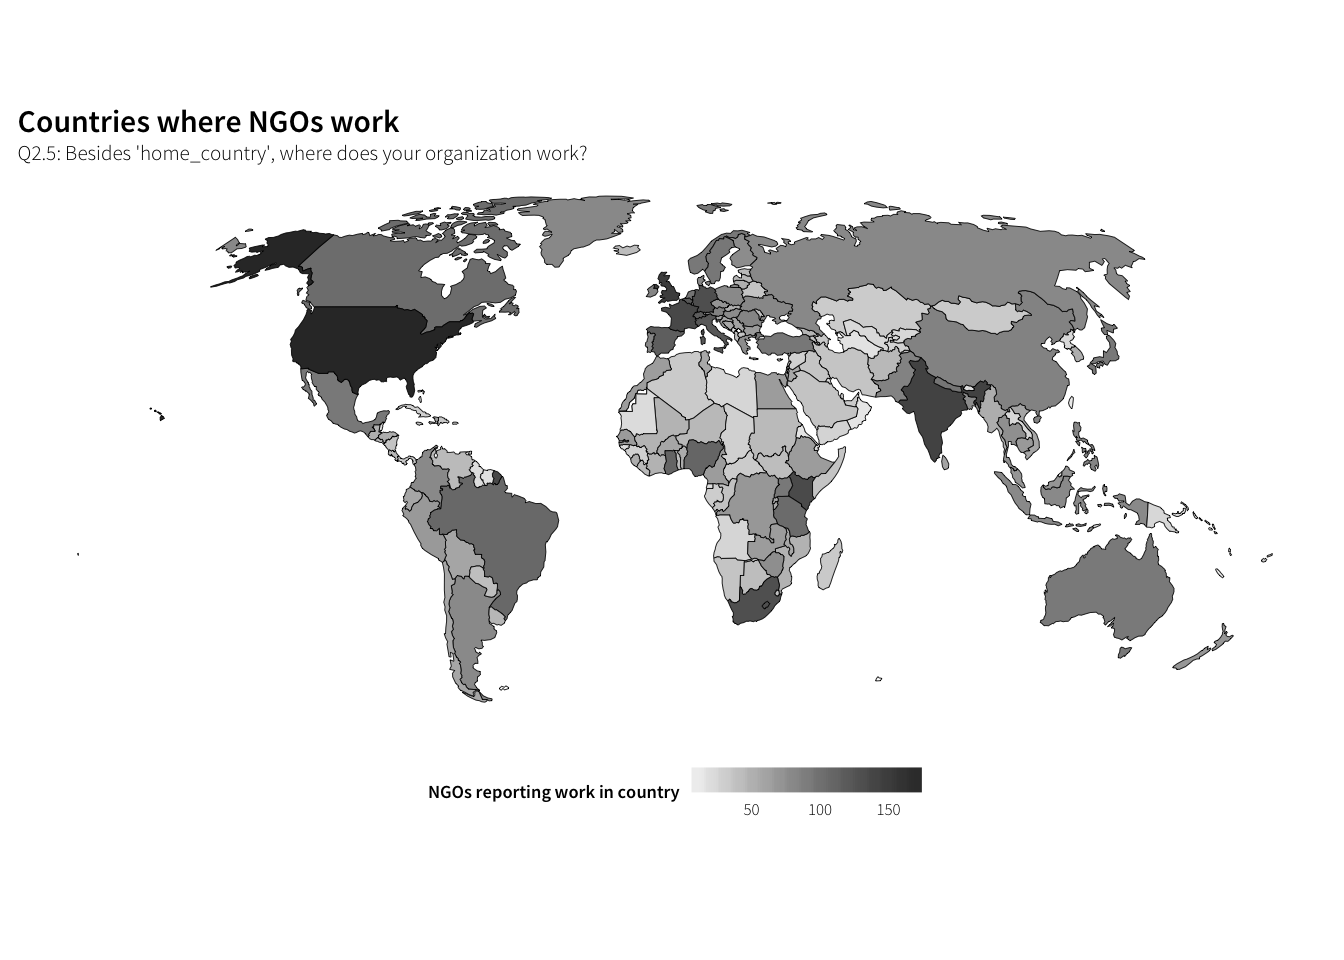
Which countries did NGOs answer about?
df.work.countries.answered <- survey.countries.clean %>%
  group_by(Q4.1_iso3) %>%
  summarise(num = n()) %>%
  ungroup() %>%
  # Combine with list of all possible mappable countries
  right_join(possible.countries, by=c("Q4.1_iso3"="id")) %>%
  mutate(num.ceiling = ifelse(num >= 20, 20, num),
         prop = num / sum(num, na.rm=TRUE),
         country.name = countrycode(Q4.1_iso3, "iso3c", "country.name"),
         presence = num >= 1) %>%
  arrange(desc(num))

datatable(df.work.countries.answered)
Regional distribution of countries NGOs answered about
df.work.regions.answered <- df.work.countries.answered %>%
  filter(!is.na(num)) %>%
  mutate(region = countrycode(Q4.1_iso3, "iso3c", "continent")) %>%
  group_by(region) %>%
  summarise(num = sum(num)) %>% ungroup() %>%
  mutate(prop = num / sum(num)) %>%
  arrange(desc(num)) %>%
  mutate(region = factor(region, levels=rev(region), ordered=TRUE))
df.work.regions.answered
## # A tibble: 5 × 3
## region num prop
## <ord> <int> <dbl>
## 1 Africa 200 0.3105590
## 2 Asia 158 0.2453416
## 3 Europe 151 0.2344720
## 4 Americas 115 0.1785714
## 5 Oceania 20 0.0310559plot.work.regions <- ggplot(df.work.regions.answered, aes(x=num, y=region)) +
geom_barh(stat="identity") +
scale_x_continuous(expand=c(0, 0)) +
labs(x="Number of responses", y=NULL,
title="Region of country NGO answered about",
subtitle="One of countries selected in Q2.5: Besides 'home_country', where does your organization work?") +
theme_ath()
plot.work.regions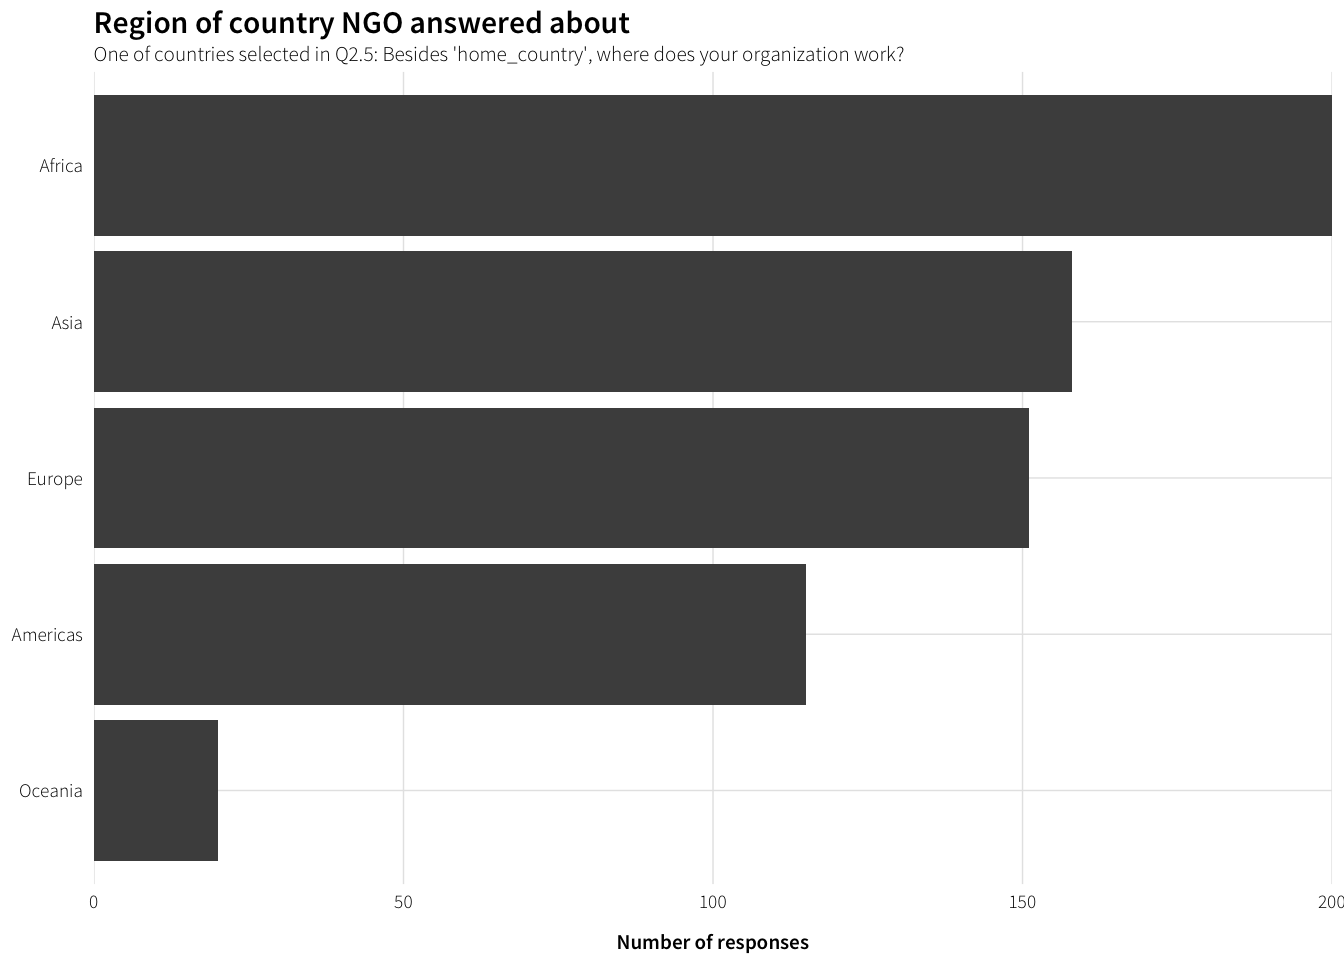
Number of unique countries NGOs answered about
sum(df.work.countries.answered$presence, na.rm=TRUE)## [1] 139Countries with at least one response
plot.work.map.presence <- ggplot(df.work.countries.answered,
                                 aes(fill=presence, map_id=Q4.1_iso3)) +
  geom_map(map=countries.ggmap, size=0.15, colour="black") +
  expand_limits(x=countries.ggmap$long, y=countries.ggmap$lat) +
  coord_equal() +
  scale_fill_manual(values=c("grey50", "#FFFFFF"), na.value="#FFFFFF", guide=FALSE) +
  labs(title="Countries about which at least one NGO answered questions",
       subtitle="Q4.1: Please select a country you would like to discuss\n(One of countries selected in Q2.5)") +
  theme_ath_map()
plot.work.map.presence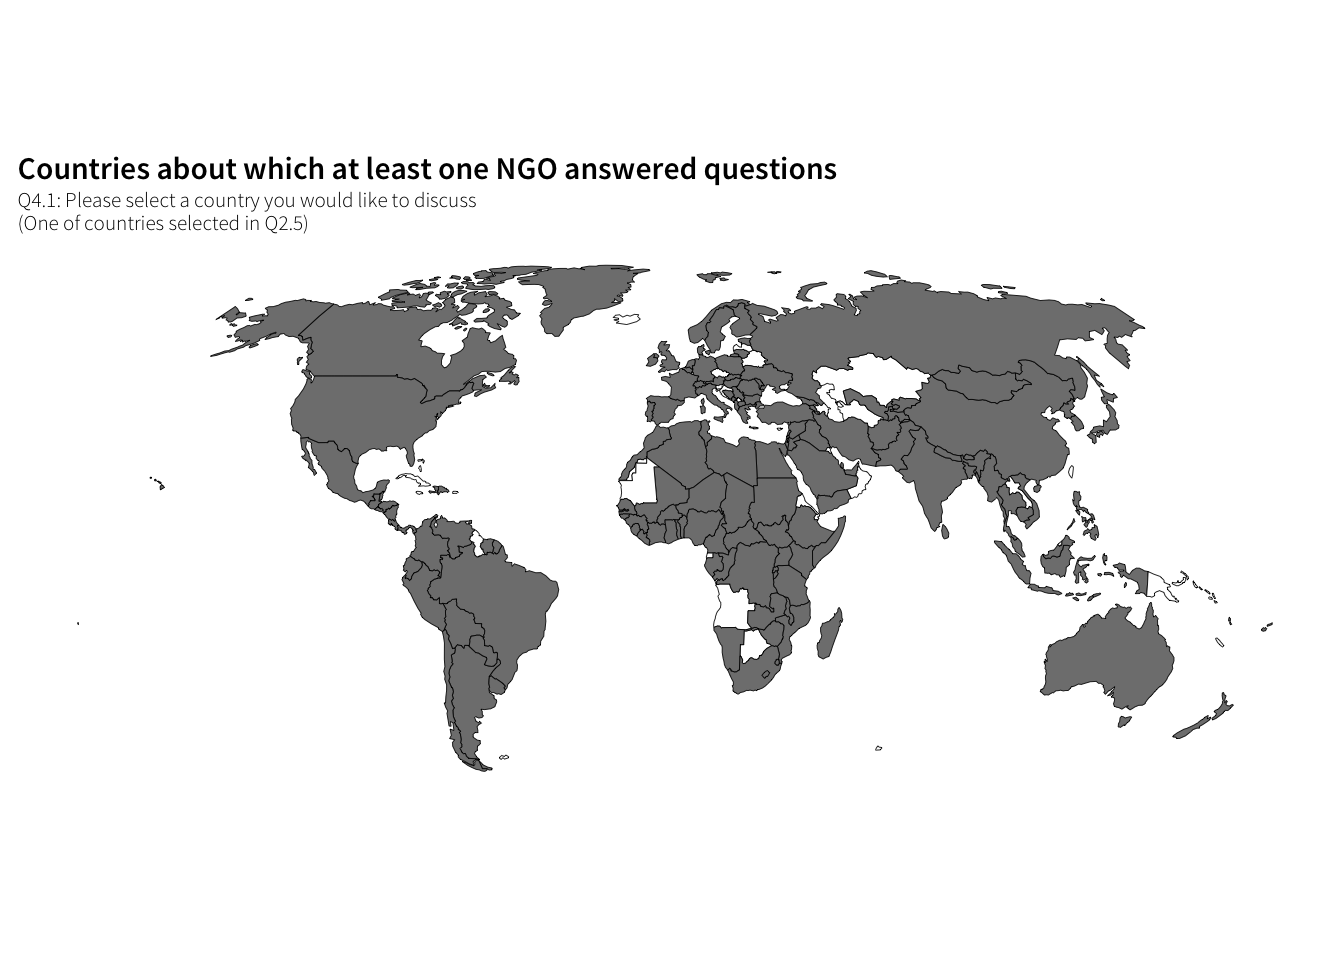
# #### Responses per country (20 NGO ceiling)
plot.work.map.scale <- ggplot(df.work.countries.answered,
                              aes(fill=num.ceiling, map_id=Q4.1_iso3)) +
  geom_map(map=countries.ggmap, size=0.15, colour="black") +
  expand_limits(x=countries.ggmap$long, y=countries.ggmap$lat) +
  coord_equal() +
  scale_fill_gradient(low="grey95", high="grey20", #breaks=seq(0, 50, 10),
                      na.value="#FFFFFF", name="NGOs answered about country",
                      guide=guide_colourbar(ticks=FALSE, barwidth=6)) +
  labs(title="Countries about which NGOs answered questions",
       subtitle="Q4.1: Please select a country you would like to discuss\n(One of countries selected in Q2.5)") +
  theme_ath_map() +
  theme(legend.position="bottom", legend.key.size=unit(0.65, "lines"),
        strip.background=element_rect(colour="#FFFFFF", fill="#FFFFFF"))
plot.work.map.scale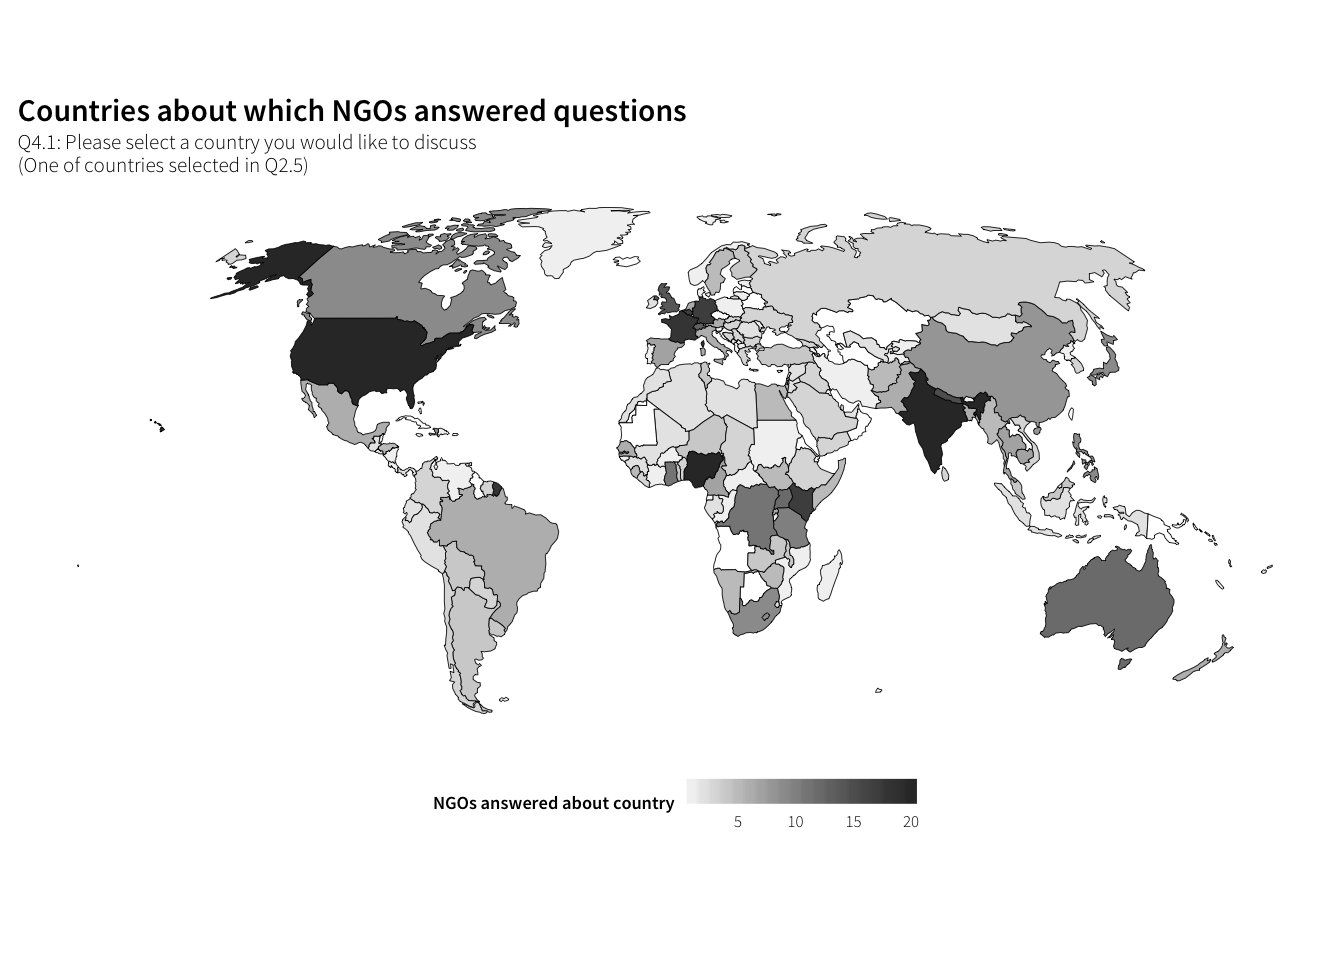
What do these NGOs do?
Which issues do these NGOs work on?
df.issues <- survey.orgs.clean %>%
  unnest(Q3.1_value) %>%
  group_by(Q3.1_value) %>%
  summarise(num = n()) %>%
  arrange(desc(num)) %>%
  filter(!is.na(Q3.1_value)) %>%
  mutate(issue = factor(Q3.1_value, levels=rev(Q3.1_value), ordered=TRUE))

plot.issues <- ggplot(df.issues, aes(x=num, y=issue)) +
  geom_barh(stat="identity") +
  scale_x_continuous(expand=c(0, 0)) +
  labs(x="Times selected", y=NULL,
       title="Which issues do NGOs work on?",
       subtitle="Q3.1: Which issues does your organization focus on? (multiple answers allowed)") +
  theme_ath()

plot.issues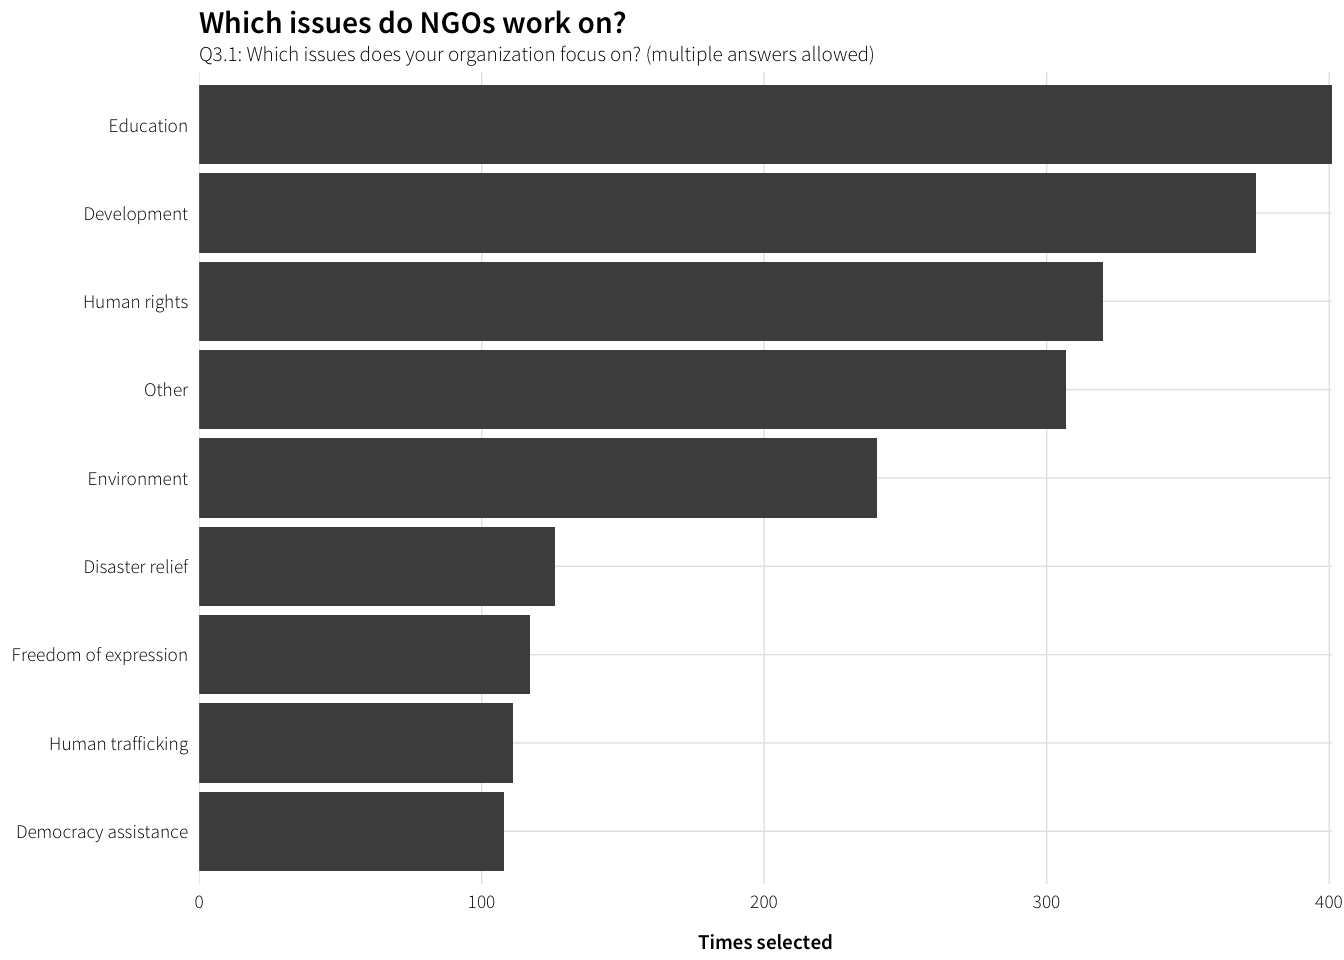
Which issues do NGOs work on the most?
df.issues.most <- survey.orgs.clean %>%
  group_by(Q3.2) %>%
  summarise(num = n()) %>%
  arrange(desc(num)) %>%
  filter(!is.na(Q3.2)) %>%
  mutate(issue = factor(Q3.2, levels=rev(Q3.2), ordered=TRUE))

plot.issues.most <- ggplot(df.issues.most, aes(x=num, y=issue)) +
  geom_barh(stat="identity") +
  scale_x_continuous(expand=c(0, 0)) +
  labs(x="Times selected", y=NULL,
       title="Which issues do NGOs work on?",
       subtitle="Q3.2: Which issues does your organization focus on the most?") +
  theme_ath()

plot.issues.most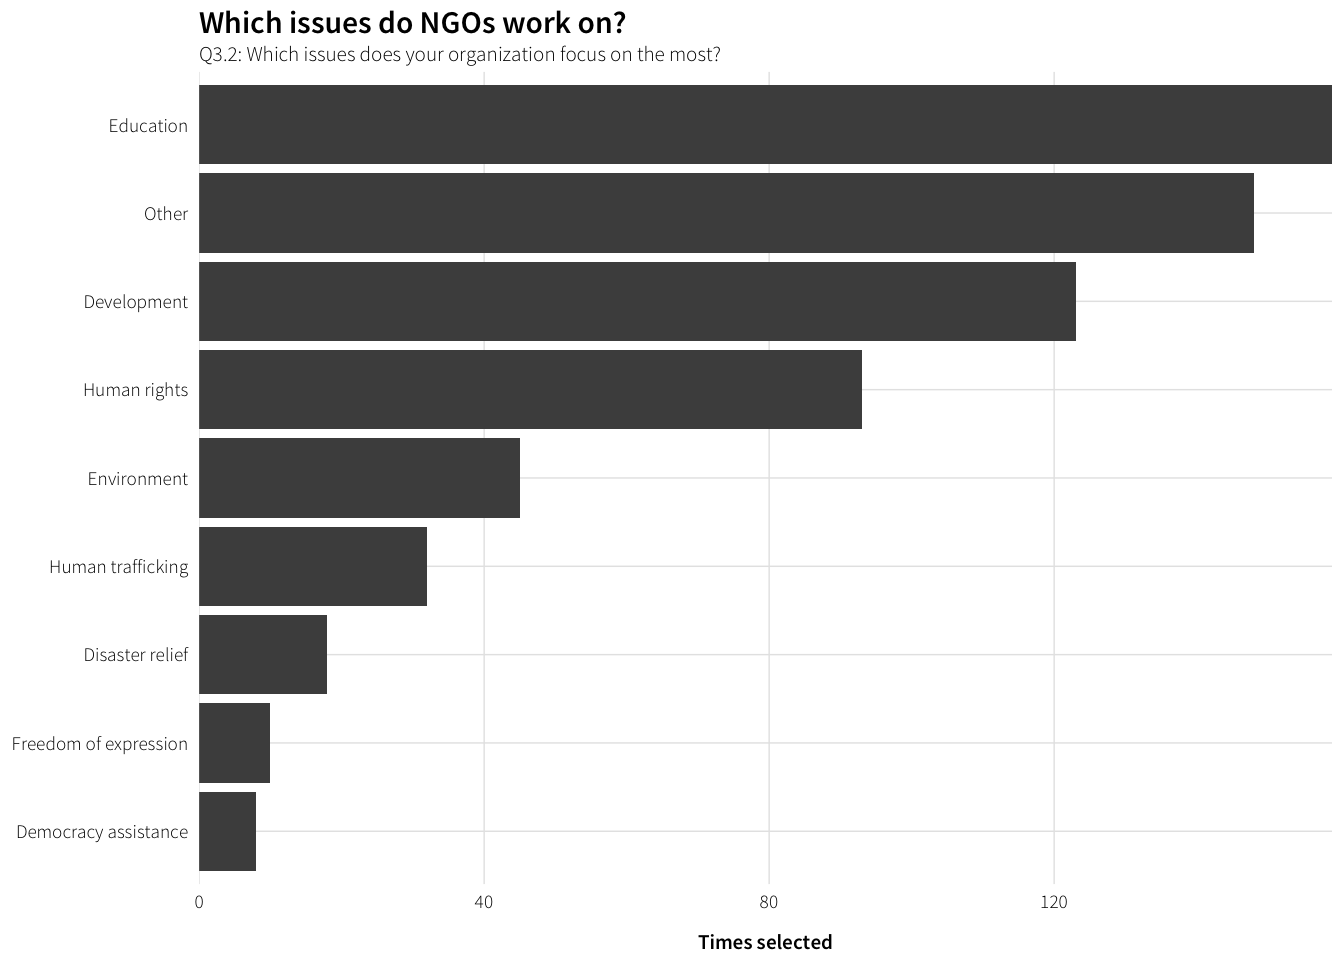
There are lots of others, both for all issues and most important issue. What are they?
df.other.issues <- survey.orgs.clean %>%
  filter(!is.na(Q3.1_other_TEXT)) %>%
  mutate(other.issue = str_to_title(Q3.1_other_TEXT)) %>%
  group_by(other.issue) %>%
  summarise(num = n()) %>%
  arrange(desc(num))

datatable(df.other.issues)
There are 300+ other issues here. That’s a lot. Natural language processing can help make sense of the mess.
# Build clean corpus for NLP
issue.corpus.df <- survey.orgs.clean %>%
  filter(!is.na(Q3.1_other_TEXT)) %>%
  mutate(other.issue = str_to_lower(Q3.1_other_TEXT)) %>%
  select(other.issue)

issue.corpus <- issue.corpus.df %>%
  DataframeSource() %>% Corpus() %>%
  tm_map(removePunctuation) %>%
  tm_map(removeNumbers) %>%
  tm_map(removeWords, stopwords("english")) %>%
  tm_map(stemDocument, language="english") %>%
  tm_map(stripWhitespace)

tdm.issues <- TermDocumentMatrix(issue.corpus)

# This works, but doesn't provide frequencies, so dplyr it is
#   findFreqTerms(tdm.issues, 5)
term.frequency <- as.data.frame(as.matrix(tdm.issues)) %>%
  mutate(term = rownames(.)) %>%
  gather(document, freq, -term) %>%
  filter(freq > 0) %>%
  group_by(term) %>%
  summarise(num = n()) %>%
  ungroup()

frequent.issues <- term.frequency %>%
  filter(num >= 5) %>%
  arrange(desc(num))
frequent.issues
## # A tibble: 39 × 2
## term num
## <chr> <int>
## 1 health 45
## 2 develop 17
## 3 right 17
## 4 women 15
## 5 cultur 11
## 6 youth 11
## 7 children 10
## 8 educ 10
## 9 research 10
## 10 intern 9
## # ... with 29 more rowsLots of NGOs deal with rights, health, and developent. Do they qualify those broader issues?
findAssocs(tdm.issues, "right", 0.1)## $right
## csr instrument mechan strengthen human minor
## 0.42 0.42 0.42 0.42 0.35 0.28
## children intern women legal achiev arab
## 0.26 0.25 0.23 0.22 0.20 0.20
## aspect audiovisu busi child citizen creation
## 0.20 0.20 0.20 0.20 0.20 0.20
## hivaid intellectu kid properti regard societi
## 0.20 0.20 0.20 0.20 0.20 0.20
## talent type victim migrant justic hous
## 0.20 0.20 0.20 0.19 0.16 0.13
## improv integr labour life peopl special
## 0.13 0.13 0.13 0.13 0.13 0.13
## protect exchang focus prison
## 0.11 0.10 0.10 0.10findAssocs(tdm.issues, "health", 0.1)## $health
## primari hiv reconcili reproduct
## 0.23 0.19 0.19 0.19
## sexual access cititenship diabet
## 0.19 0.13 0.13 0.13
## divers enterpri environment extracurricular
## 0.13 0.13 0.13 0.13
## finncial hivaid iaid incluion
## 0.13 0.13 0.13 0.13
## inclus laser less lifestyl
## 0.13 0.13 0.13 0.13
## literaci much pauvreti privileg
## 0.13 0.13 0.13 0.13
## reductionn safeti promot care
## 0.13 0.13 0.11 0.10findAssocs(tdm.issues, "develop", 0.1)## $develop
## address better chain communic effici
## 0.24 0.24 0.24 0.24 0.24
## enterpri entertain finncial harmoni incluion
## 0.24 0.24 0.24 0.24 0.24
## less lobbi non one peacekeep
## 0.24 0.24 0.24 0.24 0.24
## polit privat privileg renew researh
## 0.24 0.24 0.24 0.24 0.24
## sector volunt world econom energi
## 0.24 0.24 0.24 0.19 0.18
## capac communiti diseas etc healthcar
## 0.16 0.16 0.16 0.16 0.16
## ict infrastructur skill trade valu
## 0.16 0.16 0.16 0.16 0.16
## peacebuild intern control focus interfaith
## 0.15 0.13 0.12 0.12 0.12
## primari program wash youth
## 0.12 0.12 0.12 0.11Imputing latent themes from these other topics algorithmically is tricky though. K-means, PAM, latent semantic analysis (LSA), and latent dirichlet allocation (LDA) all choke, since the corpus isn’t that big and the “documents” are super short (often just one word long). I attempt each of these in /Analysis/ingo_survey/sandbox.R, but none of them work well, even for coarse sorting.
So, hand-coding it is.
Here are the results post-hand-coding:
df.issues.clean <- survey.orgs.clean %>%
  unnest(Q3.1.clean_value) %>%
  group_by(Q3.1.clean_value) %>%
  summarise(num = n()) %>%
  arrange(desc(num)) %>%
  filter(!is.na(Q3.1.clean_value)) %>%
  mutate(issue = factor(Q3.1.clean_value, levels=rev(Q3.1.clean_value), ordered=TRUE))

plot.issues.clean <- ggplot(df.issues.clean, aes(x=num, y=issue)) +
  geom_barh(stat="identity") +
  scale_x_continuous(expand=c(0, 0)) +
  labs(x="Times selected", y=NULL,
       title="Which issues do NGOs work on?",
       subtitle="Q3.1: Which issues does your organization focus on? (multiple answers allowed)") +
  theme_ath()

plot.issues.clean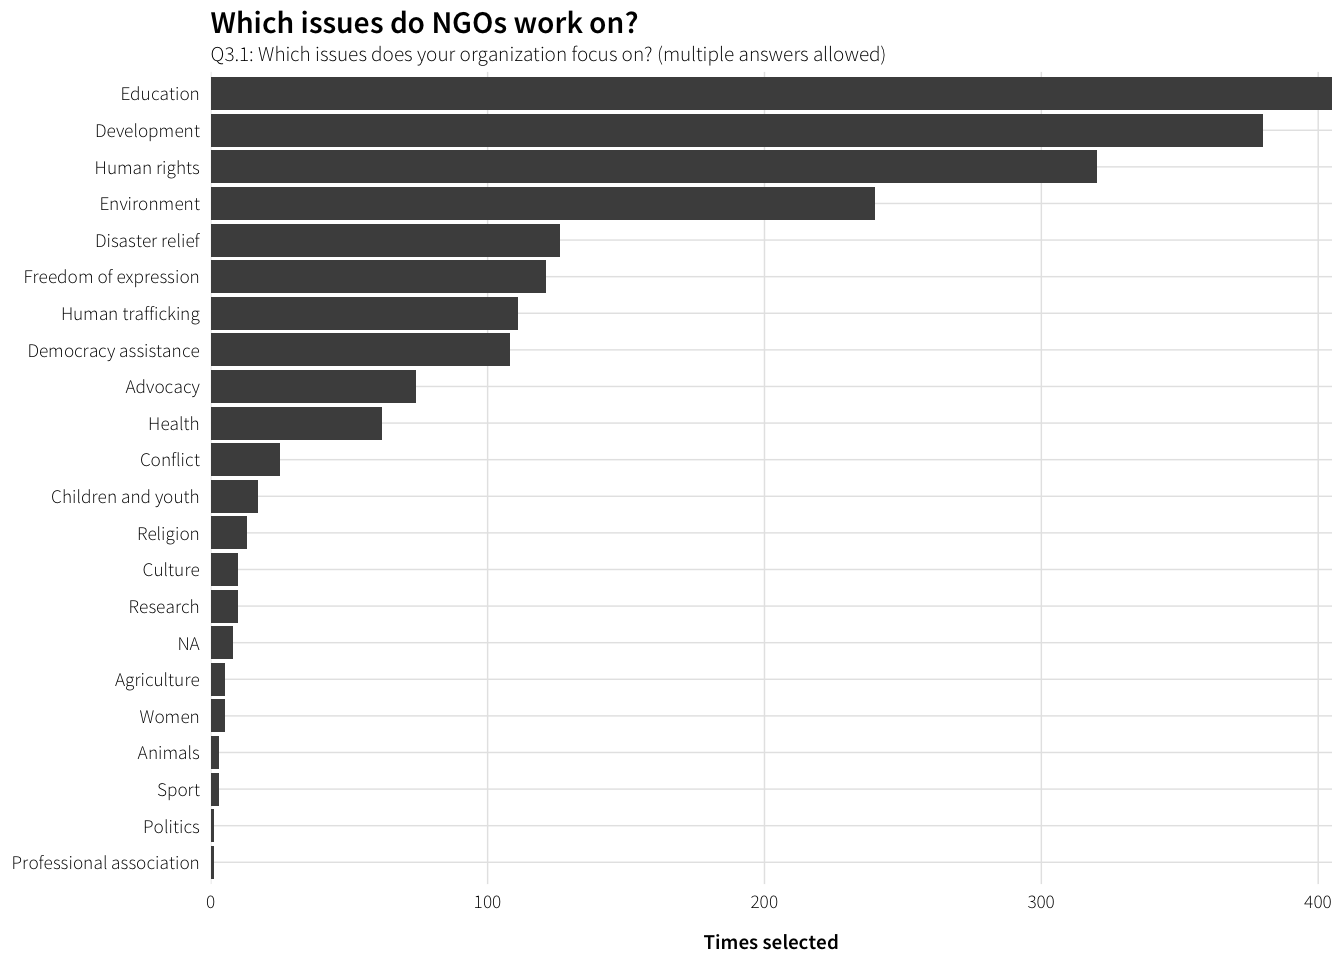
df.issues.most.clean <- survey.orgs.clean %>%
  group_by(Q3.2.clean, potential.contentiousness) %>%
  summarise(num = n()) %>%
  filter(!is.na(Q3.2.clean)) %>%
  ungroup() %>%
  arrange(desc(num)) %>%
  mutate(issue = factor(Q3.2.clean, levels=rev(unique(Q3.2.clean)), ordered=TRUE))

plot.issues.most.clean <- ggplot(df.issues.most.clean,
                                 aes(x=num, y=issue,
                                     fill=potential.contentiousness)) +
  geom_barh(stat="identity") +
  scale_x_continuous(expand=c(0, 0)) +
  scale_fill_manual(values=c("grey80", "grey40"),
                    name="Potential contentiousness") +
  labs(x="Times selected", y=NULL,
       title="Which issues do NGOs work on?",
       subtitle="Q3.2: Which issues does your organization focus on the most?") +
  theme_ath()

plot.issues.most.clean
What kinds of activities do these NGOs engage in?
labels.activities <- data_frame(levels=c("aid", "education", "mobilize",
                                         "advocacy", "monitor"),
                                labels=c("Providing direct aid and services",
                                         "Engaging in research and public education",
                                         "Mobilizing people",
                                         "Engaging in advocacy",
                                         "Monitoring and assessing the effects of policies"))

df.activities <- survey.orgs.clean %>%
  select(dplyr::contains("Q3.3"), -dplyr::contains("TEXT")) %>%
  gather(question, response) %>%
  mutate(question = str_replace(question, "Q3\\.3_", ""),
         question = factor(question, levels=labels.activities$levels,
                           labels=labels.activities$labels, ordered=TRUE)) %>%
  filter(!(response %in% c("Don't know", "Not applicable"))) %>%
  group_by(question, response) %>%
  summarise(num = n()) %>%
  ungroup() %>%
  mutate(response = factor(response, levels=levels(survey.orgs.clean$Q3.3_aid), ordered=TRUE))

plot.activities <- ggplot(df.activities, aes(y=num, x=response)) +
  geom_bar(stat="identity") +
  labs(y="Number of responses", x=NULL,
       title="What kinds of activities are NGOs engaged in?",
       subtitle="Q3.3: Please indicate how often your organization engages in each of these types of activities") +
  facet_wrap(~ question, ncol=1) +
  theme_ath()

plot.activities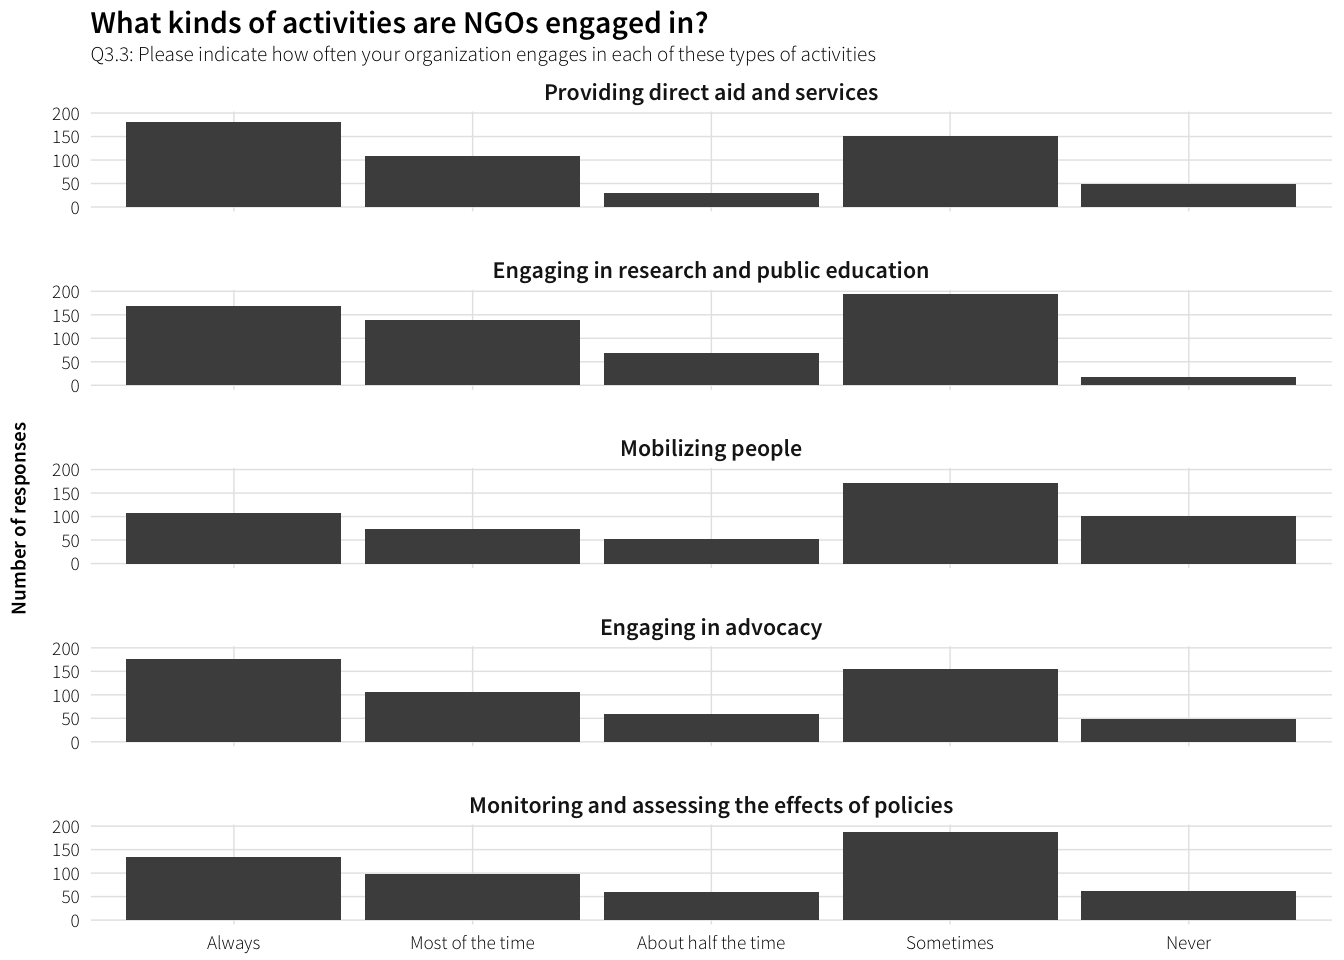
Staffing details
Full time employees
df.employees <- survey.orgs.clean %>%
  select(Q3.4.num) %>%
  filter(!is.na(Q3.4.num))

plot.employees <- ggplot(df.employees, aes(x=Q3.4.num)) +
  geom_histogram(binwidth=0.5) +
  labs(x="Number of employees (natural log)", y="Frequency",
       title="How many employees do NGOs use?",
       subtitle="Q3.4: Approximately how many full-time employees does your organization have?") +
  scale_x_continuous(trans="log1p", breaks=c(0, 10^(0:5)), labels=comma) +
  theme_ath()

plot.employees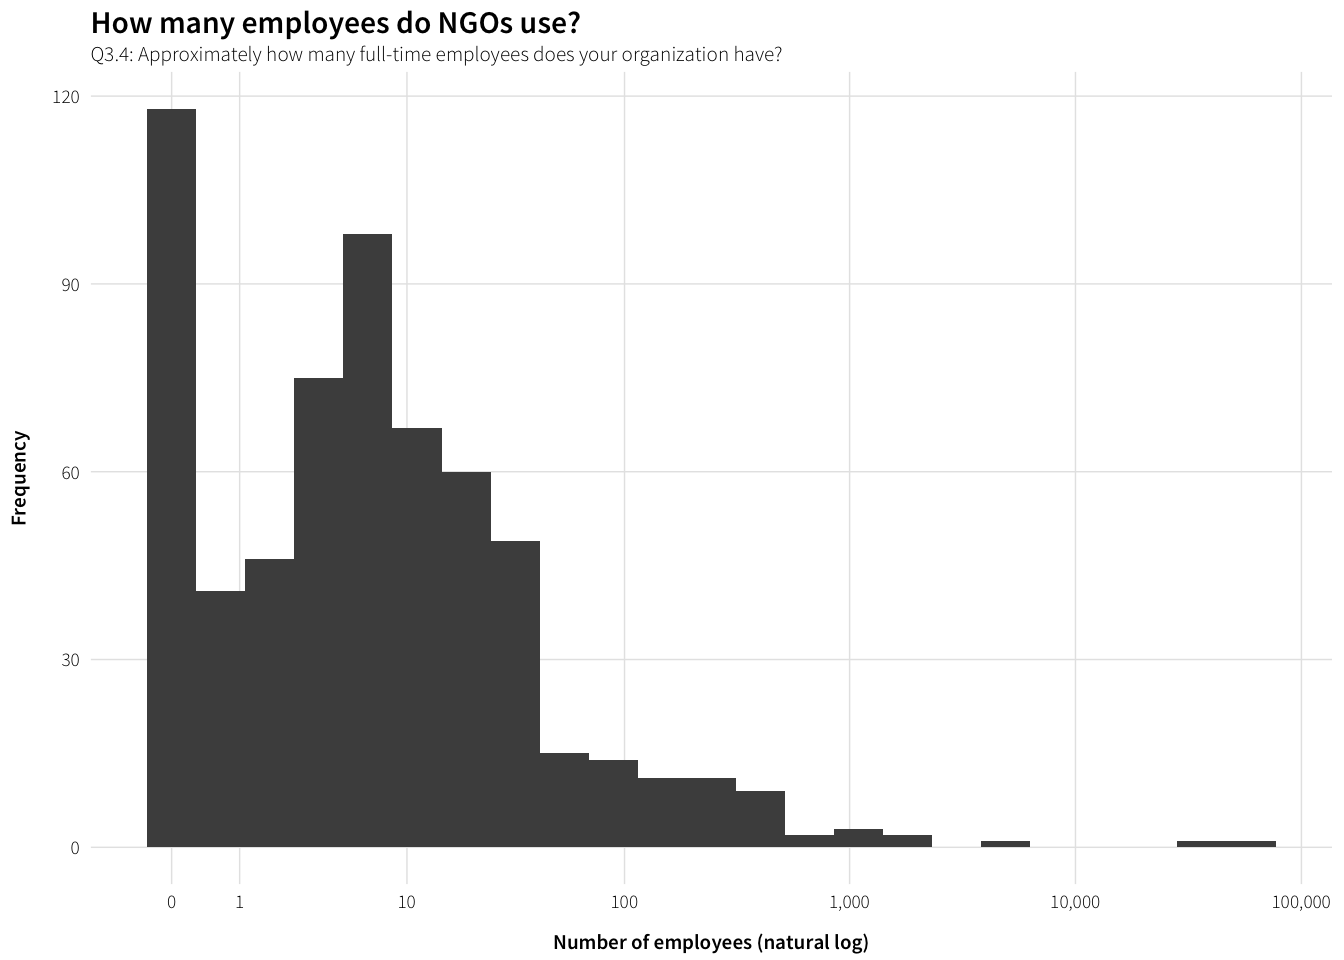
Volunteers
df.volunteers <- survey.orgs.clean %>%
  select(Q3.5.num) %>%
  filter(!is.na(Q3.5.num))

plot.volunteers <- ggplot(df.volunteers, aes(x=Q3.5.num)) +
  geom_histogram(binwidth=0.5) +
  labs(x="Number of volunteers (natural log)", y="Frequency",
       title="How many volunteers do NGOs use?",
       subtitle="Q3.5: Approximately how many volunteers does your organization have?") +
  scale_x_continuous(trans="log1p", breaks=c(0, 10^(0:6), 5000000), labels=comma) +
  theme_ath()

plot.volunteers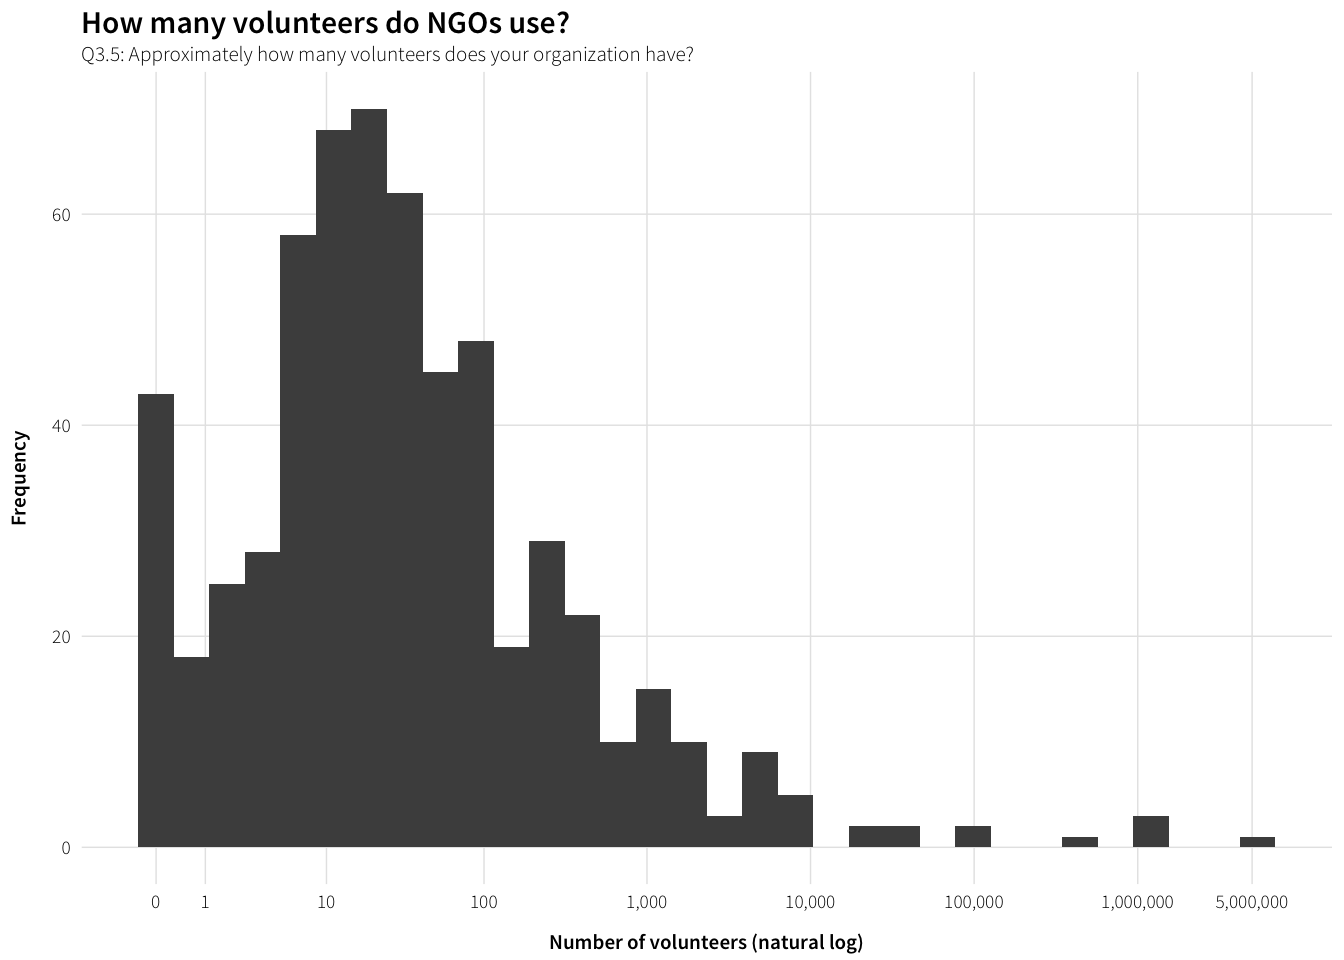
Collaboration
df.collaboration <- survey.orgs.clean %>%
  unnest(Q3.6_value) %>%
  group_by(Q3.6_value) %>%
  summarise(num = n()) %>%
  arrange(desc(num)) %>%
  filter(!is.na(Q3.6_value)) %>%
  mutate(partner = factor(Q3.6_value, levels=rev(Q3.6_value), ordered=TRUE))

# Add line break to label
levels(df.collaboration$partner)[levels(df.collaboration$partner) == "We do not collaborate with other organizations or institutions"] <-
  "We do not collaborate with other\norganizations or institutions"

plot.collaboration <- ggplot(df.collaboration, aes(x=num, y=partner)) +
  geom_barh(stat="identity") +
  scale_x_continuous(expand=c(0, 0)) +
  labs(x="Times selected", y=NULL,
       title="Do NGOs collaborate with other organizations?",
       subtitle="Q3.6: Does your organization collaborate with any of these organizations\nor institutions? (multiple answers allowed)") +
  theme_ath()

plot.collaboration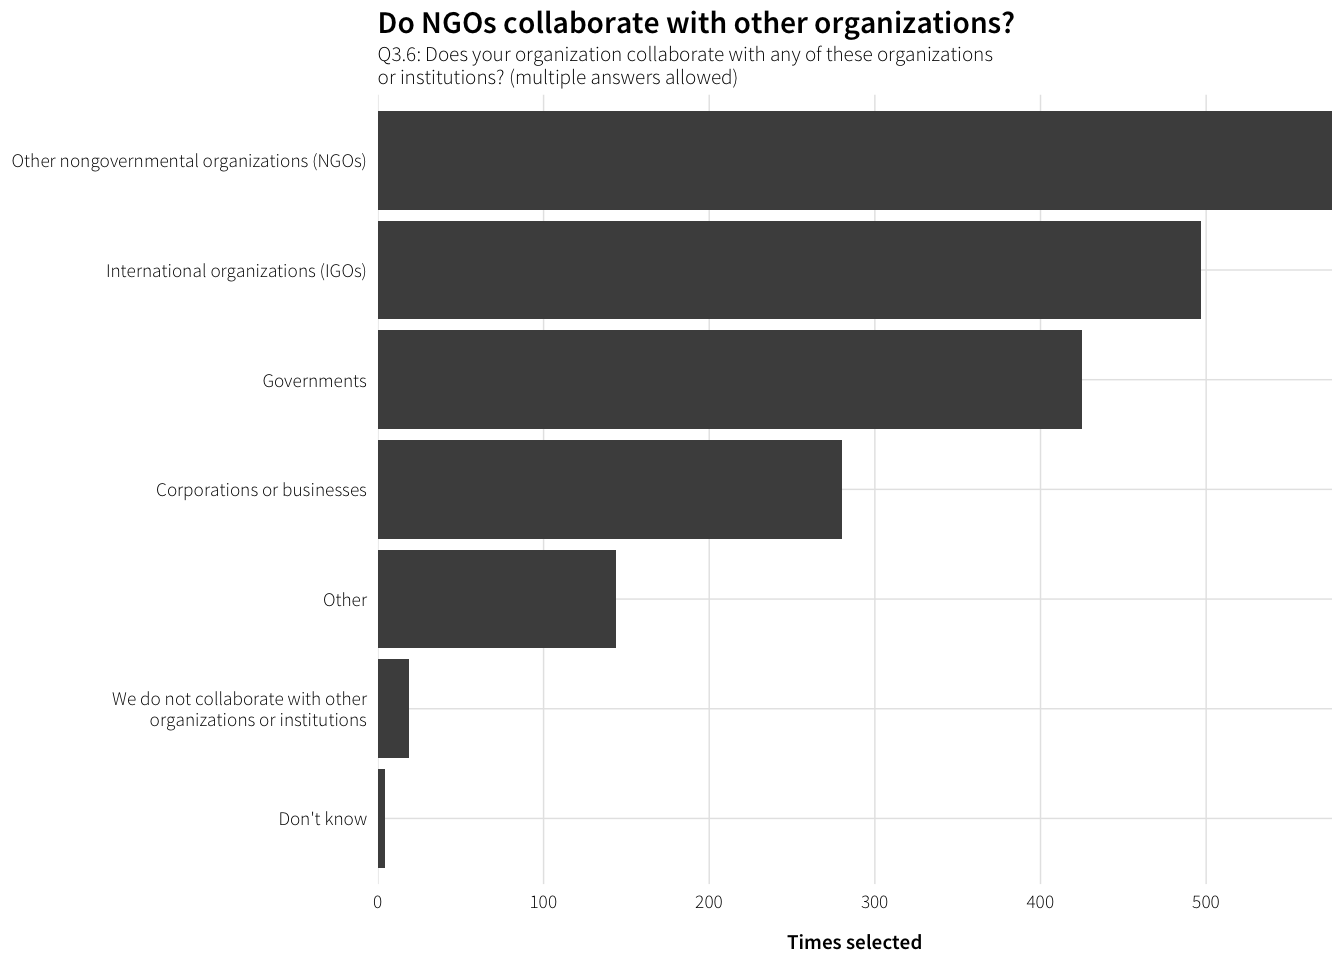
What are the other organizations?
df.collaboration.other <- survey.orgs.clean %>%
  filter(!is.na(Q3.6_other_TEXT)) %>%
  mutate(collaboration.other = str_to_title(Q3.6_other_TEXT)) %>%
  group_by(collaboration.other) %>%
  summarise(num = n()) %>%
  arrange(desc(num))

datatable(df.collaboration.other)
Seems to mostly be universities, research centers, foundations, and religious groups.
Specific organizations and institutions
Q3.7: Please list a few of the organizations or institutions you partner with most often:
df.collaboration.partners <- survey.orgs.clean %>%
  filter(!is.na(Q3.7)) %>% select(Q3.7) %>% arrange(Q3.7)

datatable(df.collaboration.partners)
Funding
labels.funding <- data_frame(levels=c("individual", "corporate", "foundation",
                                      "home_govt", "host_govt", "other"),
                             labels=c("Individual donations",
                                      "Corporate donations",
                                      "Foundation donations",
                                      "Grants from home country",
                                      "Grants from host country",
                                      "Other"))

df.funding <- survey.orgs.clean %>%
  select(dplyr::contains("Q3.8"), -dplyr::contains("TEXT")) %>%
  gather(question, response) %>%
  mutate(question = str_replace(question, "Q3\\.8_", ""),
         question = factor(question, levels=labels.funding$levels,
                           labels=labels.funding$labels, ordered=TRUE)) %>%
  filter(!(response %in% c("Don't know", "Not applicable"))) %>%
  group_by(question, response) %>%
  summarise(num = n()) %>%
  ungroup() %>%
  mutate(response = factor(response,
                           levels=levels(survey.orgs.clean$Q3.8_individual),
                           ordered=TRUE))

plot.funding <- ggplot(df.funding, aes(y=num, x=response)) +
  geom_bar(stat="identity") +
  labs(y="Number of responses", x=NULL,
       title="Where does NGO funding come from?",
       subtitle="Q3.8: How much of your organization’s funding comes from each of these sources?") +
  facet_wrap(~ question, ncol=1) +
  theme_ath()

plot.funding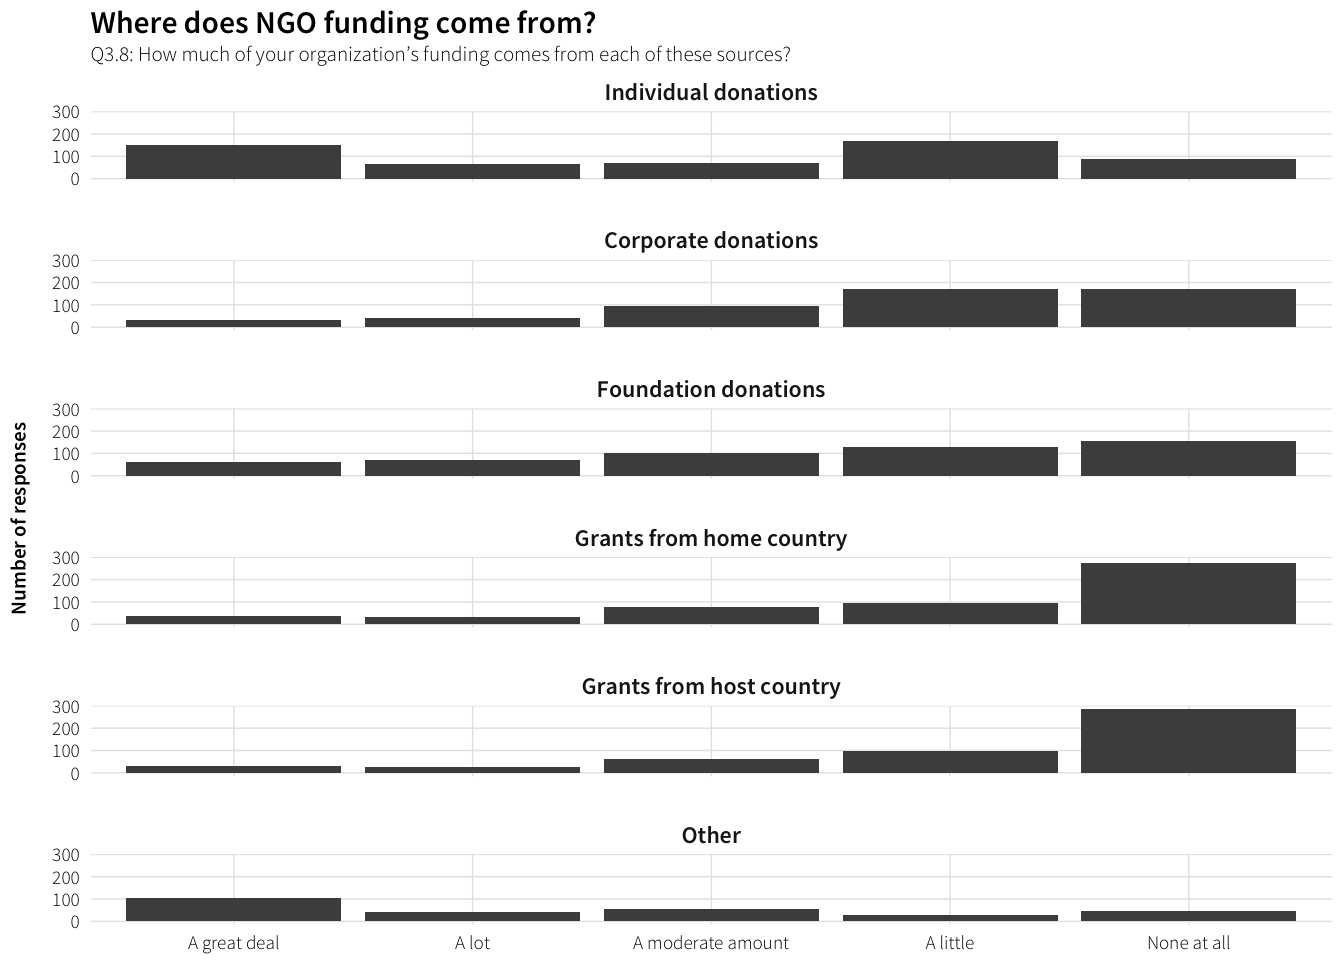
What other sources of funding do NGOs use?
df.funding.other <- survey.orgs.clean %>%
  filter(!is.na(Q3.8_other_TEXT)) %>%
  arrange(Q3.8_other_TEXT) %>% select(Q3.8_other_TEXT)

datatable(df.funding.other)
The EU, churches, membership fees, etc.
Deeper principles
What is the NGO trying to accomplish?
Q3.9: In general, what would you say your organization is trying to accomplish?
# TODO: NLP/hand code these things
df.Q3.9 <- survey.orgs.clean %>%
  filter(!is.na(Q3.9)) %>%
  arrange(Q3.9) %>% select(Q3.9)

datatable(df.Q3.9)
How are mission, vision, and values reflected in activities?
Q3.10: How is your organization’s mission, vision, and values reflected in these objectives?
df.Q3.10 <- survey.orgs.clean %>%
  filter(!is.na(Q3.10)) %>%
  arrange(Q3.10) %>% select(Q3.10)

datatable(df.Q3.10)
Have these objectives changed?
Q3.11: Have these objectives changed at all in the last 10 years? If so, how?
df.Q3.11 <- survey.orgs.clean %>%
  filter(!is.na(Q3.11)) %>%
  arrange(Q3.11) %>% select(Q3.11)

datatable(df.Q3.11)
Obstacles to objectives
Q3.12: What are the major obstacles, if any, to reaching your organization’s objectives?
df.Q3.12 <- survey.orgs.clean %>%
  filter(!is.na(Q3.12)) %>%
  arrange(Q3.12) %>% select(Q3.12)

datatable(df.Q3.12)
Desired changes in goals and strategies
Q3.13: Are there any changes that you would like to see in your organization’s goals and strategies, now or in the future?
df.Q3.13 <- survey.orgs.clean %>%
  filter(!is.na(Q3.13)) %>%
  arrange(Q3.13) %>% select(Q3.13)

datatable(df.Q3.13)
Government relations
General questions
Time in country
df.time.country <- survey.countries.clean %>%
  filter(!is.na(Q4.2)) %>%
  group_by(Q4.2) %>%
  summarise(num = n()) %>%
  ungroup() %>%
  mutate(Q4.2 = factor(Q4.2, levels=rev(levels(Q4.2)), ordered=TRUE))

plot.time.country <- ggplot(df.time.country, aes(x=num, y=Q4.2)) +
  geom_barh(stat="identity") +
  scale_x_continuous(expand=c(0, 0)) +
  labs(x="Number of responses", y=NULL,
       title="How long has the NGO worked in the country?",
       subtitle="Q4.2: How long has your organization worked in `target_country`?") +
  theme_ath()

plot.time.country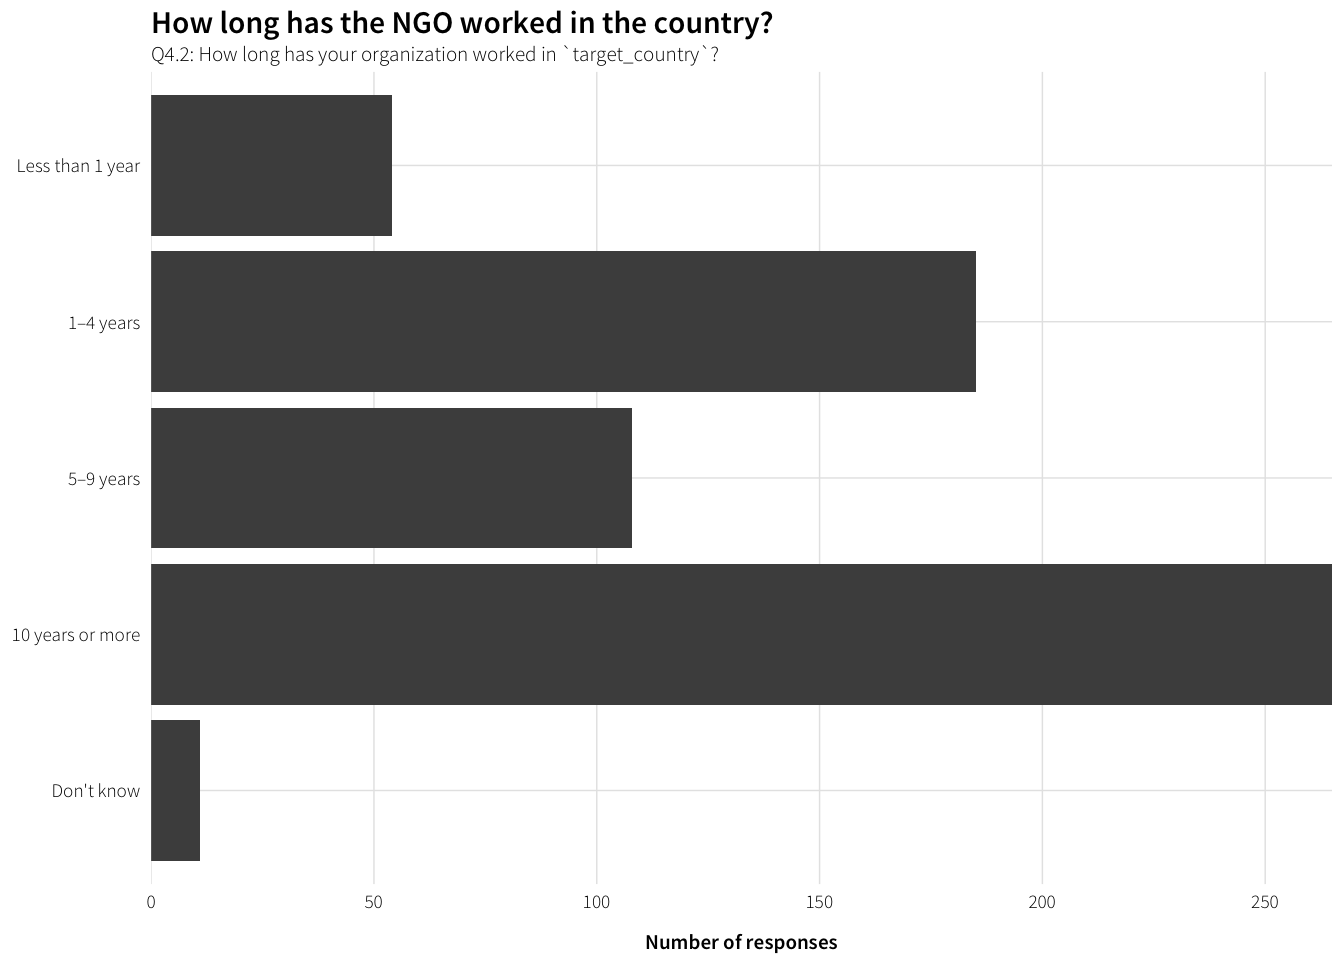
Operations in country
df.operations <- survey.countries.clean %>%
  unnest(Q4.3_value) %>%
  group_by(Q4.3_value) %>%
  summarise(num = n()) %>%
  arrange(desc(num)) %>%
  filter(!is.na(Q4.3_value)) %>%
  mutate(operation = factor(Q4.3_value, levels=rev(Q4.3_value), ordered=TRUE))

# Add line breaks to labels
levels(df.operations$operation)[levels(df.operations$operation) == "Maintain a physical office staffed primarily by people from target_country"] <-
  "Maintain a physical office staffed\nprimarily by people from target_country"
levels(df.operations$operation)[levels(df.operations$operation) == "Maintain a physical office staffed primarily by foreigners"] <-
  "Maintain a physical office staffed\nprimarily by foreigners"

plot.operations <- ggplot(df.operations, aes(x=num, y=operation)) +
  geom_barh(stat="identity") +
  scale_x_continuous(expand=c(0, 0)) +
  labs(x="Times selected", y=NULL,
       title="How do NGOs work in the target country?",
       subtitle="Q4.3: What does your organization do in `target_country`? (multiple answers allowed)") +
  theme_ath()

plot.operations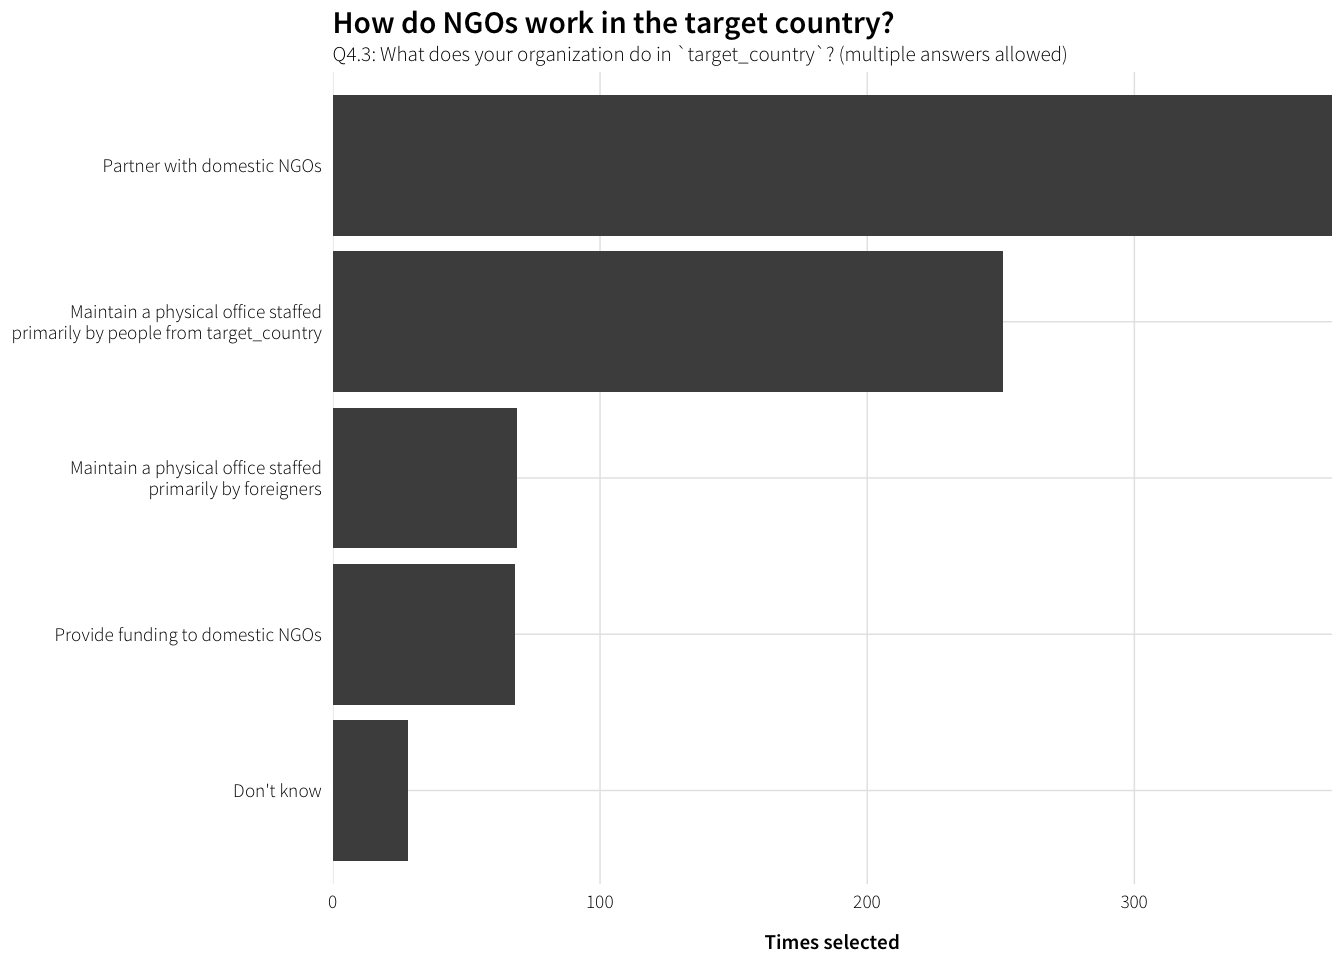
Is the NGO registered?
df.registered <- survey.countries.clean %>%
  filter(!is.na(Q4.4)) %>%
  group_by(Q4.4) %>%
  summarise(num = n()) %>%
  ungroup() %>%
  mutate(Q4.4 = factor(Q4.4, levels=rev(levels(Q4.4)), ordered=TRUE))

plot.registered <- ggplot(df.registered, aes(x=num, y=Q4.4)) +
  geom_barh(stat="identity") +
  scale_x_continuous(expand=c(0, 0)) +
  labs(x="Number of responses", y=NULL,
       title="Is the NGO registered?",
       subtitle="Q4.4: Is your organization registered with the national government in `target_country`?") +
  theme_ath()

plot.registered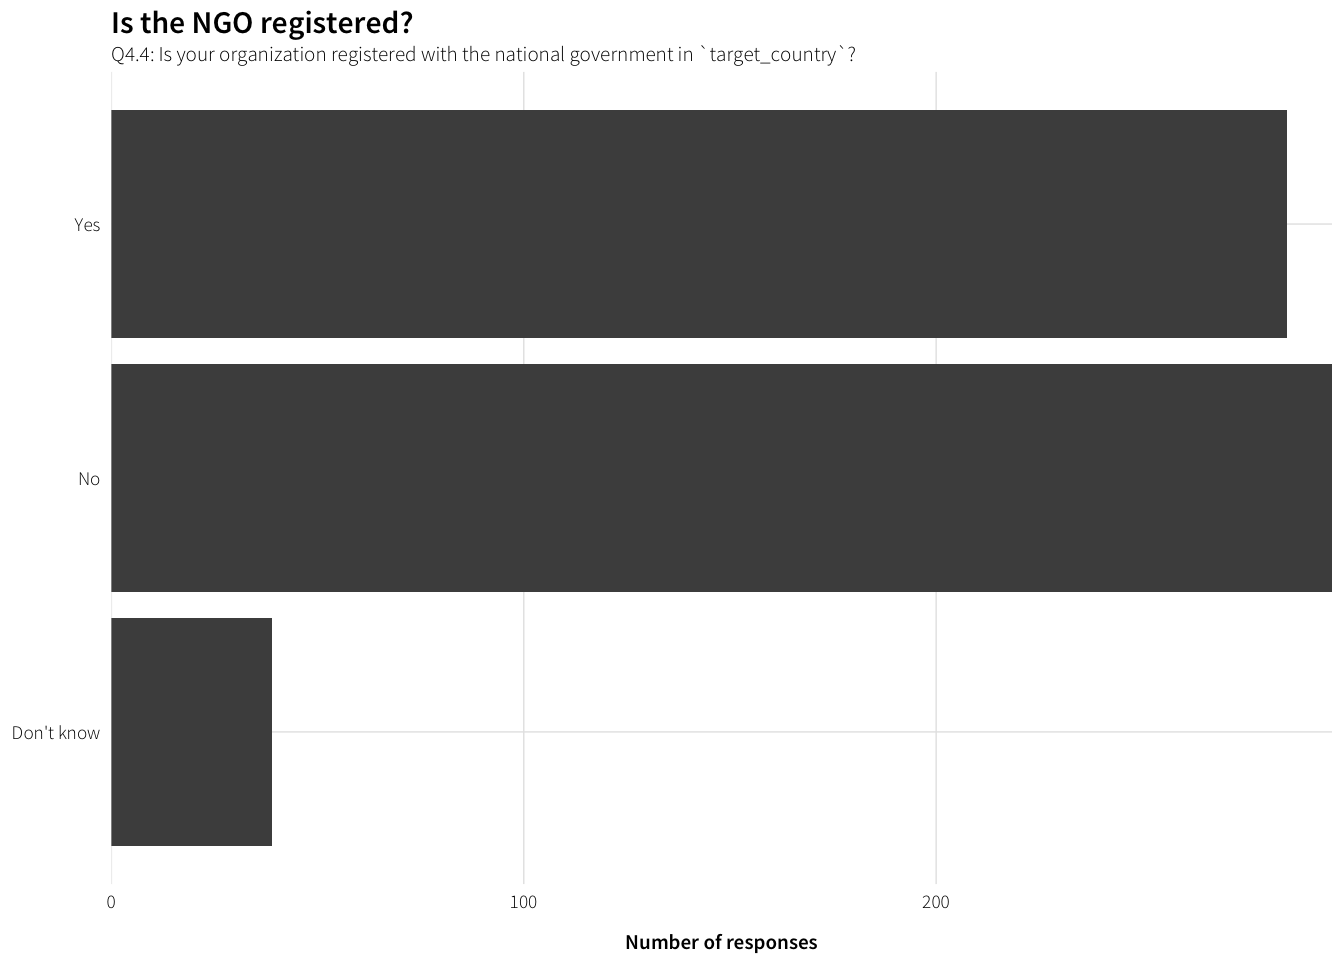
Contact with government
Frequency of government contact
df.freq.contact <- survey.countries.clean %>%
  filter(!is.na(Q4.5)) %>%
  group_by(Q4.5) %>%
  summarise(num = n()) %>%
  ungroup() %>%
  mutate(Q4.5 = factor(Q4.5, levels=rev(levels(Q4.5)), ordered=TRUE))

plot.freq.contact <- ggplot(df.freq.contact, aes(x=num, y=Q4.5)) +
  geom_barh(stat="identity") +
  scale_x_continuous(expand=c(0, 0)) +
  labs(x="Number of responses", y=NULL,
       title="How often does the NGO contact government?",
       subtitle="Q4.5: About how often does your organization have contact with\ngovernment or party officials in `target_country`?") +
  theme_ath()

plot.freq.contact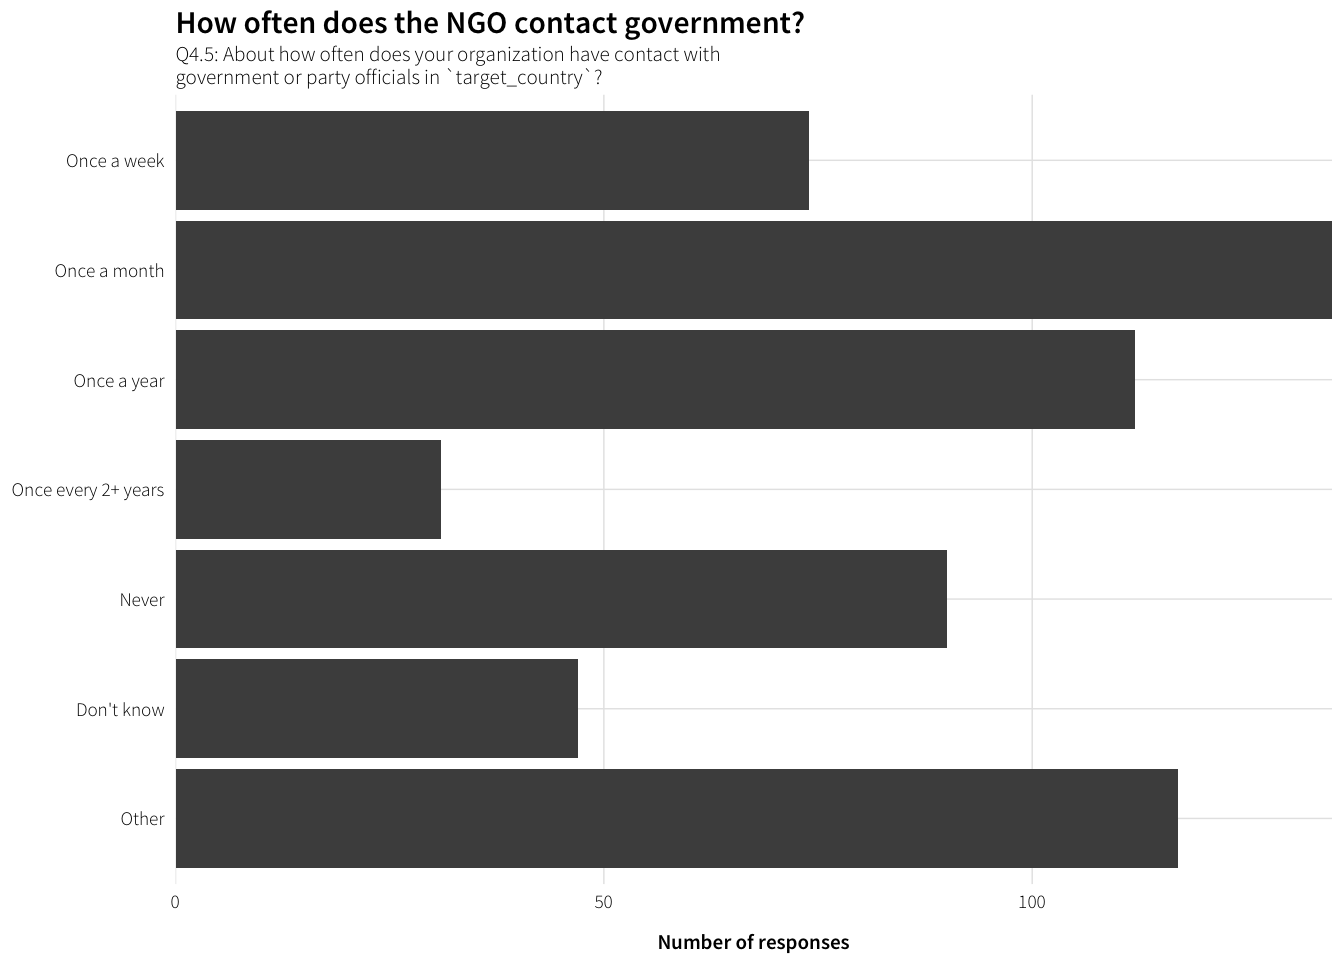
What other kinds of frequency do people report?
df.freq.contact.other <- survey.countries.clean %>%
  filter(!is.na(Q4.5_TEXT)) %>%
  mutate(other.freq = str_to_title(Q4.5_TEXT)) %>%
  group_by(other.freq) %>%
  summarise(num = n()) %>%
  arrange(desc(num))

datatable(df.freq.contact.other)
With all the other options cleaned up
df.freq.contact.clean <- survey.countries.clean %>%
  filter(!is.na(Q4.5.clean)) %>%
  group_by(Q4.5.clean) %>%
  summarise(num = n()) %>%
  ungroup() %>%
  mutate(Q4.5.clean = factor(Q4.5.clean, levels=rev(levels(Q4.5.clean)),
                             ordered=TRUE))

plot.freq.contact.clean <- ggplot(df.freq.contact.clean,
                                  aes(x=num, y=Q4.5.clean)) +
  geom_barh(stat="identity") +
  scale_x_continuous(expand=c(0, 0)) +
  labs(x="Number of responses", y=NULL,
       title="How often does the NGO contact government?",
       subtitle="Q4.5: About how often does your organization have contact with\ngovernment or party officials in `target_country`?") +
  theme_ath()

plot.freq.contact.clean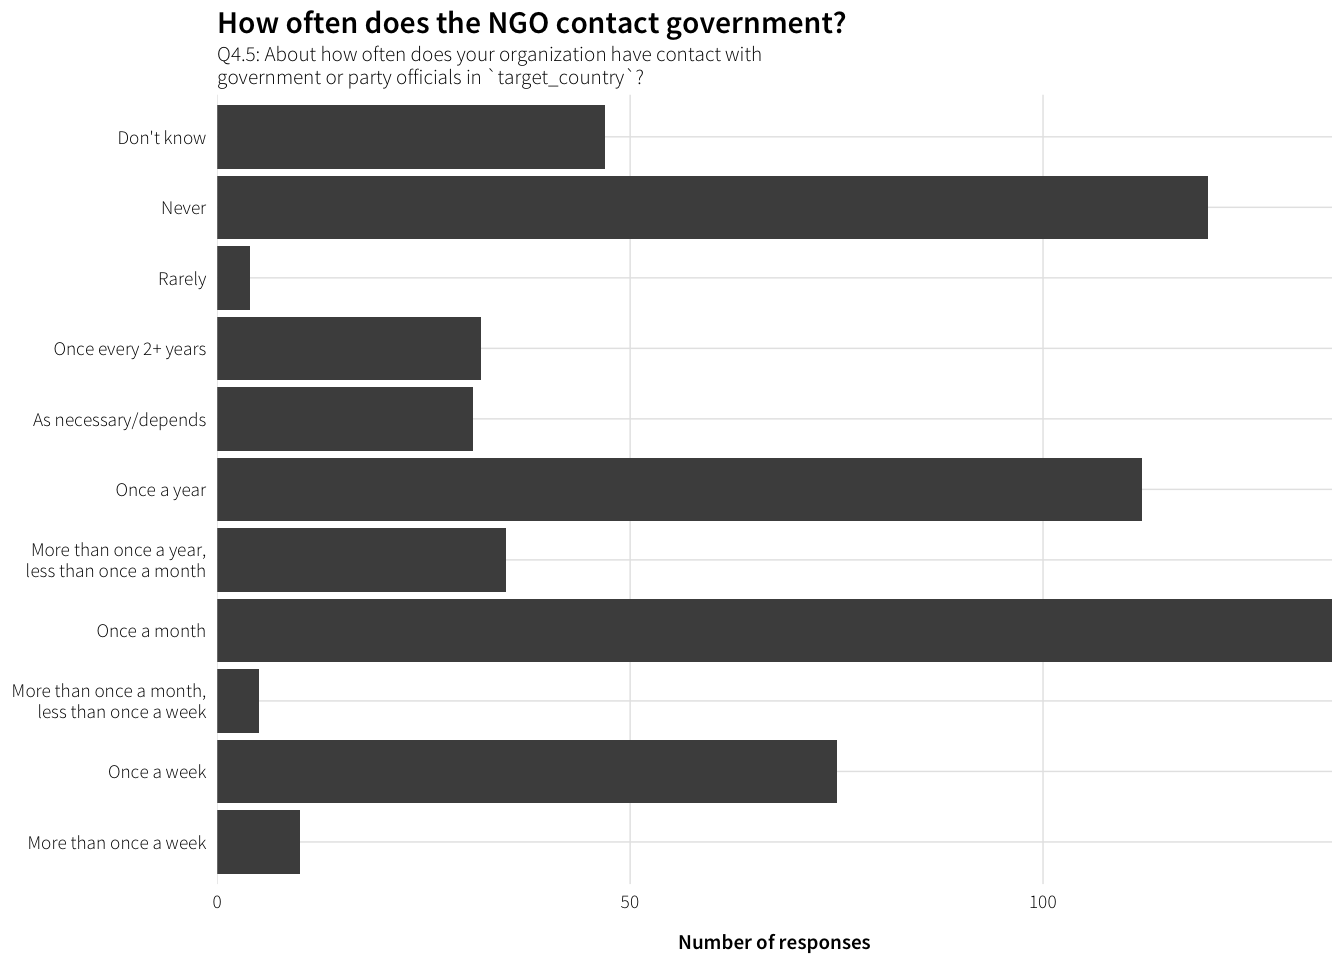
Frequency of reporting to government
df.freq.report <- survey.countries.clean %>%
  filter(!is.na(Q4.8)) %>%
  group_by(Q4.8) %>%
  summarise(num = n()) %>%
  ungroup() %>%
  mutate(Q4.8 = factor(Q4.8, levels=rev(levels(Q4.8)), ordered=TRUE))

plot.freq.report <- ggplot(df.freq.report, aes(x=num, y=Q4.8)) +
  geom_barh(stat="identity") +
  scale_x_continuous(expand=c(0, 0)) +
  labs(x="Number of responses", y=NULL,
       title="How often does the NGO report to government?",
       subtitle="Q4.8: How often is your organization required to report to the government of  `target_country`?") +
  theme_ath()

plot.freq.report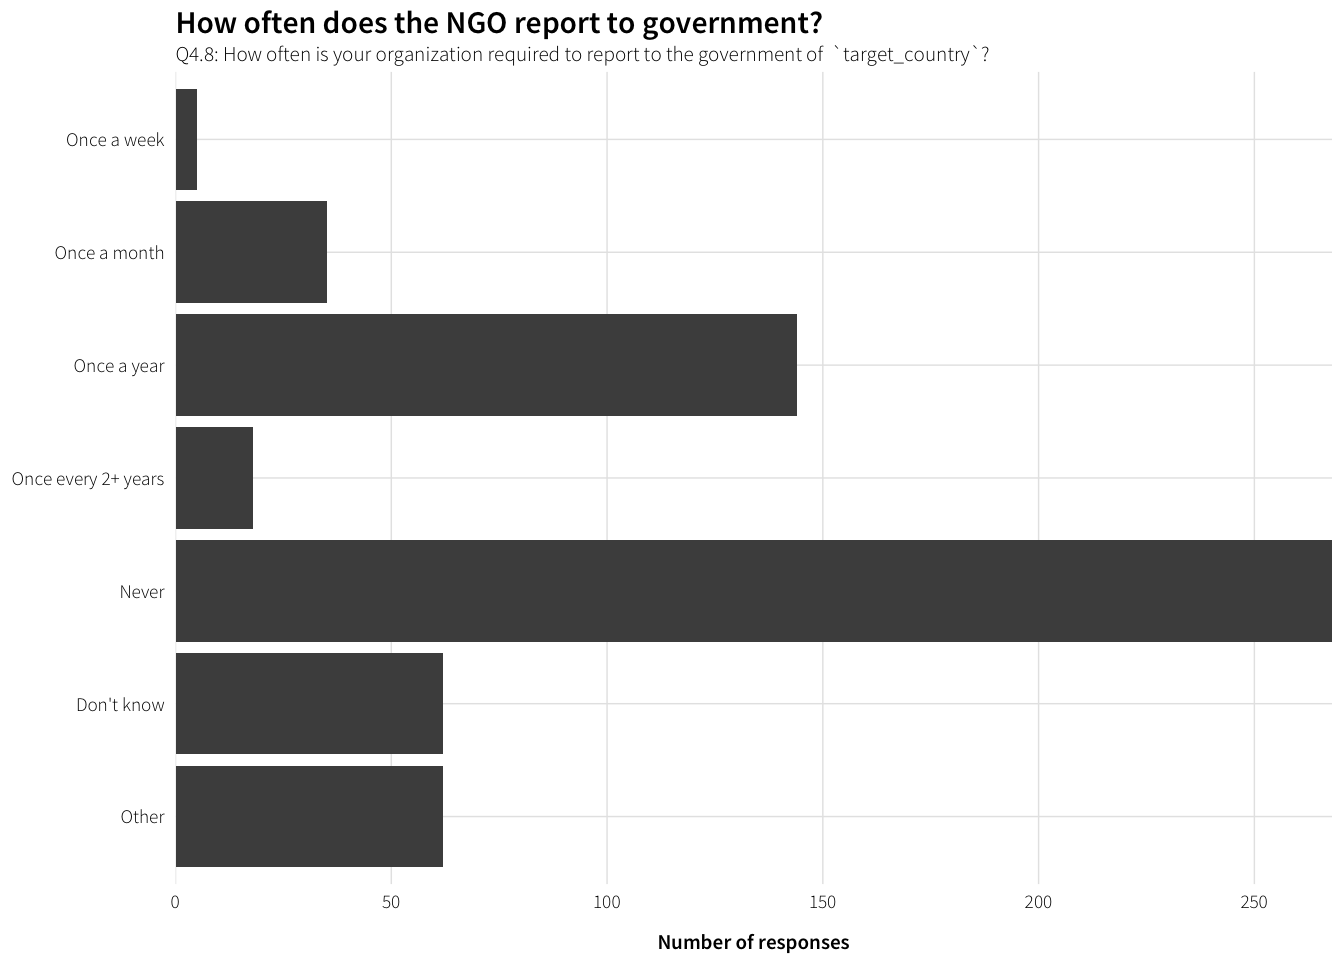
What other kinds of frequency do people report?
df.freq.report.other <- survey.countries.clean %>%
  filter(!is.na(Q4.8_TEXT)) %>%
  select(Q4.8_TEXT) %>%
  arrange(Q4.8_TEXT)

datatable(df.freq.report.other)
With all the other options cleaned up
df.freq.report.clean <- survey.countries.clean %>%
  filter(!is.na(Q4.8.clean)) %>%
  group_by(Q4.8.clean) %>%
  summarise(num = n()) %>%
  ungroup() %>%
  mutate(Q4.8.clean = factor(Q4.8.clean, levels=rev(levels(Q4.8.clean)),
                             ordered=TRUE))

plot.freq.report.clean <- ggplot(df.freq.report.clean,
                                  aes(x=num, y=Q4.8.clean)) +
  geom_barh(stat="identity") +
  scale_x_continuous(expand=c(0, 0)) +
  labs(x="Number of responses", y=NULL,
       title="How often does the NGO report to government?",
       subtitle="Q4.8: How often is your organization required to report to the government of  `target_country`?") +
  theme_ath()

plot.freq.report.clean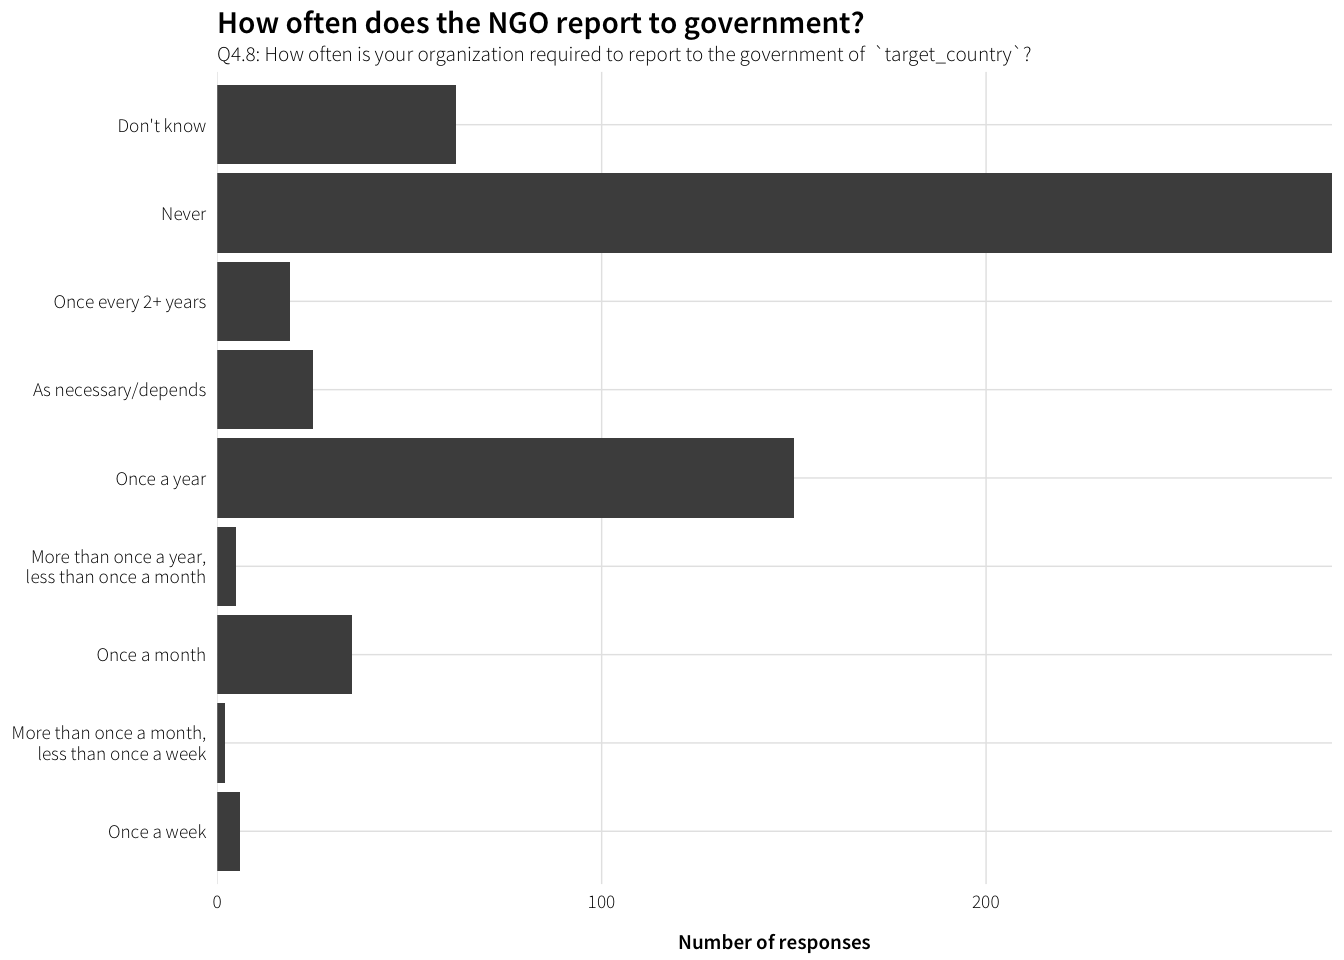
Kinds of government officials NGOs have contact with
df.officials.contact <- survey.countries.clean %>%
  unnest(Q4.6_value) %>%
  group_by(Q4.6_value) %>%
  summarise(num = n()) %>%
  arrange(desc(num)) %>%
  filter(!is.na(Q4.6_value)) %>%
  mutate(official = factor(Q4.6_value, levels=rev(Q4.6_value), ordered=TRUE))

plot.officials.contact <- ggplot(df.officials.contact, aes(x=num, y=official)) +
  geom_barh(stat="identity") +
  scale_x_continuous(expand=c(0, 0)) +
  labs(x="Times selected", y=NULL,
       title="Which officials do NGOs report to?",
       subtitle="Q4.6: What kind of government officials does your organization have contact with? (multiple answers allowed)") +
  theme_ath()

plot.officials.contact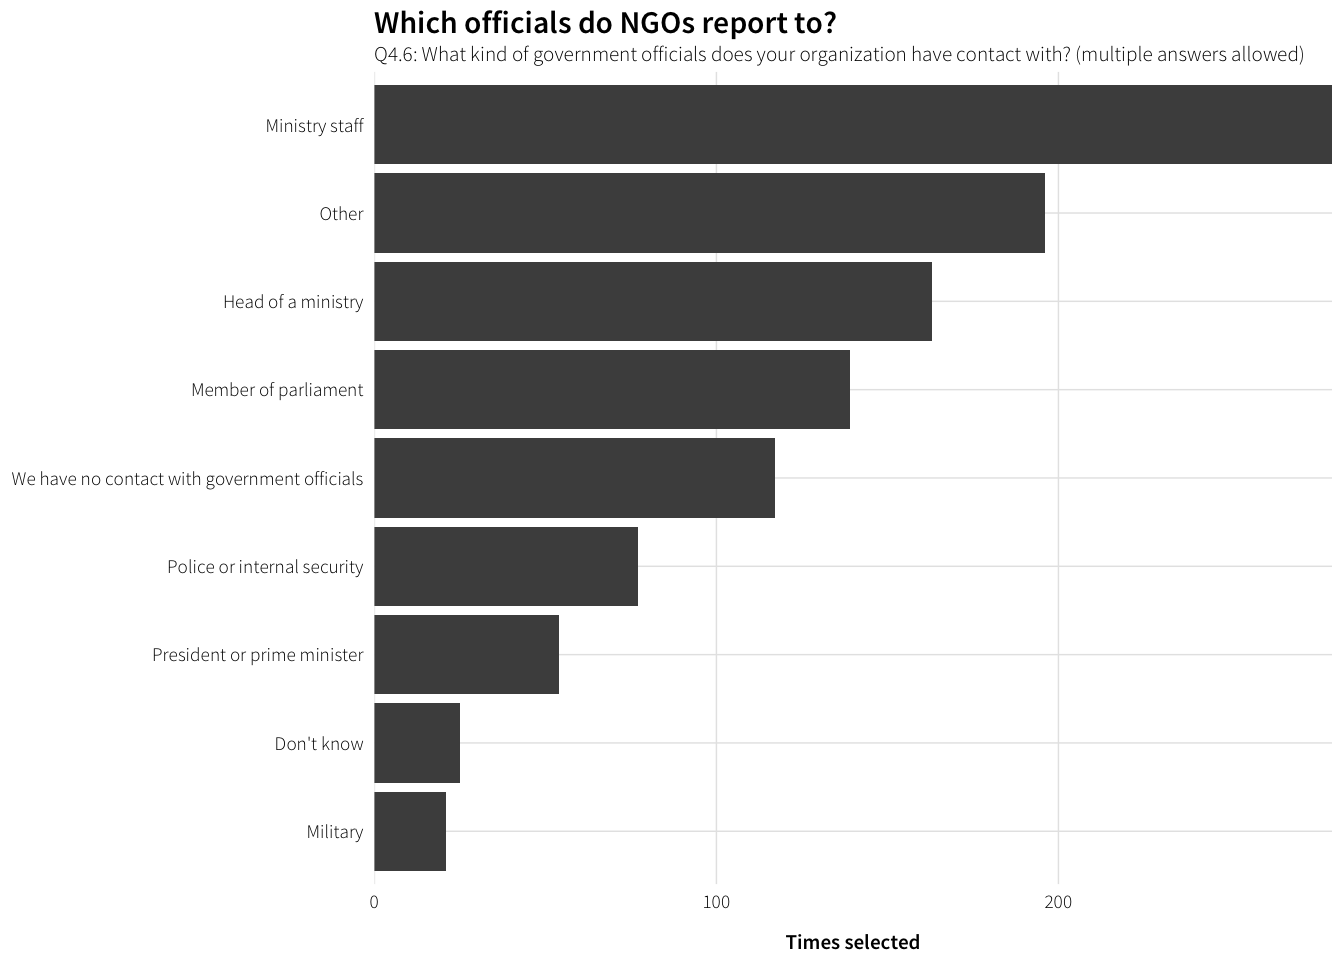
And the others?
df.officials.contact.other <- survey.countries.clean %>%
  filter(!is.na(Q4.6_other_TEXT)) %>%
  mutate(official = str_to_title(Q4.6_other_TEXT)) %>%
  group_by(official) %>%
  summarise(num = n()) %>%
  arrange(desc(num))

datatable(df.officials.contact.other)
Officials reported to the most
df.officials.contact.most <- survey.countries.clean %>%
  group_by(Q4.7) %>%
  summarise(num = n()) %>%
  arrange(desc(num)) %>%
  filter(!is.na(Q4.7)) %>%
  mutate(issue = factor(Q4.7, levels=rev(Q4.7), ordered=TRUE))

plot.officials.contact.most <- ggplot(df.officials.contact.most,
                                      aes(x=num, y=issue)) +
  geom_barh(stat="identity") +
  scale_x_continuous(expand=c(0, 0)) +
  labs(x="Times selected", y=NULL,
       title="Which officials do NGOs report to the most?",
       subtitle="Q4.7: What kind of government officials does your organization have contact with most often?") +
  theme_ath()

plot.officials.contact.most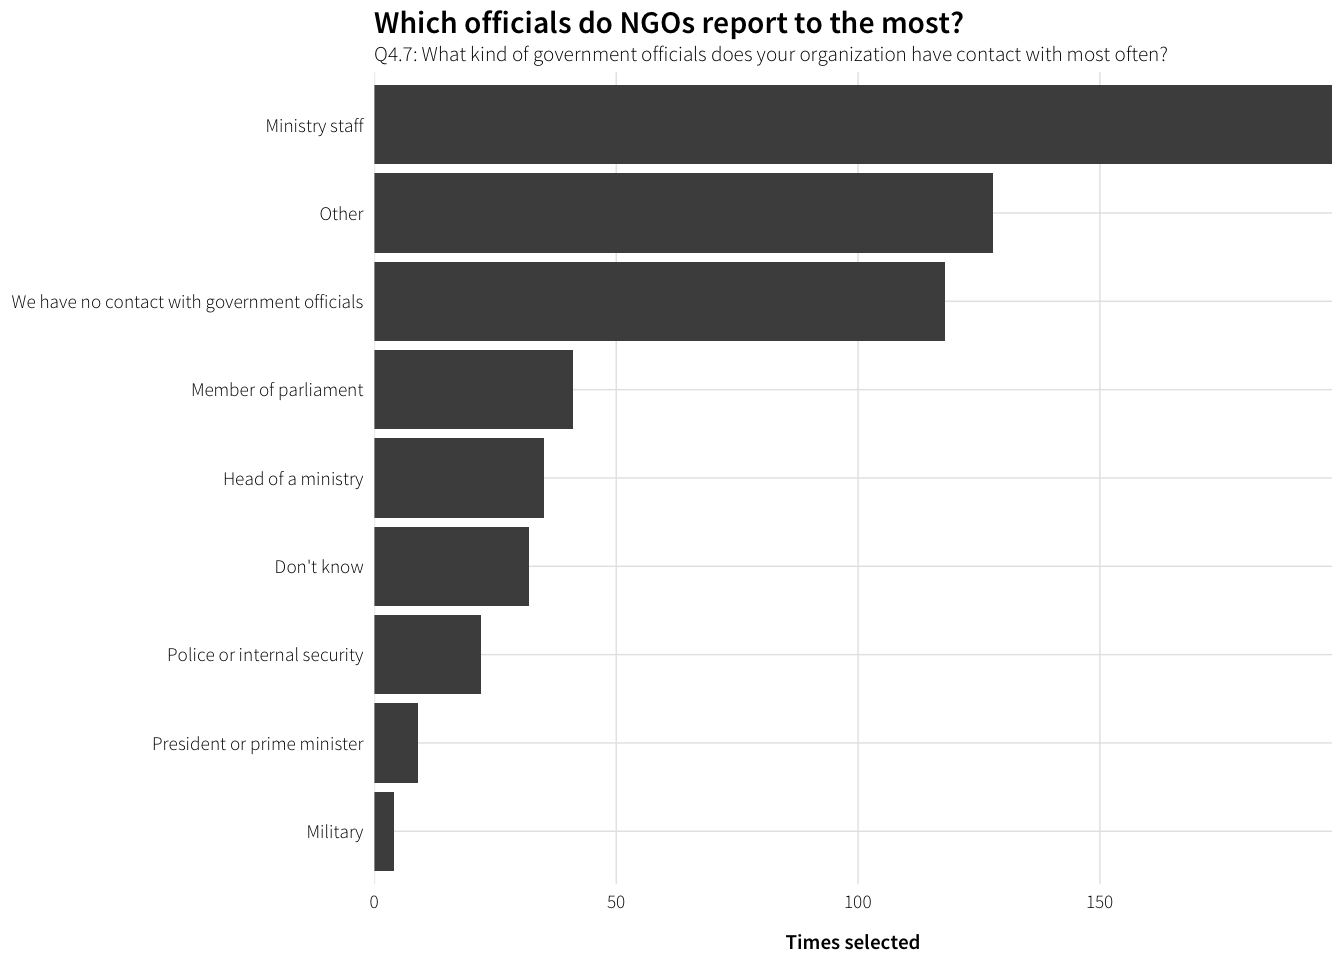
Who are the others?
df.officials.contact.most.other <- survey.countries.clean %>%
  filter(!is.na(Q4.7_TEXT)) %>%
  rename(official = Q4.7_TEXT) %>%
  group_by(official) %>%
  summarise(num = n()) %>%
  arrange(desc(num))

datatable(df.officials.contact.most.other)
Are members of the government involved in work?
df.govt.involved <- survey.countries.clean %>%
  filter(!is.na(Q4.9)) %>%
  group_by(Q4.9) %>%
  summarise(num = n()) %>%
  ungroup() %>%
  mutate(Q4.9 = factor(Q4.9, levels=rev(levels(Q4.9)), ordered=TRUE))

plot.govt.involved <- ggplot(df.govt.involved, aes(x=num, y=Q4.9)) +
  geom_barh(stat="identity") +
  scale_x_continuous(expand=c(0, 0)) +
  labs(x="Number of responses", y=NULL,
       title="Is the government involved in the NGO's work?",
       subtitle="Q4.9: Are members of the government or ruling party of `target_country` involved in your work?") +
  theme_ath()

plot.govt.involved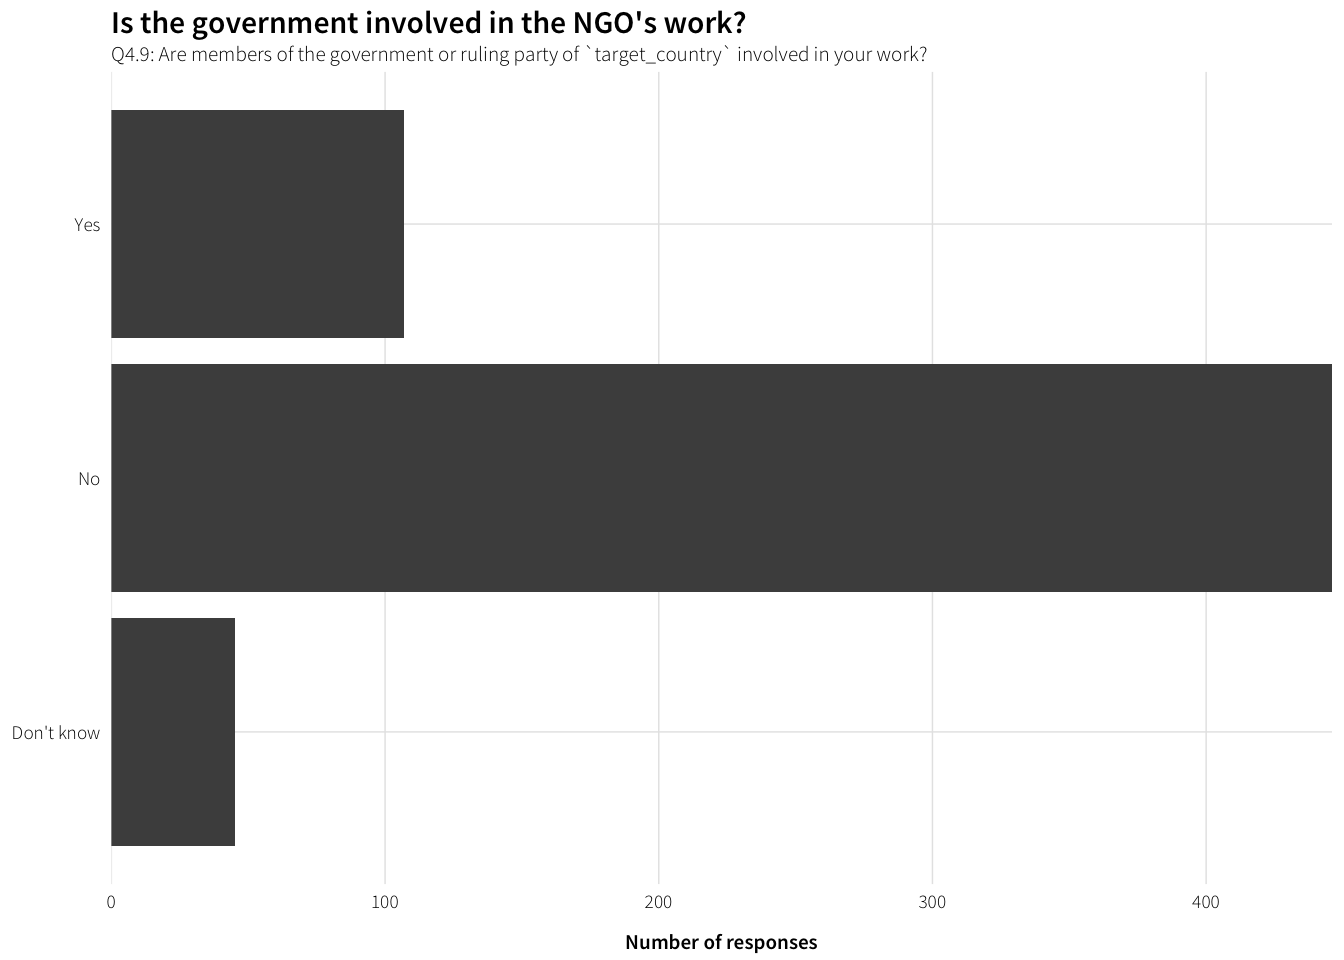
How is government involved in work?
Q4.10: How is the government of `target_country`` involved in your work?
df.Q4.10 <- survey.countries.clean %>%
  filter(!is.na(Q4.10)) %>%
  arrange(Q4.10) %>% select(Q4.10)

datatable(df.Q4.10)
Relationship with government
Positivity of relationship
df.govt.positivity <- survey.countries.clean %>%
  filter(!is.na(Q4.11)) %>%
  group_by(Q4.11) %>%
  summarise(num = n()) %>%
  ungroup() %>%
  mutate(Q4.11 = factor(Q4.11, levels=rev(levels(Q4.11)), ordered=TRUE))

plot.govt.positivity <- ggplot(df.govt.positivity, aes(x=num, y=Q4.11)) +
  geom_barh(stat="identity") +
  scale_x_continuous(expand=c(0, 0)) +
  labs(x="Number of responses", y=NULL,
       title="How is the NGO's relationship with the government?",
       subtitle="Q4.11: How would you characterize your organization’s relationship with the government of `target_country`?") +
  theme_ath()

plot.govt.positivity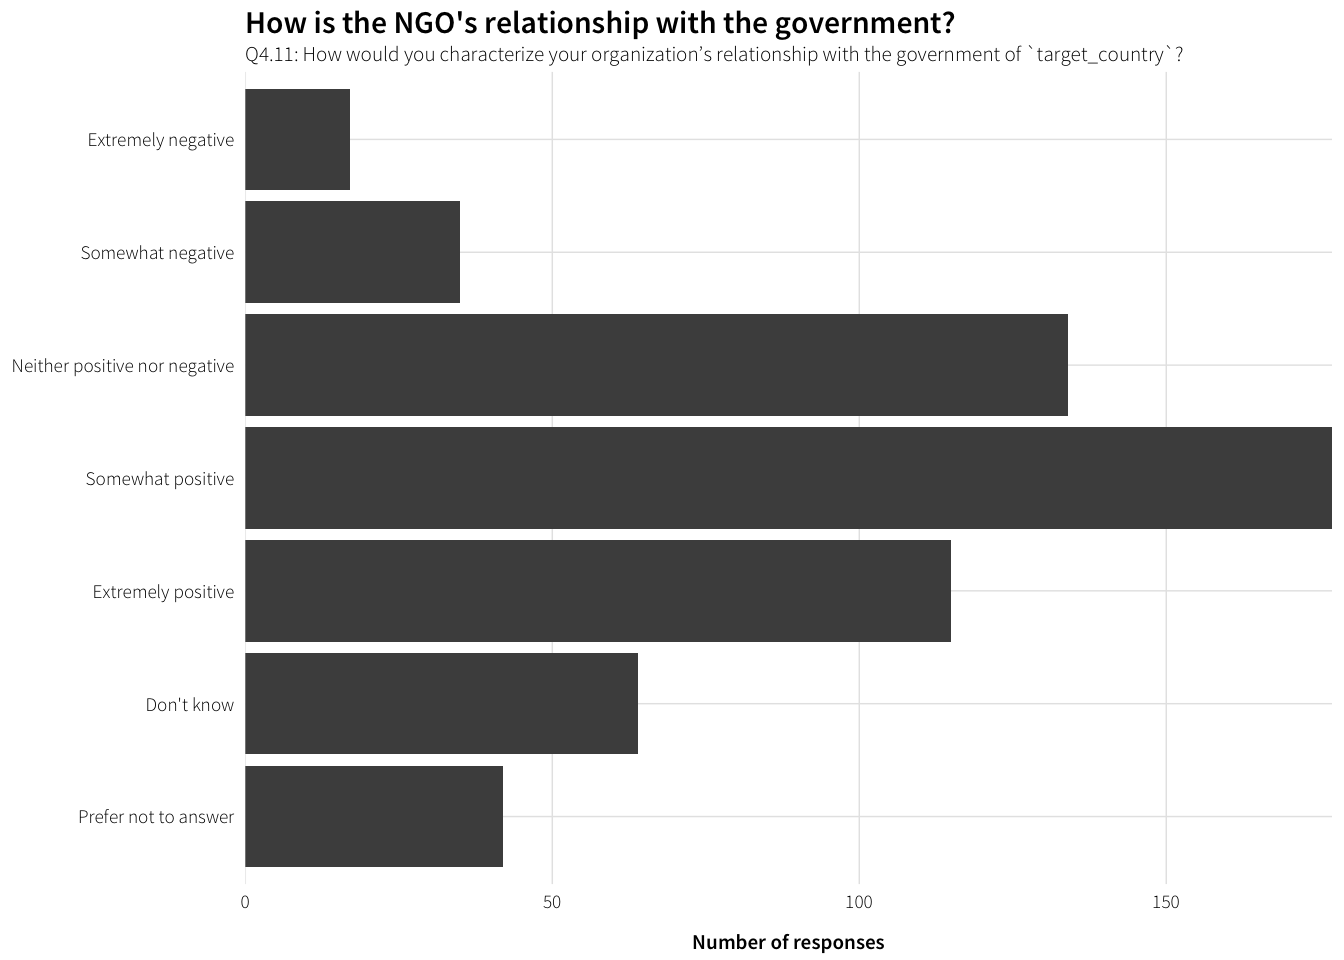
Description of relationship
Q4.12: Briefly describe your organization’s relationship with the government of target_country:
df.Q4.12 <- survey.countries.clean %>%
  filter(!is.na(Q4.12)) %>%
  arrange(Q4.12) %>% select(Q4.12)

datatable(df.Q4.12)
NGO regulations and restrictions
Familiarity with regulations
df.reg.familiarity <- survey.countries.clean %>%
  filter(!is.na(Q4.13)) %>%
  group_by(Q4.13) %>%
  summarise(num = n()) %>%
  ungroup() %>%
  mutate(Q4.13 = factor(Q4.13, levels=rev(levels(Q4.13)), ordered=TRUE))

plot.reg.familiarity <- ggplot(df.reg.familiarity, aes(x=num, y=Q4.13)) +
  geom_barh(stat="identity") +
  scale_x_continuous(expand=c(0, 0)) +
  labs(x="Number of responses", y=NULL,
       title="How familiar are NGOs with regulations?",
       subtitle="Q4.13: How familiar is your organization with regulations for\ninternational nongovernmental organizations (NGOs) in `target_country`?") +
  theme_ath()

plot.reg.familiarity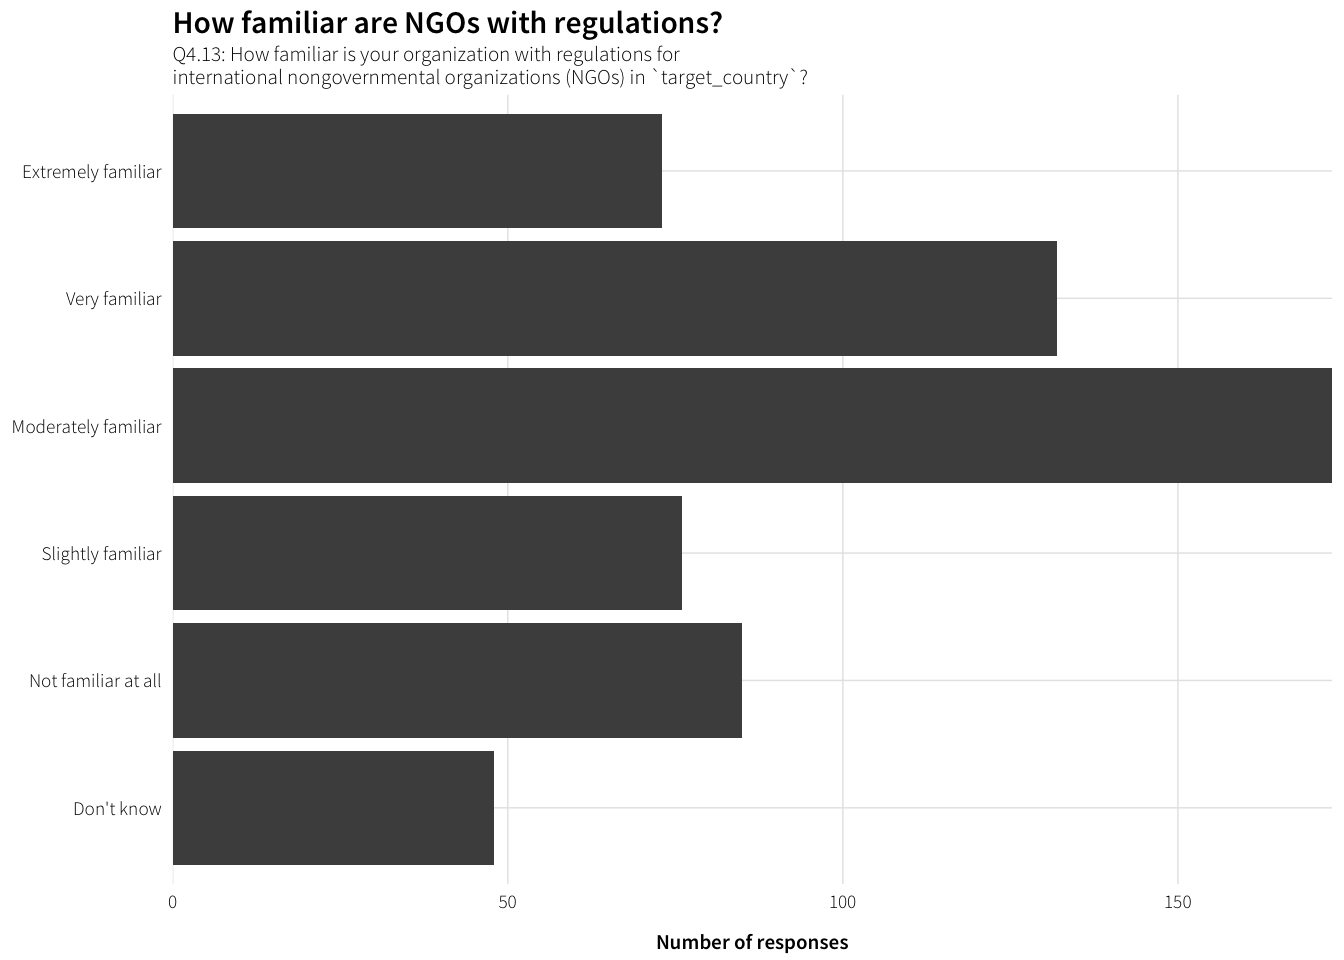
Frequency of regulation change
df.reg.change <- survey.countries.clean %>%
  filter(!is.na(Q4.14)) %>%
  group_by(Q4.14) %>%
  summarise(num = n()) %>%
  ungroup() %>%
  mutate(Q4.14 = factor(Q4.14, levels=rev(levels(Q4.14)), ordered=TRUE))

plot.reg.change <- ggplot(df.reg.change, aes(x=num, y=Q4.14)) +
  geom_barh(stat="identity") +
  scale_x_continuous(expand=c(0, 0)) +
  labs(x="Number of responses", y=NULL,
       title="How often do NGO regulations change?",
       subtitle="Q4.14: How often do regulations for international NGOs in `target_country` change?") +
  theme_ath()

plot.reg.change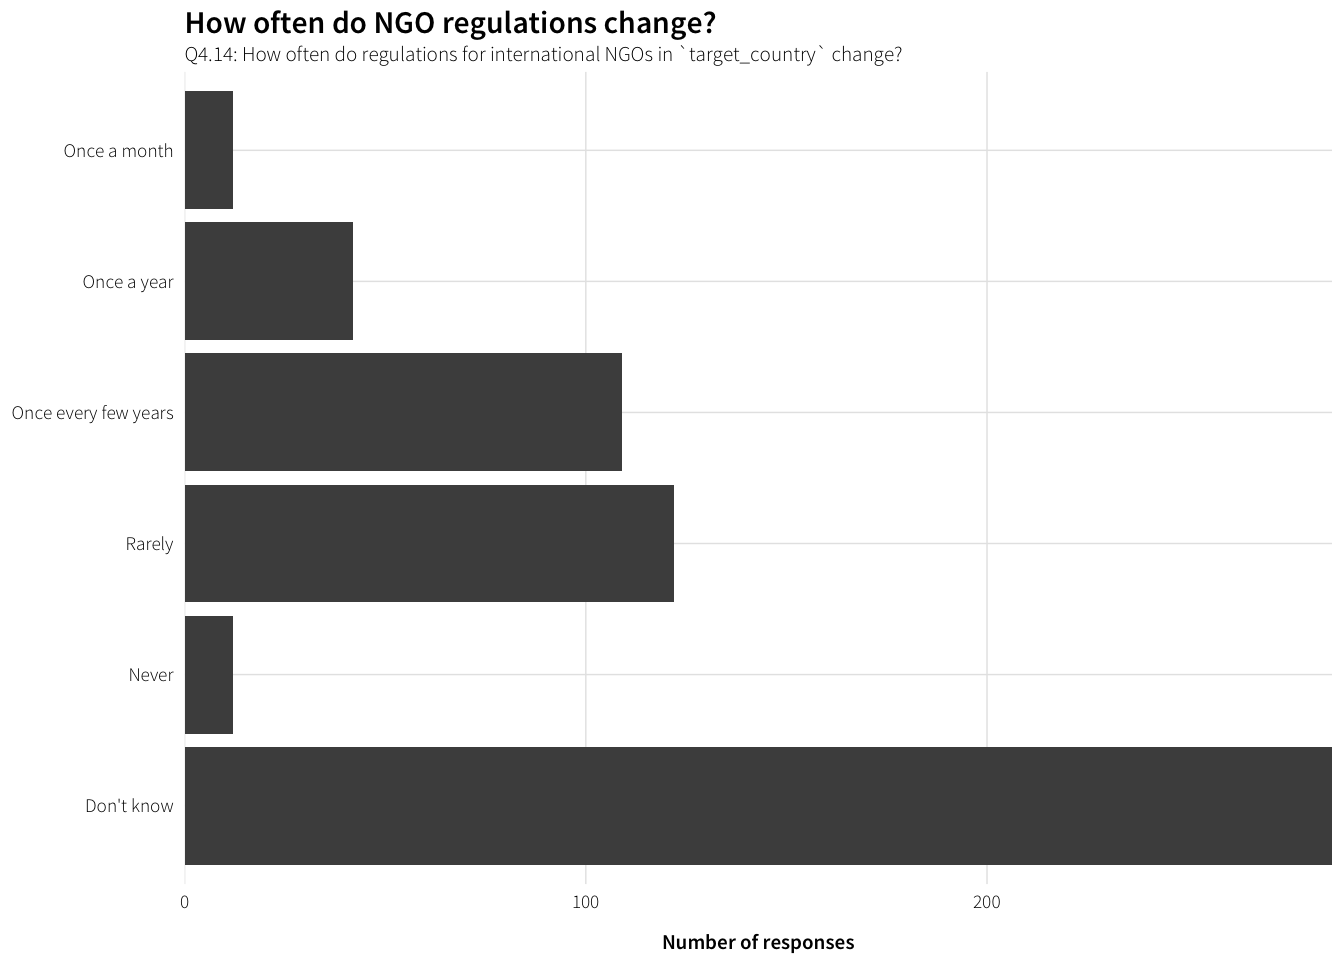
How do NGOs find out about changes?
df.change.how <- survey.countries.clean %>%
  unnest(Q4.15_value) %>%
  group_by(Q4.15_value) %>%
  summarise(num = n()) %>%
  arrange(desc(num)) %>%
  filter(!is.na(Q4.15_value)) %>%
  mutate(how = factor(Q4.15_value, levels=rev(Q4.15_value), ordered=TRUE))

levels(df.change.how$how)[levels(df.change.how$how) == "Newspapers, television, and other media"] <-
  "Newspapers, television,\nand other media"

plot.change.how <- ggplot(df.change.how, aes(x=num, y=how)) +
  geom_barh(stat="identity") +
  scale_x_continuous(expand=c(0, 0)) +
  labs(x="Times selected", y=NULL,
       title="How do NGOs find out about changes to regulations?",
       subtitle="Q4.15: How does your organization find out about changes to\nNGO regulations in `target_country`? (multiple answers allowed)") +
  theme_ath()

plot.change.how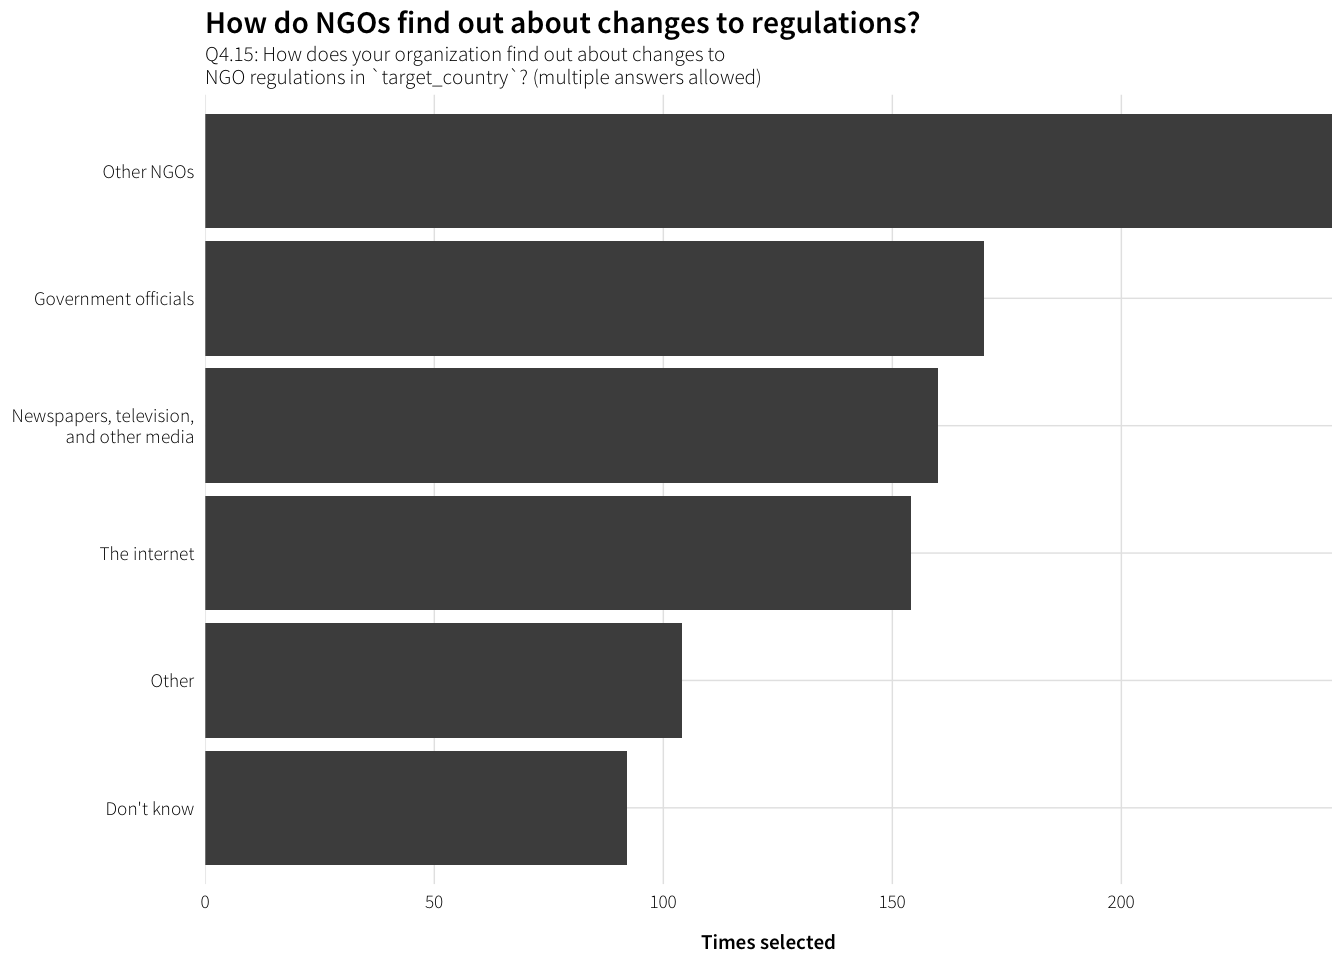
What are the other ways?
df.change.how.other <- survey.countries.clean %>%
  filter(!is.na(Q4.15_other_TEXT)) %>%
  select(Q4.15_other_TEXT) %>%
  arrange(Q4.15_other_TEXT)

datatable(df.change.how.other)
How are NGOs affected by regulations?
labels.reg.effects <- data_frame(levels=c("registration", "operations", "speech",
                                          "communications", "assembly", "resources"),
                                 labels=c("Regulations regarding registration",
                                          "Regulations regarding operations",
                                          "Regulations regarding speech and advocacy",
                                          "Regulations regarding communication and cooperation",
                                          "Regulations regarding assembly",
                                          "Regulations regarding resources"))

df.reg.effects <- survey.countries.clean %>%
  select(dplyr::contains("Q4.16"), -dplyr::contains("TEXT")) %>%
  gather(question, response) %>%
  mutate(question = str_replace(question, "Q4\\.16_", ""),
         question = factor(question, levels=labels.reg.effects$levels,
                           labels=labels.reg.effects$labels, ordered=TRUE)) %>%
  filter(!(response %in% c("Don't know", "Not applicable"))) %>%
  group_by(question, response) %>%
  summarise(num = n()) %>%
  ungroup() %>%
  mutate(response = factor(response,
                           levels=levels(survey.countries.clean$Q4.16_speech),
                           ordered=TRUE))

plot.reg.effects <- ggplot(df.reg.effects, aes(y=num, x=response)) +
  geom_bar(stat="identity") +
  labs(y="Number of responses", x=NULL,
       title="How are NGOs affected by regulations?",
       subtitle="Q4.16: How is your organization affected by the following types\nof legal regulations for international NGOs in `target_country`?") +
  facet_wrap(~ question, ncol=1) +
  theme_ath()

plot.reg.effects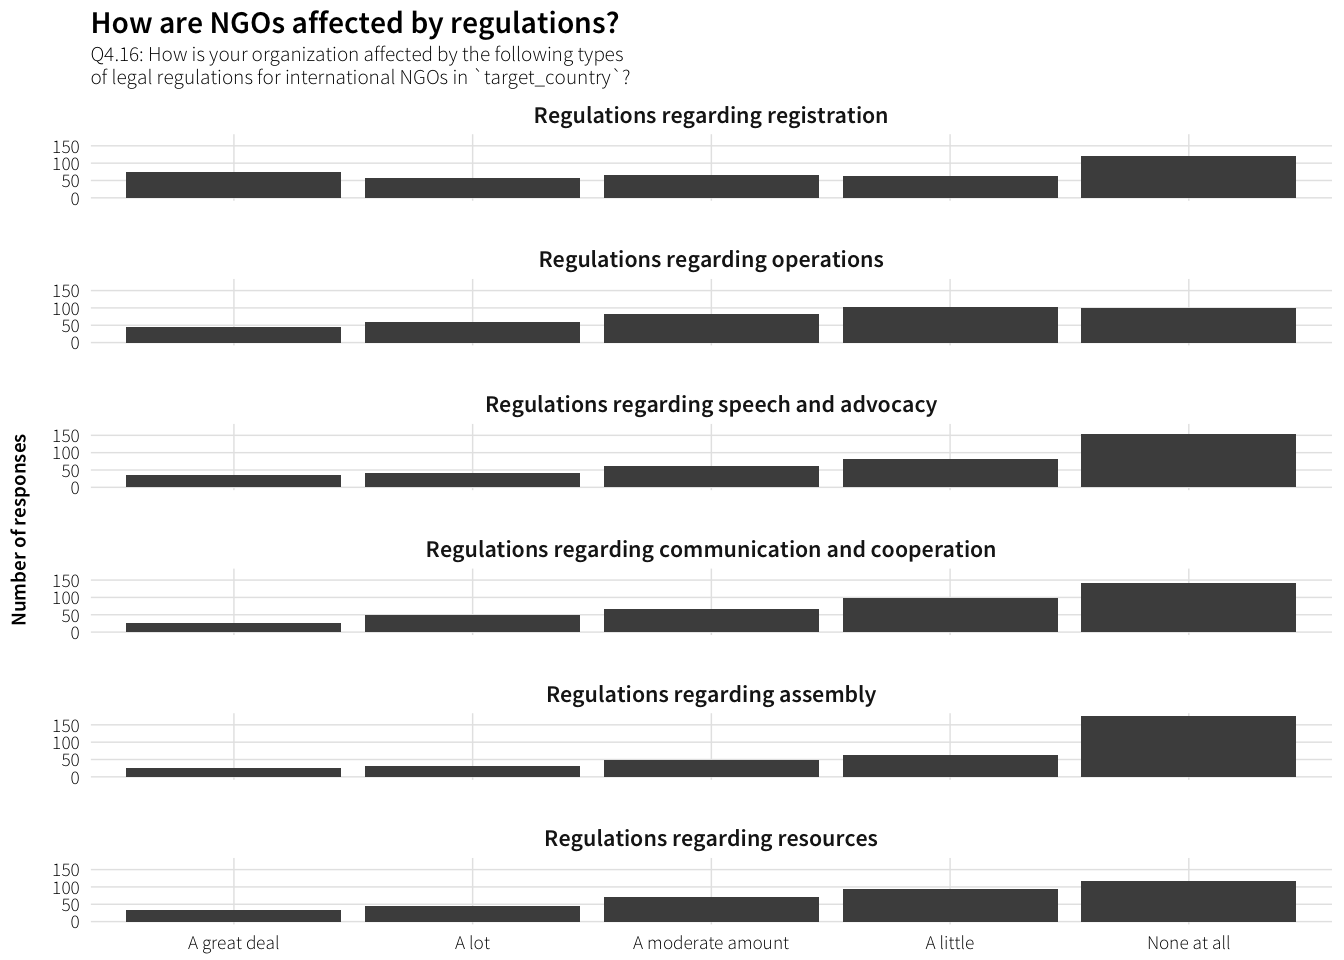
Regulations regarding registration
Q4.16a: Please describe how your organization is affected by regulations regarding registration.
df.Q4.16.registration <- survey.countries.clean %>%
  filter(!is.na(Q4.16_registration_TEXT)) %>%
  arrange(Q4.16_registration_TEXT) %>% select(Q4.16_registration_TEXT)

datatable(df.Q4.16.registration)
Regulations regarding operations
Q4.16b: Please describe how your organization is affected by regulations regarding operations.
df.Q4.16.operations <- survey.countries.clean %>%
  filter(!is.na(Q4.16_operations_TEXT)) %>%
  arrange(Q4.16_operations_TEXT) %>% select(Q4.16_operations_TEXT)

datatable(df.Q4.16.operations)
Regulations regarding speech and advocacy
Q4.16c: Please describe how your organization is affected by regulations regarding speech and advocacy.
df.Q4.16.speech <- survey.countries.clean %>%
  filter(!is.na(Q4.16_speech_TEXT)) %>%
  arrange(Q4.16_speech_TEXT) %>% select(Q4.16_speech_TEXT)

datatable(df.Q4.16.speech)
Regulations regarding communication and cooperation
Q4.16d: Please describe how your organization is affected by regulations regarding communication and cooperation.
df.Q4.16.communications <- survey.countries.clean %>%
  filter(!is.na(Q4.16_communications_TEXT)) %>%
  arrange(Q4.16_communications_TEXT) %>% select(Q4.16_communications_TEXT)

datatable(df.Q4.16.communications)
Regulations regarding assembly
Q4.16e: Please describe how your organization is affected by regulations regarding assembly.
df.Q4.16.assembly <- survey.countries.clean %>%
  filter(!is.na(Q4.16_assembly_TEXT)) %>%
  arrange(Q4.16_assembly_TEXT) %>% select(Q4.16_assembly_TEXT)

datatable(df.Q4.16.assembly)
Regulations regarding resources
Q4.16f: Please describe how your organization is affected by regulations regarding resources.
df.Q4.16.resources <- survey.countries.clean %>%
  filter(!is.na(Q4.16_resources_TEXT)) %>%
  arrange(Q4.16_resources_TEXT) %>% select(Q4.16_resources_TEXT)

datatable(df.Q4.16.resources)
How are NGOs affected by regulations in general?
df.reg.effect.general <- survey.countries.clean %>%
  filter(!is.na(Q4.17)) %>%
  group_by(Q4.17) %>%
  summarise(num = n()) %>%
  ungroup() %>%
  mutate(Q4.17 = factor(Q4.17, levels=rev(levels(Q4.17)), ordered=TRUE))

plot.reg.effect.general <- ggplot(df.reg.effect.general, aes(x=num, y=Q4.17)) +
  geom_barh(stat="identity") +
  scale_x_continuous(expand=c(0, 0)) +
  labs(x="Number of responses", y=NULL,
       title="How are NGOs affected by regulations in general?",
       subtitle="Q4.17: Overall, how is your organization's work affected by government regulations in `target_country`?") +
  theme_ath()

plot.reg.effect.general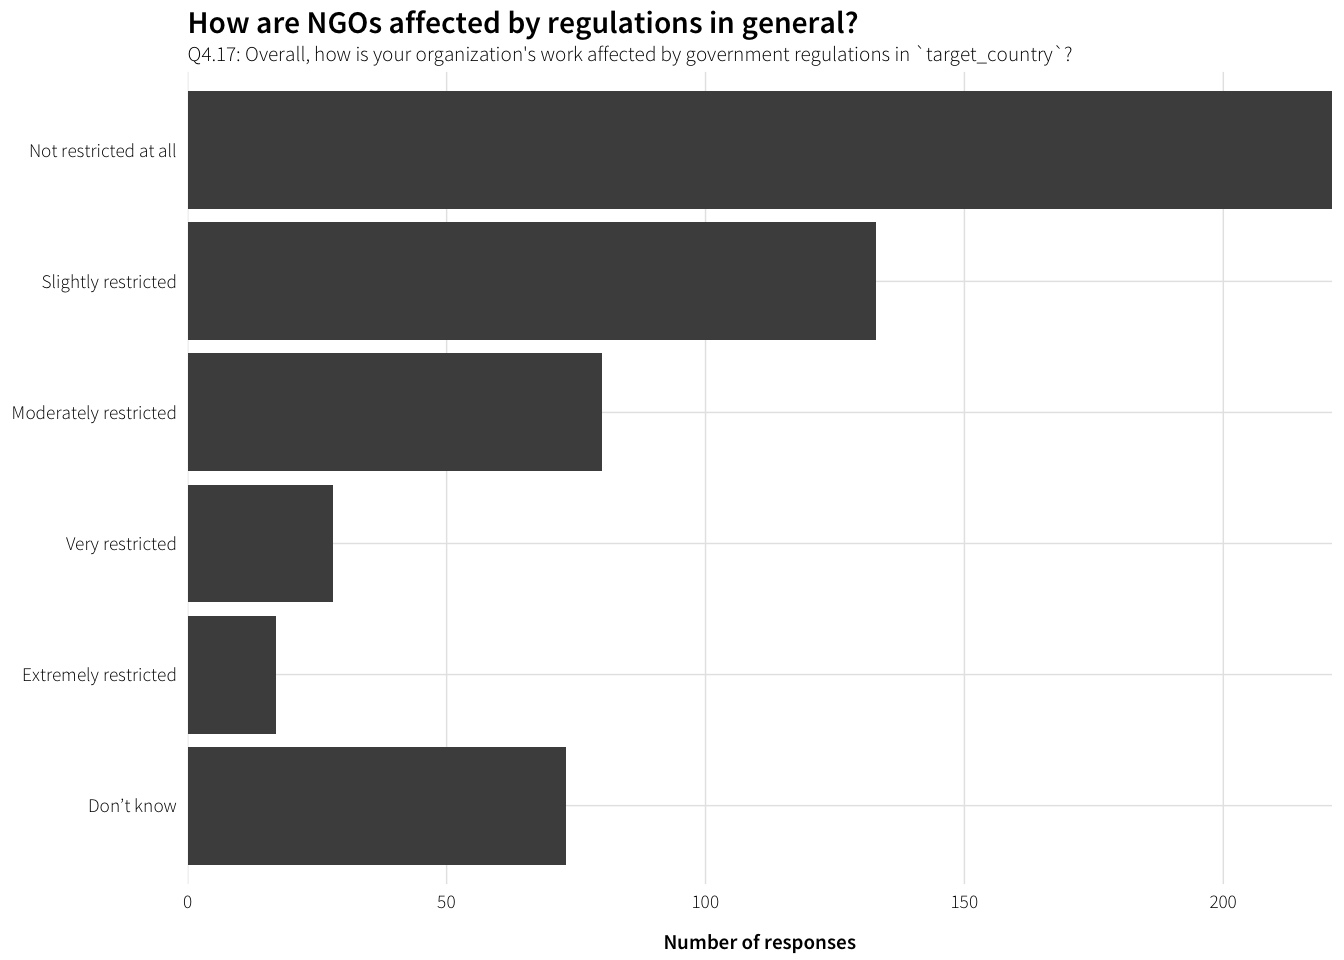
Effect of regulations on ability to pursue mission
Q4.18: How do the local laws and regulations in target_country affect your organization’s ability to pursue its mission?
df.Q4.18 <- survey.countries.clean %>%
  filter(!is.na(Q4.18)) %>%
  arrange(Q4.18) %>% select(Q4.18)

datatable(df.Q4.18)
Responses to regulations
Have NGOs changed programming?
df.change.programming <- survey.countries.clean %>%
  filter(!is.na(Q4.19)) %>%
  group_by(Q4.19) %>%
  summarise(num = n()) %>%
  ungroup() %>%
  mutate(Q4.19 = factor(Q4.19, levels=rev(levels(Q4.19)), ordered=TRUE))

plot.change.programming <- ggplot(df.change.programming, aes(x=num, y=Q4.19)) +
  geom_barh(stat="identity") +
  scale_x_continuous(expand=c(0, 0)) +
  labs(x="Number of responses", y=NULL,
       title="Have NGOs changed their mix of programming?",
       subtitle="Q4.19: Over the last 10 years, has your organization changed its mix of programming in `target_country`?") +
  theme_ath()

plot.change.programming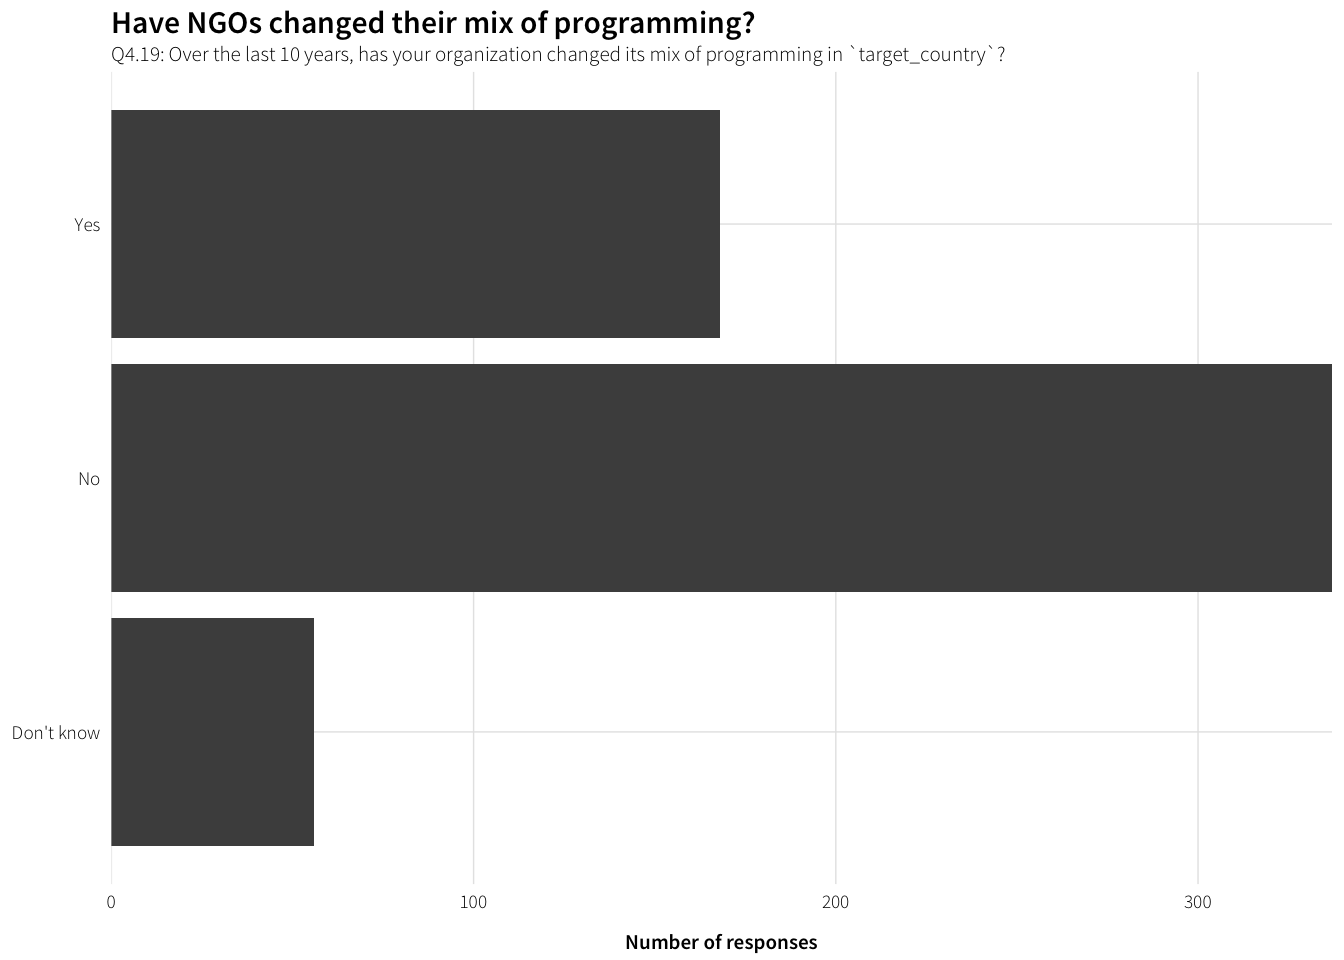
How so?
Q4.20: How has your organization’s mix of programming changed in target_country?
df.Q4.20 <- survey.countries.clean %>%
  filter(!is.na(Q4.20)) %>%
  arrange(Q4.20) %>% select(Q4.20)

datatable(df.Q4.20)
Changes in response to regulations
labels.changes <- data_frame(levels=c("funding", "issues", "comm_govt",
                                      "comm_donors", "locations", "country_office",
                                      "local_staff", "foreign_staff"),
                             labels=c("Changed sources of funding",
                                      "Changed issues worked on",
                                      "Changed communication with the government",
                                      "Changed communication with donors",
                                      "Changed locations worked in",
                                      "Changed location country office",
                                      "Used more local staff and/or volunteers",
                                      "Used more foreign staff and/or volunteers"))

df.reg.changes.response <- survey.countries.clean %>%
  select(dplyr::contains("Q4.21"), -dplyr::contains("TEXT")) %>%
  gather(question, response) %>%
  mutate(question = str_replace(question, "Q4\\.21_", ""),
         question = factor(question, levels=labels.changes$levels,
                           labels=labels.changes$labels, ordered=TRUE)) %>%
  filter(!(response %in% c("Don't know", "Not applicable"))) %>%
  group_by(question, response) %>%
  summarise(num = n()) %>%
  ungroup() %>%
  mutate(response = factor(response,
                           levels=levels(survey.countries.clean$Q4.21_funding),
                           ordered=TRUE))

plot.reg.changes.response <- ggplot(df.reg.changes.response,
                                    aes(y=num, x=response)) +
  geom_bar(stat="identity") +
  labs(y="Number of responses", x=NULL,
       title="How have NGOs changed in response to regulations?",
       subtitle="Q4.21: Has your organization done any of the following in response to changes in government regulations in `target_country`?") +
  facet_wrap(~ question, ncol=2) +
  theme_ath()

plot.reg.changes.response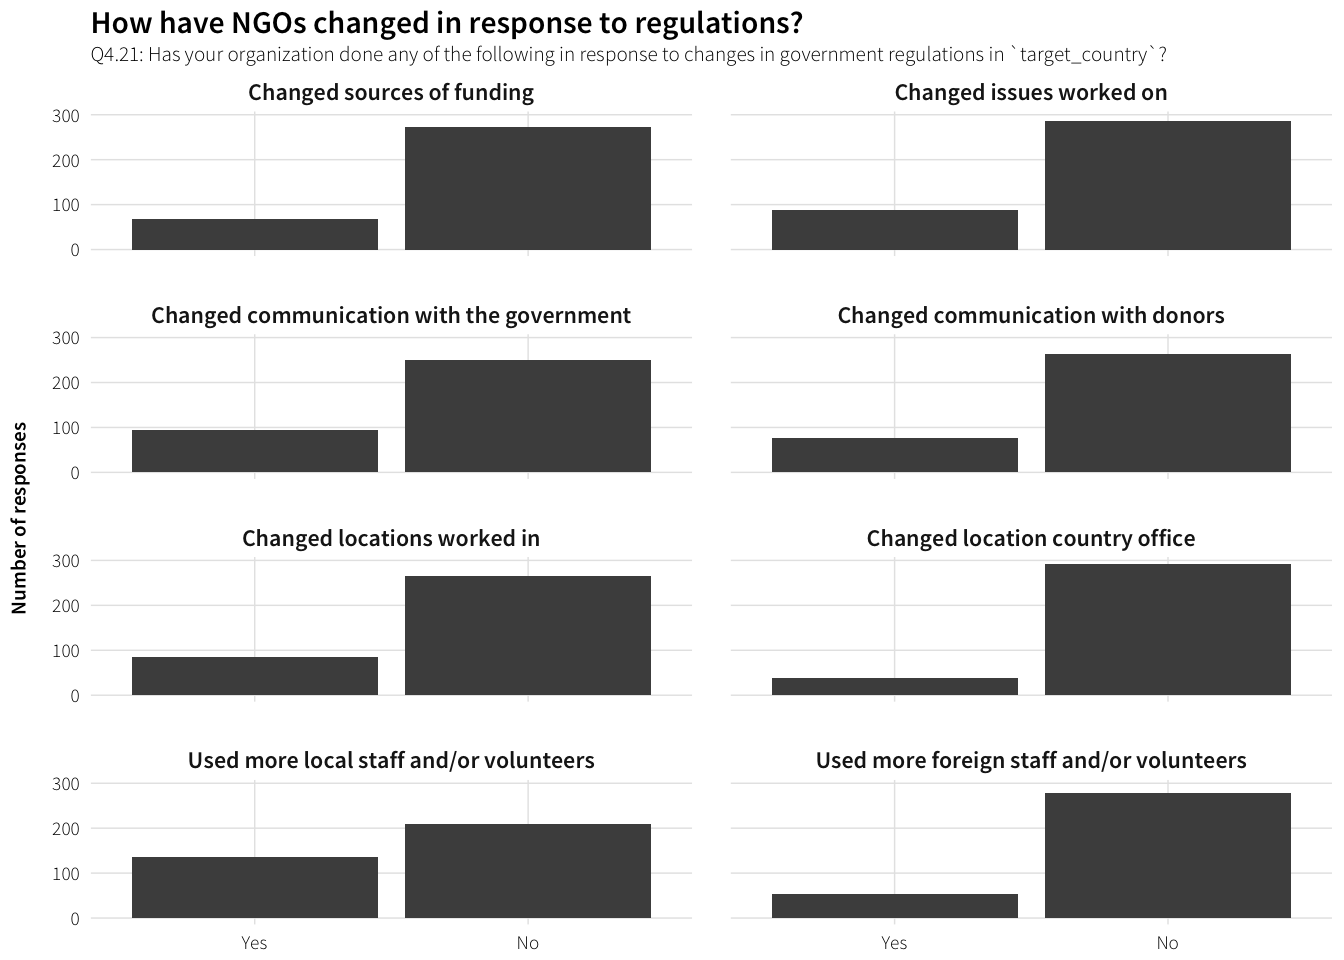
Changed sources of funding
Q4.21a: Please describe how your organization changed its funding sources. What regulation were you responding to?
df.Q4.21.funding <- survey.countries.clean %>%
  filter(!is.na(Q4.21_funding_TEXT)) %>%
  arrange(Q4.21_funding_TEXT) %>% select(Q4.21_funding_TEXT)

datatable(df.Q4.21.funding)
Changed issues worked on
Q4.21b: Please describe how your organization changed which issues it works on. What regulation were you responding to?
df.Q4.21.issues <- survey.countries.clean %>%
  filter(!is.na(Q4.21_issues_TEXT)) %>%
  arrange(Q4.21_issues_TEXT) %>% select(Q4.21_issues_TEXT)

datatable(df.Q4.21.issues)
Changed communication with the government
Q4.21c: Please describe how your organization changed how it communicates with the government. What regulation were you responding to?
df.Q4.21.comm_govt <- survey.countries.clean %>%
  filter(!is.na(Q4.21_comm_govt_TEXT)) %>%
  arrange(Q4.21_comm_govt_TEXT) %>% select(Q4.21_comm_govt_TEXT)

datatable(df.Q4.21.comm_govt)
Changed communication with donors
Q4.21d: Please describe how your organization changed how it communicates with donors. What regulation were you responding to?
df.Q4.21.comm_donors <- survey.countries.clean %>%
  filter(!is.na(Q4.21_comm_donors_TEXT)) %>%
  arrange(Q4.21_comm_donors_TEXT) %>% select(Q4.21_comm_donors_TEXT)

datatable(df.Q4.21.comm_donors)
Changed locations worked in
Q4.21e: Please describe how your organization changed the locations it works in. What regulation were you responding to?
df.Q4.21.locations <- survey.countries.clean %>%
  filter(!is.na(Q4.21_locations_TEXT)) %>%
  arrange(Q4.21_locations_TEXT) %>% select(Q4.21_locations_TEXT)

datatable(df.Q4.21.locations)
Changed location country office
Q4.21f: Please describe how your organization changed the location of its country office. What regulation were you responding to?
df.Q4.21.country_office <- survey.countries.clean %>%
  filter(!is.na(Q4.21_country_office_TEXT)) %>%
  arrange(Q4.21_country_office_TEXT) %>% select(Q4.21_country_office_TEXT)

datatable(df.Q4.21.country_office)
Used more local staff and/or volunteers
Q4.21g: Please describe how your organization used more local staff or volunteers. What regulation were you responding to?
df.Q4.21.local_staff <- survey.countries.clean %>%
  filter(!is.na(Q4.21_local_staff_TEXT)) %>%
  arrange(Q4.21_local_staff_TEXT) %>% select(Q4.21_local_staff_TEXT)

datatable(df.Q4.21.local_staff)
Used more foreign staff and/or volunteers
Q4.21h: Please describe how your organization used more foreign staff or volunteers. What regulation were you responding to?
df.Q4.21.foreign_staff <- survey.countries.clean %>%
  filter(!is.na(Q4.21_foreign_staff_TEXT)) %>%
  arrange(Q4.21_foreign_staff_TEXT) %>% select(Q4.21_foreign_staff_TEXT)

datatable(df.Q4.21.foreign_staff)
Have NGOs discussed regulations with government?
df.reg.discuss <- survey.countries.clean %>%
  filter(!is.na(Q4.22)) %>%
  group_by(Q4.22) %>%
  summarise(num = n()) %>%
  ungroup() %>%
  mutate(Q4.22 = factor(Q4.22, levels=rev(levels(Q4.22)), ordered=TRUE))

plot.reg.discuss <- ggplot(df.reg.discuss, aes(x=num, y=Q4.22)) +
  geom_barh(stat="identity") +
  scale_x_continuous(expand=c(0, 0)) +
  labs(x="Number of responses", y=NULL,
       title="Have NGOs discussed regulations with government?",
       subtitle="Q4.22: Has your organization discussed NGO regulations with government officials in `target_country`?") +
  theme_ath()

plot.reg.discuss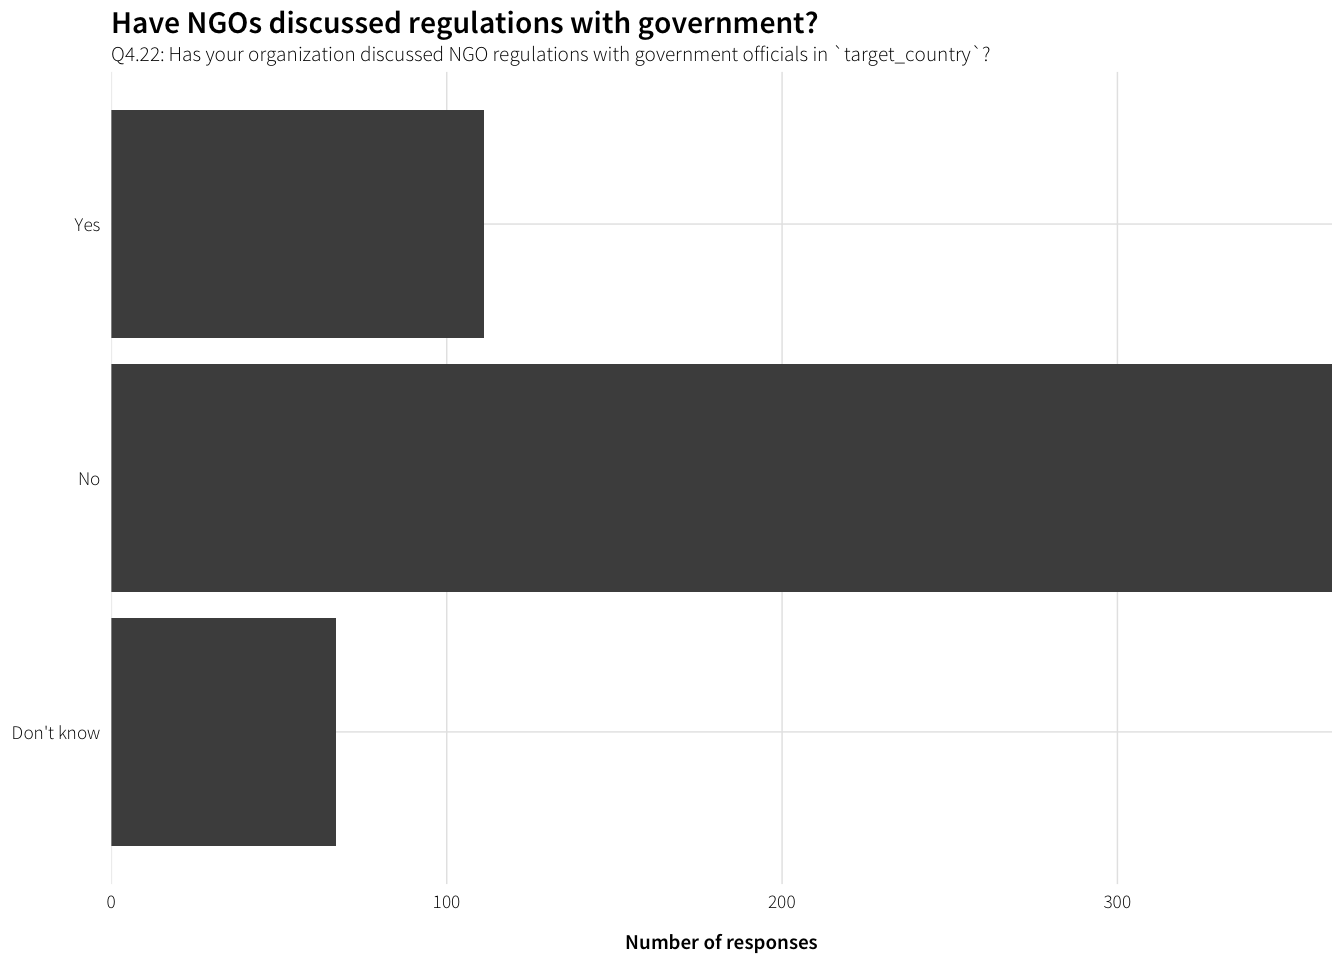
Have NGOs tried to change regulations?
df.reg.lobby <- survey.countries.clean %>%
  filter(!is.na(Q4.23)) %>%
  group_by(Q4.23) %>%
  summarise(num = n()) %>%
  ungroup() %>%
  mutate(Q4.23 = factor(Q4.23, levels=rev(levels(Q4.23)), ordered=TRUE))

plot.reg.lobby <- ggplot(df.reg.lobby, aes(x=num, y=Q4.23)) +
  geom_barh(stat="identity") +
  scale_x_continuous(expand=c(0, 0)) +
  labs(x="Number of responses", y=NULL,
       title="Have NGOs tried to change regulations?",
       subtitle="Q4.23: Has your organization tried to change NGO regulations in `target_country`?") +
  theme_ath()

plot.reg.lobby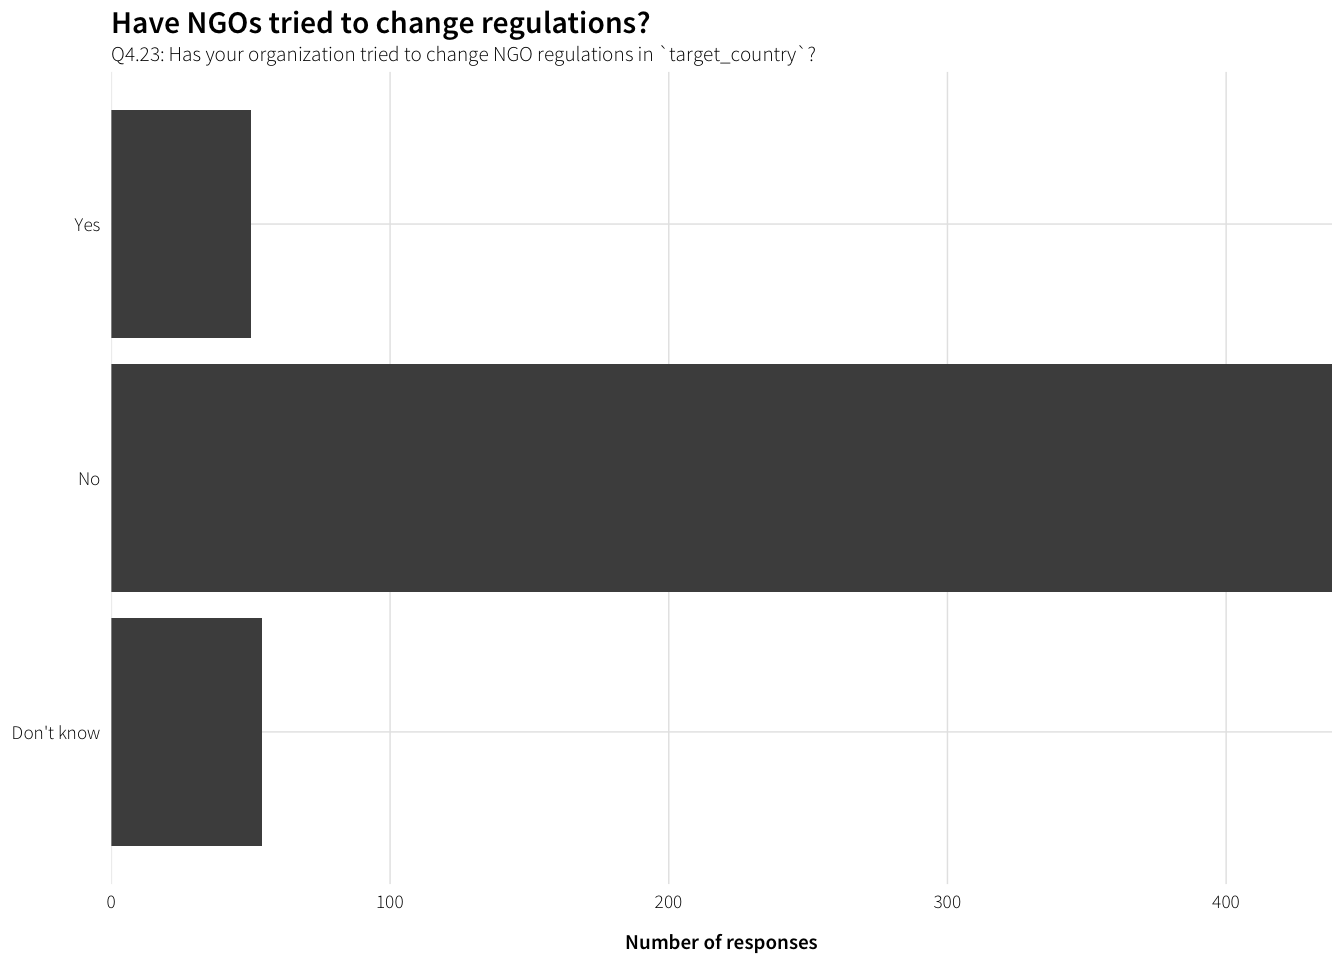
Final thoughts
Q5.1: Do you have any additional comments?
df.Q5.1 <- survey.orgs.clean %>%
  filter(!is.na(Q5.1)) %>%
  arrange(Q5.1) %>% select(Q5.1)

datatable(df.Q5.1)