library(ggplot2)
library(marginaleffects)
set.seed(1234)

dat <- readRDS("data/impartiality.rds")

m <- glm(
  impartial ~ eq_dr * democracy + continent,
  data = dat, family = binomial
)Case study
Rothstein and Teorell (2008) have argued that a critical component of good governance in a country is the impartiality of its government institutions, or the degree to which state power is exercised according to written laws rather than personal connections or biases. Many factors influence the impartiality of governance, including the level of economic inequality in a country (Suzuki and Demircioglu 2021) and the presence or absence of democratic political institutions (Rothstein and Teorell 2008).
To illustrate a typical workflow for working with , we will use three core functions—predictions(), comparisons(), and slopes()—to answer several research questions related to the relationship between governance, inequality, and democracy. We estimate a logistic regression model that predicts whether a country’s public officials are impartial in performance of their duties based on resource inequality, regime type, and continent. Our data for this example comes from the Varieties of Democracy project (Coppedge et al. 2023; Maerz et al. 2022) and includes these binary, continuous, and categorical variables:1
- Impartial public administration (
impartial): A binary indicator for whether a country’s public officials are impartial in the performance of their duties - Equal distribution of resources index (
eq_dr): A continuous scale from 0–100 indicating the degree to which resources like public goods, welfare policies, educational equality, and health equality are distributed; high values represent greater equality - Regime type (
democracy): A binary indicator with the values “Democracy” and “Autocracy” - Continent (
continent): The country’s continent, determined by the World Bank
Predictions
Step 1: Quantity
In this section, we will explore different research questions related to the predicted probabilities of having an impartial public sector. Since our quantity of interest or estimand involves predicted values, we will use the predictions() function.
Step 2: Grid
Predictions are a conditional quantity—their values depend on the values of the covariates or predictors in the model. To generate predictions, we need to specify a reference grid, or a dataset of values of the predictor variables we want to plug into the model. We can create several different types of reference grids depending on the quantity of interest we are interested in and the research question we are asking.
Empirical distribution of predictors, or the original data
In the absence of an explicit reference grid, the predictions() function returns a prediction for each row of the original dataset. The first few countries in the dataset (Mexico, Suriname, Sweden, Switzerland, and Ghana) show some of the variation across these predictions. Sweden in row 3 has an exceptionally high predicted probability of having impartial government employees (0.998), while the United Arab Emirates in row 165 has a predicted probability of 0.746.
predictions(m) # 1: Quantity: predictions + 2: Grid: original data
 Estimate Pr(>|z|)    S 2.5 % 97.5 %
    0.914  0.00444  7.8 0.676  0.982
    0.996  0.00108  9.9 0.899  1.000
    0.998  0.00677  7.2 0.857  1.000
    0.999  0.00699  7.2 0.862  1.000
    0.966  < 0.001 10.6 0.807  0.995
--- 156 rows omitted. See ?avg_predictions and ?print.marginaleffects ---
    0.794  0.02311 5.4 0.546  0.925
    0.996  0.00611 7.4 0.830  1.000
    0.999  0.00684 7.2 0.858  1.000
    0.746  0.04504 4.5 0.506  0.894
    0.991  0.00603 7.4 0.792  1.000
Adjusted predictions at the mean
An alternative approach is to specify particular values of the predictors using the newdata argument.2 For instance, we can calculate an adjusted prediction at the mean—or a single prediction for an average country—by holding every predictor at its mean or mode, thus creating a one-row reference grid:
predictions(m,      # 1: Quantity: predictions
  newdata = "mean"  # 2: Grid: each predictor set to its mean or mode
)
 Estimate Pr(>|z|)    S 2.5 % 97.5 % eq_dr democracy continent
    0.979   <0.001 10.0 0.828  0.998  59.4 Democracy    Africa
In a hypothetical democracy in Africa with an equal distribution of resources index of 59.4, the predicted probability of having impartial public officials is 0.979. This combination of predictors does not necessarily reflect the characteristics of any actual country—it’s simply a combination of the means and modes of all covariates.
Adjusted predictions at user-specified values
Holding all variables constant provides a single predicted probability, but we’re interested in predicted values across difference regime types, continents, and levels of resource distribution. Since datagrid() accepts both vectors and functions that return vectors, we can construct a more complex reference grid of values to plug into the model. For instance, we can specify all possible combinations of democracy and two levels—low (30) and high (90)—of resource equality, while holding continent at its mode (Africa).
datagrid(model = m, democracy = unique, eq_dr = c(30, 90)) impartial continent democracy eq_dr
1 TRUE Africa Democracy 30
2 TRUE Africa Democracy 90
3 TRUE Africa Autocracy 30
4 TRUE Africa Autocracy 90We can generate adjusted predictions at these representative values for the four rows of this reference grid using predictions():
predictions(m,             # 1: Quantity: predictions
  newdata = datagrid(      # 2: Grid: some predictors set to specific values;
    democracy = unique,    #    all others set to their mean or mode
    eq_dr = c(30, 90))
)
 Estimate Pr(>|z|)   S 2.5 % 97.5 % continent democracy eq_dr
    0.801  0.03400 4.9 0.526  0.936    Africa Democracy    30
    0.998  0.00438 7.8 0.881  1.000    Africa Democracy    90
    0.213  0.00240 8.7 0.104  0.386    Africa Autocracy    30
    0.812  0.05428 4.2 0.493  0.950    Africa Autocracy    90
Step 3: Aggregation
Next we need to decide how to report these predicted values, either by reporting the values for each row of the reference grid or collapsing them into aggregated summaries.
Report estimates from the grid
When we pass a reference grid of user-specified values, we often do not need to further summarize or collapse the results since the predictions are already the estimands that we care about. In the reference grid above, with democracies and autocracies at low and high levels of resource equality, we can use each of the four predicted values as useful quantities of interest without needing to aggregate them. We can use these values to answer this question:
What is the average predicted probability of having an impartial public sector in typical democracies and autoracies with low and high levels of resource equality?
predictions(m,             # 1: Quantity: predictions
  newdata = datagrid(      # 2: Grid: some predictors set to specific values;
    democracy = unique,    #    all others set to their mean or mode
    eq_dr = c(30, 90))
)                          # 3: Aggregation: report each row (no extra step)
 Estimate Pr(>|z|)   S 2.5 % 97.5 % continent democracy eq_dr
    0.801  0.03400 4.9 0.526  0.936    Africa Democracy    30
    0.998  0.00438 7.8 0.881  1.000    Africa Democracy    90
    0.213  0.00240 8.7 0.104  0.386    Africa Autocracy    30
    0.812  0.05428 4.2 0.493  0.950    Africa Autocracy    90
We can use plot_predictions() with the same reference grid to visualize these results:
plot_predictions(m,
  newdata = datagrid(
    democracy = unique,
    eq_dr = c(30, 90)
  ),
  by = c("democracy", "eq_dr")
)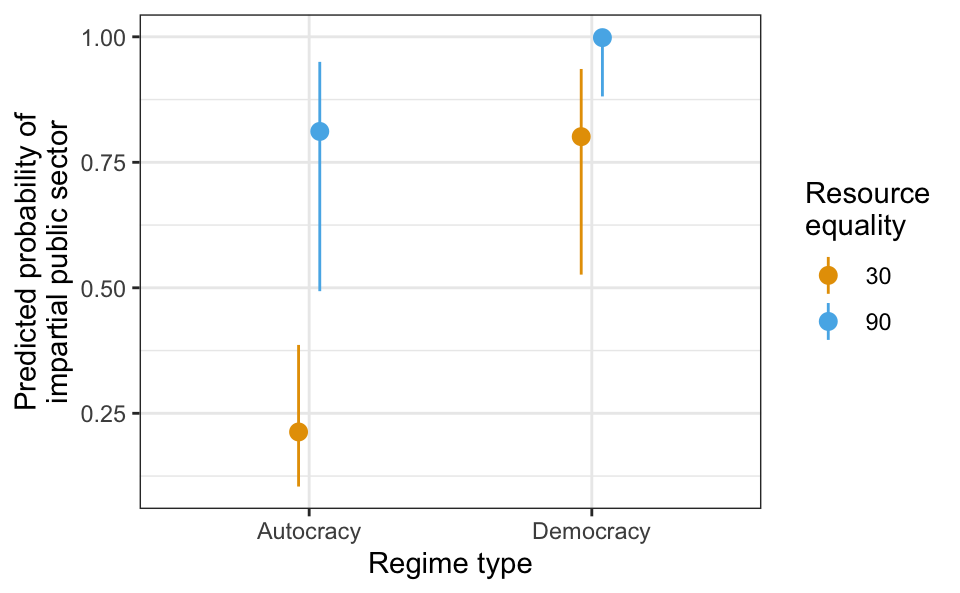
Based on this model, democracies with high resource equality have the highest predicted probability (0.998) of having an impartial public sector, while autocracies with low scores in the resource equality index have the lowest probability of impartiality (0.213).
Here we only calculated predictions at low and high levels of resource equality, chosen arbitrarily as 30 and 90. To get a better sense of the predicted probabilities for different regime types across the full range of the equality index, we can use a larger reference grid, with resource equality set to many possible values. Displaying this as a table is unwieldy, but plotting the results shows these predicted probabilities at all levels of resource equality. We can come to the same conclusion: democracies with a more equal distribution of resources have a high probability of impartial governance, while autocracies have a lower probability of impartiality regardless of resource equality.
plot_predictions(m,
  newdata = datagrid(
    democracy = unique,
    eq_dr = seq(1:100)
  ),
  by = c("eq_dr", "democracy")
)
Collapse estimates into averages
When using predictions() without an explicit reference grid we get estimates for each of the 166 rows in the dataset. To make these results more useful, we can collapse the estimate into aggregated average adjusted predictions. For example, we can calculate the overall average prediction with avg_prediction(), which takes the average of all the predicted values in the full dataset.3 This tells us that the overall predicted probability of having an impartial public sector is 0.911.
# 1: Quantity: predictions + 2: Grid: original data + 3: Aggregation: average
avg_predictions(m)
 Estimate Pr(>|z|)   S 2.5 % 97.5 %
    0.911  0.00437 7.8 0.674  0.981
We can also calculate the average adjusted predictions across subgroups in the data with the by argument, which tells us the average predicted probability of having an impartial public sector among democracies (0.992) and autocracies (0.351).
predictions(m,      # 1: Quantity: predictions + 2: Grid: original data
  by = "democracy"  # 3: Aggregation: averages across regime type
)
 democracy Estimate Pr(>|z|)   S 2.5 % 97.5 %
 Democracy    0.992  0.00123 9.7 0.869  1.000
 Autocracy    0.351  0.02682 5.2 0.239  0.482
The by argument can also work in tandem with newdata to calculate marginal means. In this case, we calculate predictions for a four-row reference grid (democracies and autocracies with high and low levels of equality) and then take the average of those averages by regime type. TODO: Substantive difference in interpretation between these and the ones above? Something about grid balance vs. empirical distribution?
predictions(m,             # 1: Quantity: predictions
  newdata = datagrid(      # 2: Grid: some predictors set to specific values;
    democracy = unique,    #    all others set to their mean or mode
    eq_dr = c(30, 90)),
  by = "democracy"         # 3: Aggregation: averages across regime type
)
 democracy Estimate Pr(>|z|)    S 2.5 % 97.5 %
 Democracy    0.980   <0.001 10.0 0.829  0.998
 Autocracy    0.519    0.874  0.2 0.296  0.734
Step 4: Uncertainty
After deciding how to aggregate our estimands, we need to decide how to deal with the uncertainty of these estimands. By default, all uncertainty estimates are computed using the delta method, and derivatives are computed numerically using simple finite differences. All functions have a vcov argument which can be used to report robust standard errors (e.g., Hubert-White or cluster-robust). Behind the scenes, marginaleffects delegates parts of the computation to the package .
For instance, we can calculate robust Hubert-White standard errors with vcov = "HC3":
avg_predictions(m,   # 1: Quantity: predictions + 2: Grid: original data
  by = "democracy",  # 3: Aggregation: averages across regime type
  vcov = "HC3"       # 4: Uncertainty: robust standard errors
)
 democracy Estimate Pr(>|z|)    S 2.5 % 97.5 %
 Democracy    0.992   <0.001 11.1 0.893  0.999
 Autocracy    0.351   0.0389  4.7 0.232  0.492
Or we can use robust standard errors clustered by continent:
avg_predictions(m,   # 1: Quantity: predictions + 2: Grid: original data
  by = "democracy",  # 3: Aggregation: averages across regime type
  vcov = ~continent  # 4: Uncertainty: clustered robust standard errors
)
 democracy Estimate Pr(>|z|)    S 2.5 % 97.5 %
 Democracy    0.992   <0.001 34.9 0.967  0.998
 Autocracy    0.351   0.0218  5.5 0.242  0.478
supports bootstrap and simulation-based inference using the , , or packages. For example, we can calculate simulated standard errors with inferences():
avg_predictions(m,  # 1: Quantity: predictions + 2: Grid: original data
  by = "democracy"  # 3: Aggregation: averages across regime type
) |>
  # 4: Uncertainty: simulation-based standard errors
  inferences(method = "simulation")
 democracy Estimate Std. Error 2.5 % 97.5 %
 Autocracy    0.385     0.0482 0.298  0.483
 Democracy    0.948     0.0377 0.858  0.979
Step 5: Test
All the core functions also have a hypothesis argument that allows us to conduct linear and non-linear hypothesis tests. Earlier we calculated the average predicted probabilities of having impartial government institutions in autocracies (0.351) and democracies (0.992), with a 57.4 percentage point difference between the two predictions. We can test whether this difference is statistically significantly different from zero by calculating the pairwise difference between the two levels of regime type. In this case, with such small standard errors, the difference is significant (p < 0.001).
avg_predictions(m,             # 1: Quantity: predictions + 2: Grid: original data
  by = c("democracy"),         # 3: Aggregation: averages across regime type
  vcov = ~continent,           # 4: Uncertainty: clustered robust standard errors
  hypothesis = "revpairwise"   # 5: Test: difference between democracies and
)                              #    autocracies (reversed) is greater than 0
                  Term Estimate Std. Error     z Pr(>|z|)    S  2.5 % 97.5 %
 Autocracy - Democracy   -0.574     0.0727 -7.89   <0.001 48.3 -0.716 -0.431
We can also test the equality of specific rows in the reference grid. Suppose we are interested in this question:
Is there a significant difference between average predictions for countries with low and high levels of resource equality in autocracies or in democracies?
Visually, we’re interested in the distance between the pair of point estimates within each regime type:
plot_predictions(m,
  newdata = datagrid(
    democracy = unique,
    eq_dr = c(30, 90)
  ),
  by = c("democracy", "eq_dr")
)
As an alternative to using the hypothesis argument, we can also the standalone hypotheses() function to run different hypotheses tests on the same object. We’ll first generate predictions for a four-row reference grid by setting democracy and resource equality to specific values:
p <- predictions(m,        # 1: Quantity: predictions
  newdata = datagrid(      # 2: Grid: some predictors set to specific values;
    democracy = unique,    #    all others set to their mean or mode
    eq_dr = c(30, 90)
  ))                       # 3: Aggregation: report each row (no extra step)
p
 Estimate Pr(>|z|)   S 2.5 % 97.5 % continent democracy eq_dr
    0.801  0.03400 4.9 0.526  0.936    Africa Democracy    30
    0.998  0.00438 7.8 0.881  1.000    Africa Democracy    90
    0.213  0.00240 8.7 0.104  0.386    Africa Autocracy    30
    0.812  0.05428 4.2 0.493  0.950    Africa Autocracy    90
To test whether there are differences in predictions within regime types, we can compare pairs of rows—the 3rd and 4th for autocracies and the 1st and 2nd for democracies:
# 5: Test: average predicted probabilities for countries with high vs. low
#    resource equality are equal *in autocracies*
hypotheses(p, "b3 = b4")
  Term Estimate Std. Error     z Pr(>|z|)    S  2.5 % 97.5 %
 b3=b4   -0.599      0.121 -4.96   <0.001 20.5 -0.835 -0.362
# 5: Test: average predicted probabilities for countries with high vs. low
# resource equality are equal *in democracies*
hypotheses(p, "b1 = b2")
  Term Estimate Std. Error     z Pr(>|z|)   S  2.5 % 97.5 %
 b1=b2   -0.197      0.105 -1.89   0.0594 4.1 -0.402 0.0078
Here we see that the 59.9 percentage point difference between predicted probabilities for countries with high vs. low resource equality in autocracies is significantly different from zero (p < 0.001). The 19.7 percentage point difference in democracies, on the other hand, is not statistically significant at a 0.05 threshold (p = 0.059).
Comparisons
The comparisons() function allows us to compare conditional predictions across a wide range of different covariate values. For example, we can ask the following research question:
How does the probability of having impartial government institutions change if a country is an autocracy vs. a democracy?
Our estimand for this question is the difference between predicted values for democracies and autocracies, so we can specify a list of values for the democracy covariate in the variables argument. As with predictions(), if we do not specify an explicit reference grid, comparisons() will return estimated differences for each row in the original data. The estimates reported here represent the difference in predicted probabilities if each country’s regime type were switched from autocracy to democracy, given each country’s other covariates.
# 1: Quantity: comparison of predicted values for democracies and autocracies +
# 2: Grid: original data
comparisons(m,
  variables = list(democracy = c("Democracy", "Autocracy"))
)
      Term              Contrast Estimate Std. Error     z Pr(>|z|)    S  2.5 %
 democracy Autocracy - Democracy   -0.509     0.1635 -3.12  0.00184  9.1 -0.830
 democracy Autocracy - Democracy   -0.207     0.1519 -1.37  0.17224  2.5 -0.505
 democracy Autocracy - Democracy   -0.201     0.1426 -1.41  0.15758  2.7 -0.481
 democracy Autocracy - Democracy   -0.181     0.1327 -1.36  0.17261  2.5 -0.441
 democracy Autocracy - Democracy   -0.524     0.1056 -4.96  < 0.001 20.5 -0.731
   97.5 %
 -0.18883
  0.09037
  0.07795
  0.07913
 -0.31703
--- 156 rows omitted. See ?avg_comparisons and ?print.marginaleffects ---
 democracy Autocracy - Democracy   -0.205     0.0968 -2.12  0.03442 4.9 -0.395
 democracy Autocracy - Democracy   -0.293     0.1786 -1.64  0.10149 3.3 -0.643
 democracy Autocracy - Democracy   -0.195     0.1395 -1.40  0.16225 2.6 -0.468
 democracy Autocracy - Democracy   -0.251     0.1015 -2.47  0.01341 6.2 -0.450
 democracy Autocracy - Democracy   -0.398     0.2043 -1.95  0.05152 4.3 -0.798
   97.5 %
 -0.01502
  0.05757
  0.07846
 -0.05206
  0.00262
We can aggregate this data by finding the average of the estimate column:
# 1: Quantity: comparison of predicted values for democracies and autocracies +
# 2: Grid: original data + 3: Aggregation: average
avg_comparisons(m,
  variables = list(democracy = c("Democracy", "Autocracy"))
)
      Term              Contrast Estimate Std. Error     z Pr(>|z|)    S  2.5 %
 democracy Autocracy - Democracy   -0.383     0.0744 -5.15   <0.001 21.8 -0.529
 97.5 %
 -0.237
On average, autocracies have a 38.3 percentage point lower predicted probability of having an impartial public sector than democracies.
We can also use comparisons() to estimate more detailed quantities of interest:
What is the effect of moving from low to high resource equality on the probability of having an impartial public sector for a democracy and an autocracy?
In this case we’ll set the variables argument to two specific levels of the resource equality index (30 and 90 for low and high) to indicate that we want the difference between these two levels. We’ll then specify a two-row reference grid with a row for each regime type, with all other covariates set to their mean or mode. Since we only have two values, we do not need to aggregate the results.
cmp <- comparisons(m,       # 1: Quantity: comparison of predicted values for low
  variables = list(         #    and high levels of resource equality
    eq_dr = c(30, 90)),
  newdata = datagrid(       # 2: Grid: regime type set to specific values;
    democracy = unique)     #    all other covariates set to their mean or mode
)
cmp
  Term Contrast Estimate Std. Error    z Pr(>|z|)    S   2.5 % 97.5 % continent
 eq_dr   custom   0.0633     0.0407 1.55     0.12  3.1 -0.0165  0.143    Africa
 eq_dr   custom   0.7769     0.1134 6.85   <0.001 37.0  0.5546  0.999    Africa
 democracy
 Democracy
 Autocracy
For democracies, there is an average 6.3 percentage point difference between predicted probabilities when resource equality is low vs. when it is high. This contrast is substantially larger in autocracies, where the difference is 77.7 percentage points. We can use plot_comparisons() to visualize these comparisons across regime types:
plot_comparisons(m,
  variables = list(eq_dr = c(30, 90)),
  condition = "democracy"
) +
  geom_hline(yintercept = 0, linetype = "dashed")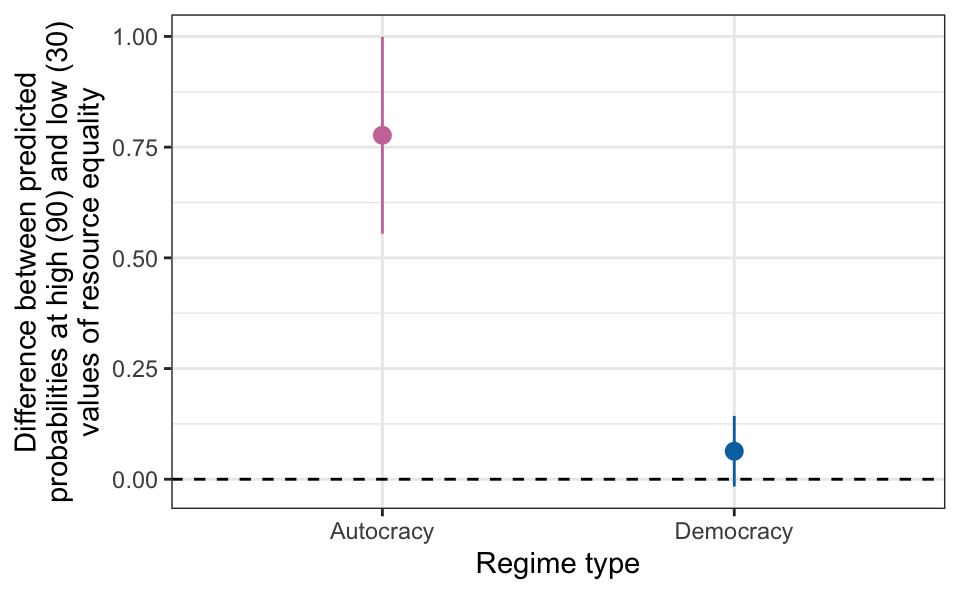
cmp <- comparisons(m,       # 1: Quantity: comparison of predicted values for
  variables = list(         #    low and high levels of resource equality
    eq_dr = c(30, 90)),
  newdata = datagrid(       # 2: Grid: regime type set to specific values;
    democracy = unique)     #    all other covariates set to their mean or mode
)
cmp
  Term Contrast Estimate Std. Error    z Pr(>|z|)    S   2.5 % 97.5 % continent
 eq_dr   custom   0.0633     0.0407 1.55     0.12  3.1 -0.0165  0.143    Africa
 eq_dr   custom   0.7769     0.1134 6.85   <0.001 37.0  0.5546  0.999    Africa
 democracy
 Democracy
 Autocracy
The comparisons() function includes a hypothesis argument (and comparisons() objects can be used with the hypotheses() function) that we can use to test specific questions:
Does moving from low to high resource equality have a larger effect on the probability of having an impartial public sector for democracies than for autocracies?
We have already seen that the low-to-high equality effect is 6.3 percentage points in democracies and 77.7 percentage points in autocracies. Is there a statistically significant difference between these two estimates? We can estimate this difference with a hypothesis test:
# 5: Test: Are the high-low resource equality differences the
#    same in autocracies and democracies?
hypotheses(cmp, "b2 = b1")
  Term Estimate Std. Error    z Pr(>|z|)    S 2.5 % 97.5 %
 b2=b1    0.714      0.125 5.71   <0.001 26.4 0.469  0.959
On average, there is a 71.4 percentage point difference in the low-to-high equality contrast between regime types, and this difference is definitely statistically significant (p < 0.001).
We used a two-row reference grid with all model covariates held to their typical values. Instead of creating an artificially balanced grid with values that might not appear in the data, we could also use the original data and use an empirical grid, where we calculate a comparison of predictions for each row in the dataset and then aggregate those individual estimates into regime averages. In this case, after accounting for the actual distribution of data, the estimate of the contrast between low-to-high equality differences across regime types is smaller, but still statistically significant.
cmp <- comparisons(m,       # 1: Quantity: comparison of predicted values for
  variables = list(         #    low and high levels of resource equality
    eq_dr = c(30, 90)),
  # 2: Grid: original data + 3: Aggregation: averages across regime type
  by = "democracy"
)
cmp
  Term            Contrast democracy Estimate Std. Error    z Pr(>|z|)    S
 eq_dr mean(90) - mean(30) Democracy    0.196      0.114 1.73    0.084  3.6
 eq_dr mean(90) - mean(30) Autocracy    0.592      0.119 4.96   <0.001 20.4
   2.5 % 97.5 %
 -0.0264  0.419
  0.3577  0.825
# 5: Test: Are the high-low equality contrasts the same
# in autocracies and democracies?
hypotheses(cmp, "b1 = b2")
  Term Estimate Std. Error     z Pr(>|z|)   S  2.5 % 97.5 %
 b1=b2   -0.395      0.142 -2.79  0.00523 7.6 -0.673 -0.118
Slopes
Thus far, we have looked at the relationship between impartial public administration and resource equality by arbitrarily choosing values of the resource equality index to stand in for low (30) and high (90). However, researchers are often more interested in the exact effect of continuous variables, with questions like this:
How does the probability of impartial governance change as resource equality increases?
Because the resource equality index is a continuous variable, this quantity of interest is best estimated as a partial derivative. In a basic linear model, this estimand can be found by looking at model coefficients. In models with non-linear link functions, or in models that involve interaction terms, polynomials, or other complexities, it is difficult to interpret coefficients alone. In our model m, all the coefficients are reported on an uninterpretable log odds scale.
summary(m)
Call:
glm(formula = impartial ~ eq_dr * democracy + continent, family = binomial,
    data = dat)

Coefficients:
                         Estimate Std. Error z value Pr(>|z|)
(Intercept)              -2.69170    0.66413  -4.053 5.06e-05 ***
eq_dr                     0.04613    0.01291   3.572 0.000354 ***
democracyDemocracy        1.57035    1.54094   1.019 0.308161
continentAmericas         0.86559    0.87425   0.990 0.322129
continentAsia            -0.29261    0.59576  -0.491 0.623316
continentEurope          -0.26313    1.07118  -0.246 0.805959
eq_dr:democracyDemocracy  0.03769    0.03946   0.955 0.339464
---
Signif. codes:  0 '***' 0.001 '**' 0.01 '*' 0.05 '.' 0.1 ' ' 1

(Dispersion parameter for binomial family taken to be 1)

    Null deviance: 204.80  on 165  degrees of freedom
Residual deviance: 104.32  on 159  degrees of freedom
AIC: 118.32

Number of Fisher Scoring iterations: 8
Researchers will often exponentiate these coefficients to produce odds ratios, but are still left with estimands that are difficult to interpret directly. For example, the log odds-scale coefficient for the equal distribution of resources is 0.046; when exponentiated, this implies that a one-unit increase in the equal distribution index is associated with a \(e^{0.046}\) = 1.047 or a 4.7% higher likelihood of having an impartial public sector. This odds ratio is a relative measure, though, and provides no information about baseline probabilities—or about probabilities in general.
It is often more helpful and intuitive to think about changes in probabilities of the outcome rather than changes in the log odds of the outcome. To illustrate this, we can plot the predicted probabilities of public sector impartiality across the full range of the resource equality index. The slope of this line represents the effect of resource equality on the probability of having an impartial public sector. In general, the line moves upward, indicating a positive relationship, and the slope varies across different values of resource equality—a one-unit increase in the equality index is associated with a larger increase in the probability of impartiality when countries have low equality (e.g., 30) than when countries have high equality (e.g., 90).
plot_predictions(m, condition = "eq_dr") +
  geom_vline(xintercept = c(30, 90), linetype = "dotted")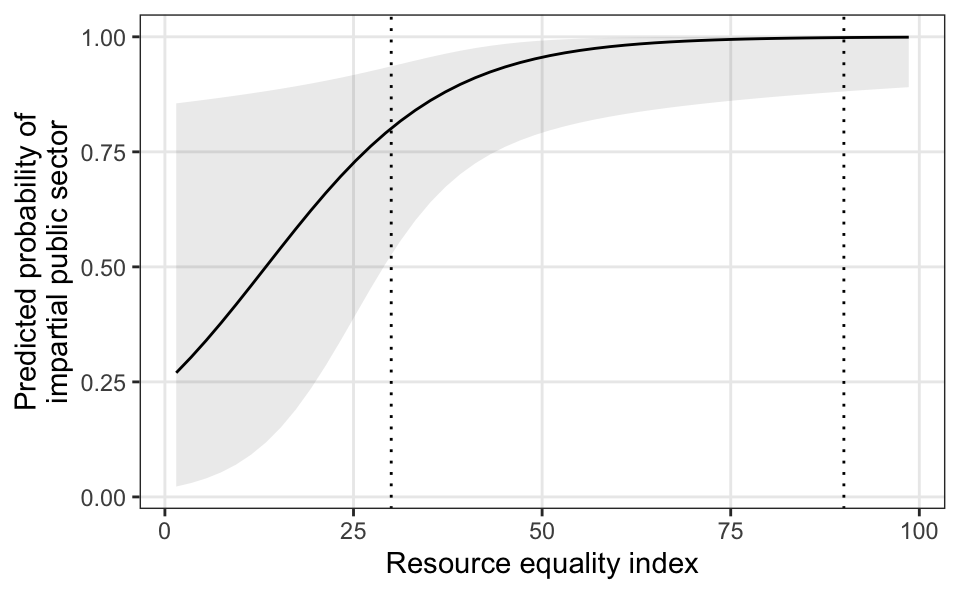
The slopes() function allows us to find exact values for these slopes on a directly interpretable response scale—probabilities, in the case of logistic regression. As with predictions() and comparisons(), by default slopes() returns an estimate for every row in the dataset. These estimates are similar to the results from comparisons() and show what would happen if the eq_dr value in each row were increased by a tiny amount,4 thus approximating an instantaneous slope or partial derivative:
# 1: Quantity: effect (or slope) of resource equality +
# 2: Grid: original data
slopes(m,
  variables = "eq_dr"
)
  Term Estimate Std. Error     z Pr(>|z|)   S     2.5 %   97.5 %
 eq_dr 0.006608   0.005408 1.222    0.222 2.2 -0.003990 0.017207
 eq_dr 0.000356   0.000453 0.785    0.432 1.2 -0.000533 0.001245
 eq_dr 0.000129   0.000257 0.504    0.615 0.7 -0.000374 0.000633
 eq_dr 0.000102   0.000211 0.481    0.631 0.7 -0.000313 0.000516
 eq_dr 0.002753   0.001754 1.570    0.116 3.1 -0.000684 0.006190
--- 156 rows omitted. See ?avg_slopes and ?print.marginaleffects ---
 eq_dr 0.007553   0.001726 4.375   <0.001 16.3  0.004170 0.010937
 eq_dr 0.000321   0.000529 0.608    0.543  0.9 -0.000715 0.001358
 eq_dr 0.000120   0.000242 0.496    0.620  0.7 -0.000354 0.000594
 eq_dr 0.008730   0.001868 4.675   <0.001 18.4  0.005070 0.012391
 eq_dr 0.000773   0.001047 0.738    0.461  1.1 -0.001280 0.002826
As with predictions and comparisons, to find more useful quantities of interest we can either aggregate these individual-level slopes, or we can use a smaller reference grid and calculate fewer estimands.
For instance, we can calculate the average marginal effect, or the average of all the individual-level slopes. This provides us with an average of the overall slope of the line, given the values of each row in the original data. This effect is on the percentage-point scale—in general, a one-unit increase in the equality of resources index is associated with an average 0.54 percentage point increase in the probability of having an impartial public sector.
# 1: Quantity: effect (or slope) of resource equality +
# 2: Grid: original data + 3: Aggregation: average
avg_slopes(m,
  variables = "eq_dr"
)
  Term Estimate Std. Error    z Pr(>|z|)    S   2.5 %  97.5 %
 eq_dr  0.00541    0.00116 4.66   <0.001 18.3 0.00314 0.00769
We can also calculate the marginal effect at the mean by using a one-row reference grid with all covariates held at their mean or mode. This also provides a single overall average value (a 0.17 average percentage point increase) but the combination of average and modal covariates likely does not exist in the data.
slopes(m,               # 1: Quantity: effect (or slope) of resource equality
  variables = "eq_dr",
  newdata = "mean"      # 2: Grid: each predictor set to its mean or mode
)                       # 3: Aggregation: report each row (no extra step)
  Term Estimate Std. Error    z Pr(>|z|)   S     2.5 %  97.5 %
 eq_dr   0.0017    0.00132 1.29    0.196 2.3 -0.000878 0.00428
Both the average marginal effect and the marginal effect at the mean provide us with a single quantity of interest, but we are often interested in more detailed estimands. Suppose we want to answer this research question:
What is the overall effect of resource equality on the probability of impartial governance in autocracies and democracies?
We can calculate group average marginal effects of slopes by finding the average of the individual marginal effects across each regime type. These group estimates show that on average, a one-unit increase in the resource equality index is associated with a 0.82 percentage point increase in the probability of an impartial public sector for autocracies, and a 0.3 percentage point increase for democracies.
slopes(m,               # 1: Quantity: effect (or slope) of resource
  variables = "eq_dr",  #    equality + 2: Grid: original data
  by = "democracy"      # 3: Aggregation: averages across regime type
)
  Term    Contrast democracy Estimate Std. Error    z Pr(>|z|)    S     2.5 %
 eq_dr mean(dY/dX) Democracy  0.00302    0.00156 1.93   0.0533  4.2 -4.31e-05
 eq_dr mean(dY/dX) Autocracy  0.00824    0.00155 5.33   <0.001 23.3  5.21e-03
  97.5 %
 0.00608
 0.01128
Alternatively, we can calculate marginal effects at user-specified values by using a reference grid with covariates set to specific values of interest. Here we can calculate the marginal effects for a typical democracy and autocracy, with all other model covariates held constant. These estimates differ from the group average marginal effects since the reference grid does not reflect any observed countries.
slopes(m,                # 1: Quantity: effect (or slope) of resource equality
  variables = "eq_dr",
  newdata = datagrid(    # 2: Grid: some predictors set to specific values;
    democracy = unique)  #    all others set to their mean or mode
)                        # 3: Aggregation: use each row (no extra step)
  Term Estimate Std. Error    z Pr(>|z|)    S     2.5 %  97.5 % eq_dr continent
 eq_dr   0.0017    0.00132 1.29    0.196  2.3 -0.000878 0.00428  59.4    Africa
 eq_dr   0.0115    0.00316 3.65   <0.001 11.9  0.005329 0.01772  59.4    Africa
 democracy
 Democracy
 Autocracy
Like predictions(), and comparisons(), we can also test hypotheses with slopes(). For example, consider this research question:
Is there a significant difference between the overall effects of resource equality on the probability of impartial governance in autocracies and democracies?
To answer this, we can estimate the difference between the group average marginal effects for each regime type (0.0082 for autocracies and 0.003 for democracies) and test if that difference is significantly different from zero. When using default standard errors, we find that the 0.005 difference in overall slopes is significantly different from zero (p = 0.012).
slopes(m,                  # 1: Quantity: effect (or slope) of resource
  variables = "eq_dr",     #    equality + 2: Grid: original data
  by = "democracy",        # 3: Aggregation: averages across regime type
  hypothesis = "pairwise"  # 5: Test: Is there a difference between the average
)                          #    effects of each regime type?
                  Term Estimate Std. Error     z Pr(>|z|)   S   2.5 %   97.5 %
 Democracy - Autocracy -0.00523    0.00208 -2.52   0.0118 6.4 -0.0093 -0.00116
However, if we calculate robust standard errors clustered by continent, the standard error for the estimated difference increases and the difference is no longer statistically significant at a 0.05 threshold (p = 0.066).
slopes(m,                  # 1: Quantity: effect (or slope) of resource
  variables = "eq_dr",     #    equality + 2: Grid: original data
  by = "democracy",        # 3: Aggregation: averages across regime type
  vcov = ~continent,       # 4: Uncertainty: clustered robust standard errors
  hypothesis = "pairwise"  # 5: Test: Is there a difference between the average
)                          #    effects of each regime type?
                  Term Estimate Std. Error     z Pr(>|z|)   S   2.5 %   97.5 %
 Democracy - Autocracy -0.00523    0.00285 -1.84   0.0664 3.9 -0.0108 0.000354
These grouped estimands provide a single quantity of interest for each regime type, but we can explore even richer questions:
How does the effect of resource equality on impartial governance differ at different levels of resource equality in autocracies and democracies?
To get a better sense for the estimands involved in exploring this question, we can plot the predicted probabilities of impartial governance over the full range of the resource equality index across both regime types.
plot_predictions(m, condition = c("eq_dr", "democracy")) +
  geom_vline(xintercept = c(30, 50, 90), linetype = "dotted")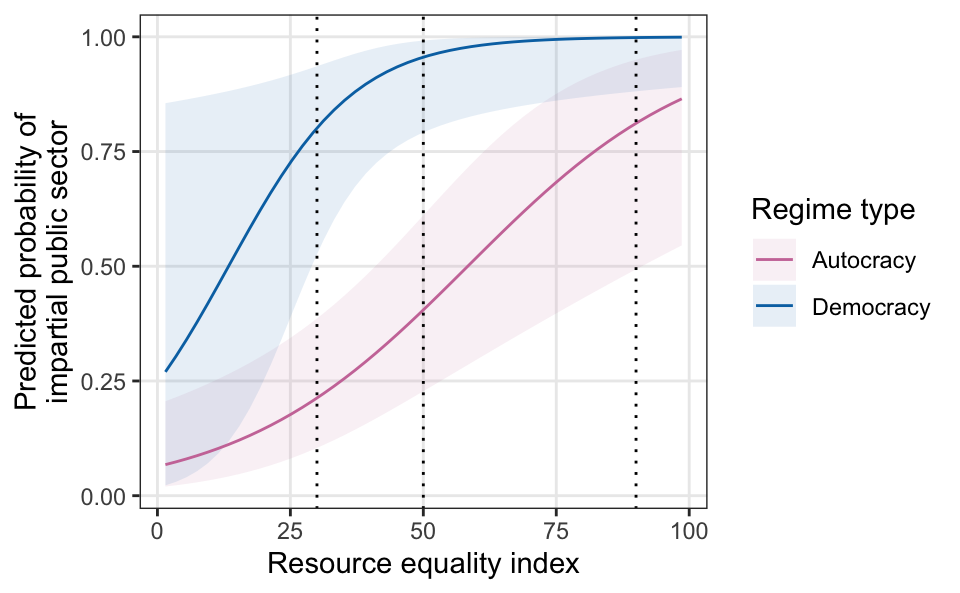
The strength of this relationship varies across different levels of resource equality. In democracies with low levels of equality (e.g., 30), the slope is steep, indicating that small changes in equality are associated with large changes in the probability of the outcome. The slope is essentially flat for democracies with high levels of equality (e.g., 90), indicating that small changes in equality are not associated with changes in the probability of the outcome. For autocracies, on the other hand, the slope of the predicted line is relatively shallow at low values of equality, but increases at higher levels—small changes in the resource equality index have a smaller effect in countries with low equality than in countries with mid-level equality (e.g., 50).
We can find exact estimates of the slope at these different values of regime type and high, medium, and low resource equality values by again calculating marginal effects at user-specified values:
slopes(m,                   # 1: Quantity: effect (or slope) of resource equality
  variables = "eq_dr",
  newdata = datagrid(       # 2: Grid: some predictors set to specific values;
    democracy = unique,     #    all others set to their mean or mode
    eq_dr = c(30, 50, 90))
)                           # 3: Aggregation: use each row (no extra step)
  Term Estimate Std. Error     z Pr(>|z|)    S     2.5 %   97.5 % continent
 eq_dr 0.013352   0.009043 1.476  0.13983  2.8 -0.004373 0.031077    Africa
 eq_dr 0.003553   0.002093 1.698  0.08959  3.5 -0.000549 0.007655    Africa
 eq_dr 0.000136   0.000245 0.553  0.58031  0.8 -0.000345 0.000617    Africa
 eq_dr 0.007729   0.002394 3.229  0.00124  9.7  0.003038 0.012421    Africa
 eq_dr 0.011115   0.003479 3.195  0.00140  9.5  0.004296 0.017934    Africa
 eq_dr 0.007055   0.001981 3.561  < 0.001 11.4  0.003172 0.010938    Africa
 democracy eq_dr
 Democracy    30
 Democracy    50
 Democracy    90
 Autocracy    30
 Autocracy    50
 Autocracy    90
Rather than chose arbitrary values like 30, 50, and 90, we can calculate the slope of resource equality at each possible value to better understand how the effect changes across the full range of the equality index. We can visualize the results from this large reference grid with plot_slopes(). We see similar trends, but in better detail now. Democracies with low levels of equality see much larger effects as equality increases, peaking at a roughly 20 percentage point increase in the probability of impartiality. These effects drop down to zero in countries with higher levels of equality. Autocracies, in contrast, have smaller effects at the extremes of resource equality, but see steeper or larger effects at middle values of equality, peaking at a roughly 10 percentage point increase in the probability of the outcome in countries with an equality index between 50 and 60.
plot_slopes(m, variables = "eq_dr", condition = c("eq_dr", "democracy")) +
  geom_vline(xintercept = c(30, 50, 90), linetype = "dotted")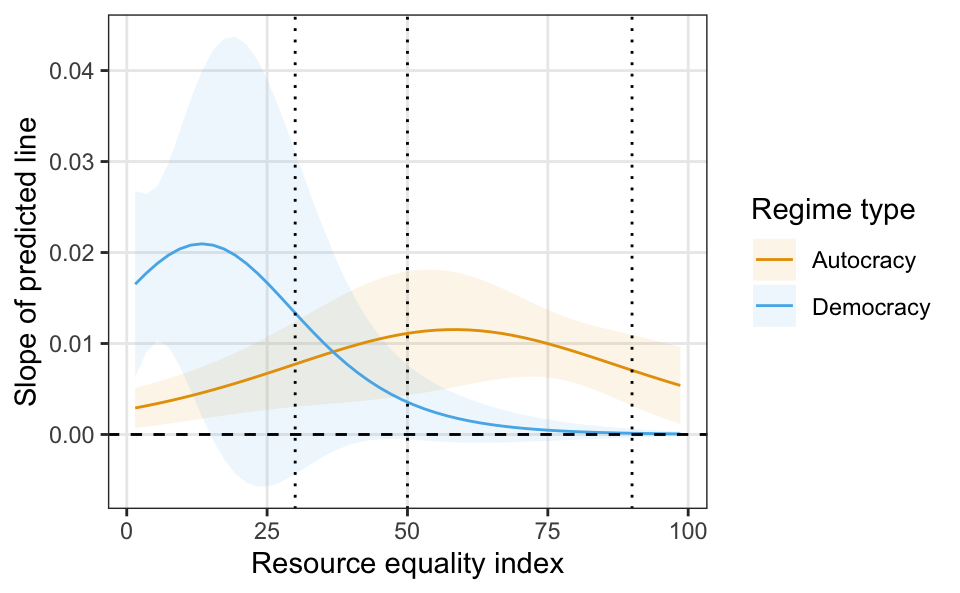
Additional features
Plot customization
As illustrated above, includes automatic plotting functions for each of three possible quantities or estimands: plot_predictions(), plot_comparisons(), and plot_slopes(). Since these functions return standard ggplot() objects, we can customize these plots by adding additional layers to change aesthetic scales, add labels, or modify themes:
plot_predictions(m, condition = c("democracy", "continent")) +
  scale_y_continuous(labels = scales::label_percent()) +  # Use % format
  scale_color_brewer(palette = "Dark2") +  # Use the Dark2 ColorBrewer palette
  labs(                                    # Add better labels
    x = "Regime type",
    y = "Predicted probability of\nimpartial public sector",
    color = NULL
  ) +
  theme_bw() +                             # Adjust the theme
  theme(legend.position = "bottom")
Bayesian models
’s core predictions(), comparisons(), and slopes() functions support a wide range of linear, GLM, GAMM, multilevel, and Bayesian models. We can use the package to fit a Bayesian regression model and work with the complete posterior distributions of our quantities of interest. posterior_draws() can extract draws as raw matrices, tidy data frames, or other formats like rvar.
library(brms)
library(ggdist)

b <- brm(
  bf(impartial ~ eq_dr * democracy + continent),
  data = dat, family = bernoulli
)

avg_comparisons(b, variables = "democracy") |>
  posterior_draws(shape = "rvar") |>
  ggplot(aes(xdist = rvar, y = term)) +
  stat_halfeye()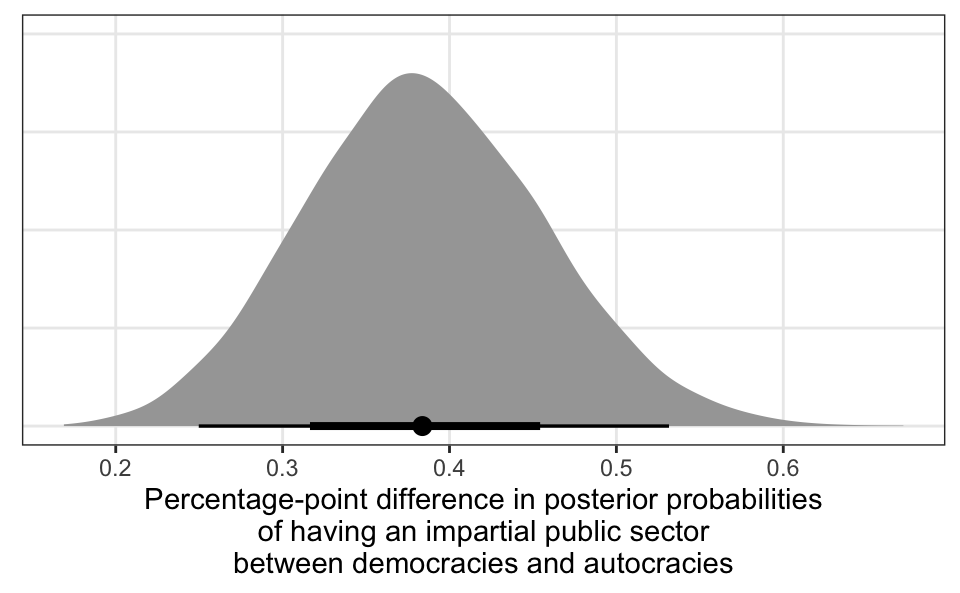
TODO: OTHER STUFF?
Coppedge, Michael, John Gerring, Carl Henrik Knutsen, Staffan I. Lindberg, Jan Teorell, David Altman, Michael Bernhard, et al. 2023. “V-Dem [Country-Year/Country-Date] Dataset V13.” Varieties of Democracy (V-Dem) Project. https://doi.org/10.23696/vdemds23.
Maerz, Seraphine F., Amanda B. Edgell, Sebastian Hellemeier, and Nina Illchenko. 2022. Vdemdata: An r Package to Load, Explore and Work with the Most Recent v-Dem (Varieties of Democracy) Dataset. https://github.com/vdeminstitute/vdemdata.
Rothstein, Bo, and Jan Teorell. 2008. “What Is Quality of Government? A Theory of Impartial Government Institutions.” Governance 21 (2): 165–90. https://doi.org/10.1111/j.1468-0491.2008.00391.x.
Suzuki, Kohei, and Mehmet Akif Demircioglu. 2021. “Is Impartiality Enough? Government Impartiality and Citizens’ Perceptions of Public Service Quality.” Governance 34 (3): 727–64. https://doi.org/10.1111/gove.12527.
Footnotes
We simplified many of these variables for the sake of illustration. For
impartial, we collapse the five levels of V-Dem’sv2clrspct_ordinto a binary indicator, where levels 2–4 represent impartial governance and levels 0–1 represent not impartial governance; foreq_drwe multiply V-Dem’sv2xeg_eqdrvariable by 100; fordemocracy, we collapse the four levels of V-Dem’s “Regimes of the world” measure (v2x_regime) into a binary indicator, where “Autocracy” includes closed autocracies and electoral autocracies and “Democracy” includes electoral democracies and liberal democracies.↩︎Specifying
newdata = "mean"is a convenient shortcut for ’s more generaldatagrid()function.↩︎In linear models, the results of
avg_predictions(m)andmean(predictions(m)$estimate)are identical. However, in GLM models, predictions are made on the link scale, averaged, and then transformed to the response scale, resulting in different average predictions. With logistic regression,avg_predictions(m)is the equivalent ofplogis(mean(predictions(m, type = "link")$estimate)).↩︎By default this is \((\max(\text{Variable}) - \min(\text{Variable})) \times 0.0001\).↩︎